
- Moving the markets
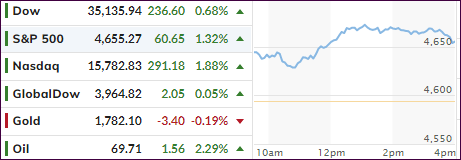
The Dow was the most volatile of the major indexes by giving up an early 380-point gain and retreating almost all the way back to the unchanged line. The sudden turnaround happened with lightning speed after Biden’s announcement that Covid lockdowns were not needed for now, despite MSM fearmongering about the latest omicron variant.
Added Fundstrat’s Tom Lee:
“As with the case for Beta and Delta variants, the ‘bark’ has proven worse than the bite in each of those precedent instances. The market carnage, in our view, will be short-lived and transitory.”
That’s all it took, and the bears had their way with a ramp-a-thon designed to make up for some of Friday’s losses. The mission succeeded, as the Nasdaq took the lead with a solid 1.88% comeback with marquee names like Microsoft, Amazon, and Apple evolving as the winners.
Bond yields moved higher but slumped into the close with the 10-year ending at 1.52%. The US Dollar rode a roller coaster and rallied but only by a moderate 0.18% causing gold to tread water.
The ongoing battle between “growth” and “value” was clearly won by the former with RPG sporting a 1.95% gain, while the latter, as measured by RPV, gave back 0.17%.
On deck this Friday will be the all-important jobs report with economists expecting optimistic gains of 581k new jobs added in November.
Hmm…
2. ETFs in the Spotlight
In case you missed the announcement and description of this section, you can read it here again.
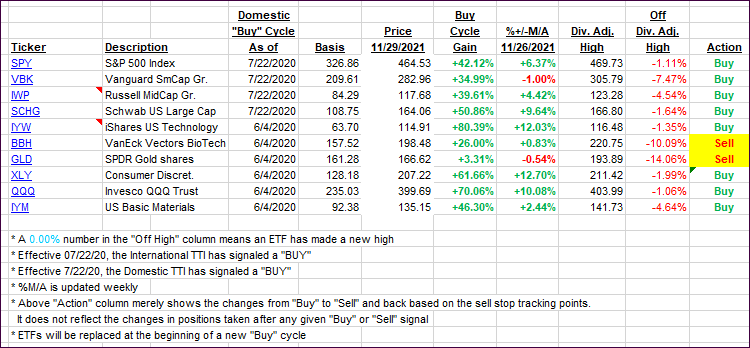
It features some of the 10 broadly diversified domestic and sector ETFs from my HighVolume list as posted every Saturday. Furthermore, they are screened for the lowest MaxDD% number meaning they have been showing better resistance to temporary sell offs than all others over the past year.
The below table simply demonstrates the magnitude with which these ETFs are fluctuating above or below their respective individual trend lines (%+/-M/A). A break below, represented by a negative number, shows weakness, while a break above, represented by a positive percentage, shows strength.
For hundreds of ETF choices, be sure to reference Thursday’s StatSheet.
For this current domestic “Buy” cycle, here’s how some our candidates have fared:
Click image to enlarge.
Again, the %+/-M/A column above shows the position of the various ETFs in relation to their respective long-term trend lines, while the trailing sell stops are being tracked in the “Off High” column. The “Action” column will signal a “Sell” once the -8% point has been taken out in the “Off High” column. For more volatile sector ETFs, the trigger point is -10%.
3. Trend Tracking Indexes (TTIs)
Our TTIs recovered from Friday’s drubbing, but it was not enough for the International one to craw back above its trend line.
This is how we closed 11/29/2021:
Domestic TTI: +4.57% above its M/A (prior close +3.70%)—Buy signal effective 07/22/2020.
International TTI: -0.81% below its M/A (prior close -0.88%)—Buy signal effective 07/22/2020.
Disclosure: I am obliged to inform you that I, as well as my advisory clients, own some of the ETFs listed in the above table. Furthermore, they do not represent a specific investment recommendation for you, they merely show which ETFs from the universe I track are falling within the specified guidelines.
All linked charts above are courtesy of Bloomberg via ZeroHedge.
Contact Ulli