
- Moving the markets
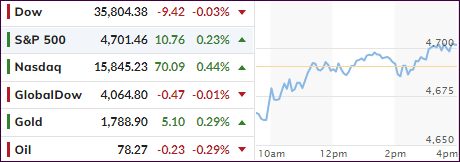
The major indexes managed to pull themselves out of on early hole, caused by a continued rise in bond yields, which eased later in the session thereby giving a much-needed comeback to the equity spectrum.
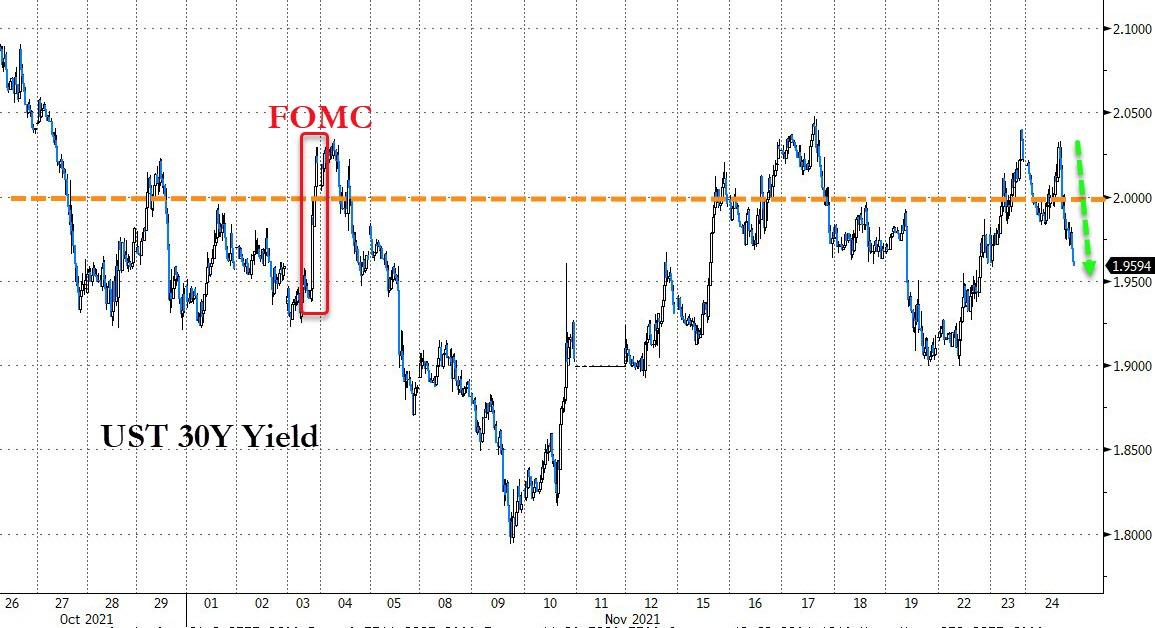
It looks like the renomination of Fed chief Powell, accompanied by a spike in yields, finally found some acceptance by Wall Street traders and therefore helped to cool the levitation. The 10-year traded above the 1.68% level this week but dipped down to close at 1.64%, while the 30-year tumbled back below 2%.
On the economic front, we were faced with the following headlines:
- New Home Sales Data Suffers Huge Downward Revisions, Inventories Hit 13-Year-High
- Fed’s Favorite Inflation Indicator At 30-Year-High As Savings Rate Plunges To Pre-COVID Levels
- US Durable Goods Orders Unexpectedly Suffer First Back-To-Back Drop Since April 2020
- The Number Of Americans Filing For First-Time Jobless Benefits Was The Lowest Since 1969 Last Week
Only the last one was a positive, while all others indicated nothing more than a sputtering economy. If this trend continues, it will be just a matter of time until the dreaded “S” word, as in Stagflation, will make itself known again.
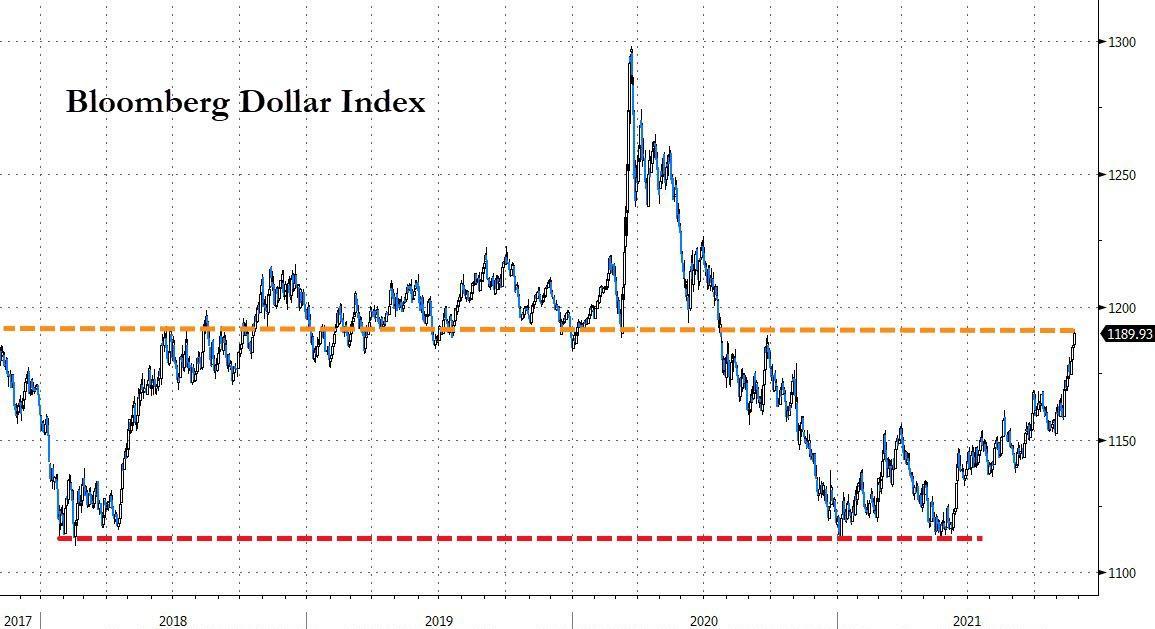
The US Dollar pumped early on and closed higher by 0.35% but slipped off its high. It has now pierced the September 2020 glass ceiling and hovers at its highest since July 2020, as Zero Hedge pointed out.
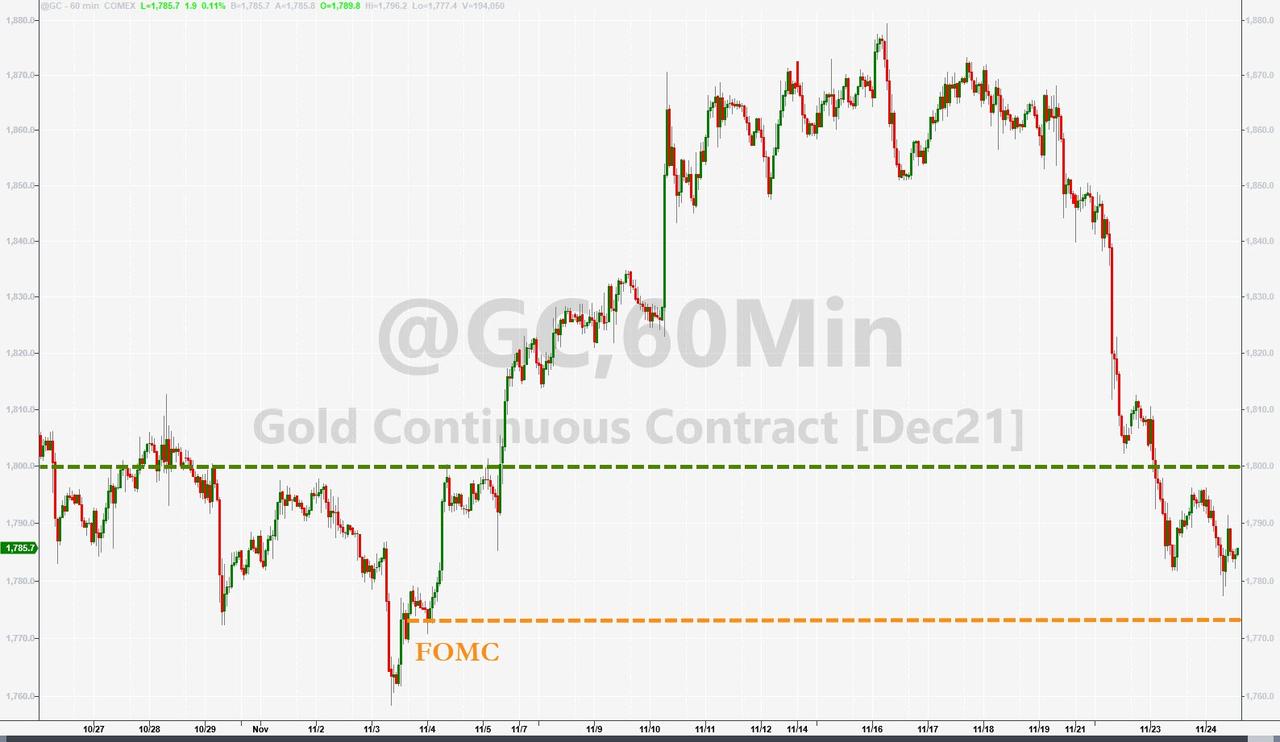
With yields and dollars climbing, it was surprising to see gold hold steady with the precious metal adding a scant 0.27% but remaining below its $1,800 level.
As posted Monday, this Friday will be a shortened trading session, and will not write a commentary. However, I will post Saturday’s “ETFs on the Cutline” report.
In the meantime, I hope you’ll enjoy the Thanksgiving Holiday.
2. ETFs in the Spotlight
In case you missed the announcement and description of this section, you can read it here again.
It features some of the 10 broadly diversified domestic and sector ETFs from my HighVolume list as posted every Saturday. Furthermore, they are screened for the lowest MaxDD% number meaning they have been showing better resistance to temporary sell offs than all others over the past year.
The below table simply demonstrates the magnitude with which these ETFs are fluctuating above or below their respective individual trend lines (%+/-M/A). A break below, represented by a negative number, shows weakness, while a break above, represented by a positive percentage, shows strength.
For hundreds of ETF choices, be sure to reference Thursday’s StatSheet.
For this current domestic “Buy” cycle, here’s how some our candidates have fared:
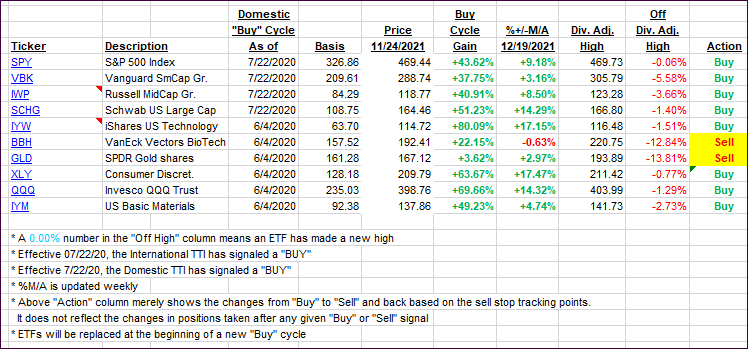
Click image to enlarge.
Again, the %+/-M/A column above shows the position of the various ETFs in relation to their respective long-term trend lines, while the trailing sell stops are being tracked in the “Off High” column. The “Action” column will signal a “Sell” once the -8% point has been taken out in the “Off High” column. For more volatile sector ETFs, the trigger point is -10%.
3. Trend Tracking Indexes (TTIs)
Our TTIs moved irrelevantly, as the markets were busy digging themselves out of an early hole.
This is how we closed 11/24/2021:
Domestic TTI: +6.90% above its M/A (prior close +6.85%)—Buy signal effective 07/22/2020.
International TTI: +1.88% above its M/A (prior close +1.89%)—Buy signal effective 07/22/2020.
Disclosure: I am obliged to inform you that I, as well as my advisory clients, own some of the ETFs listed in the above table. Furthermore, they do not represent a specific investment recommendation for you, they merely show which ETFs from the universe I track are falling within the specified guidelines.
All linked charts above are courtesy of Bloomberg via ZeroHedge.
Contact Ulli