
- Moving the markets
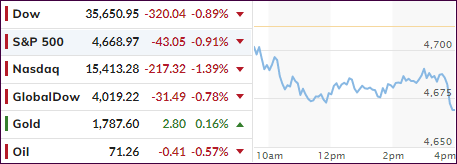
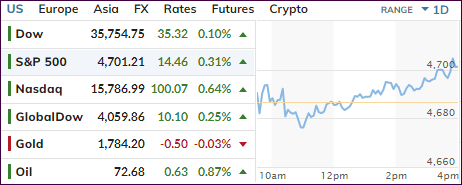
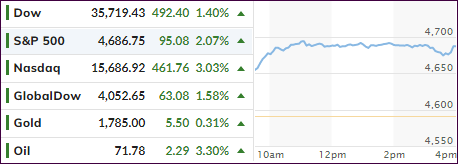
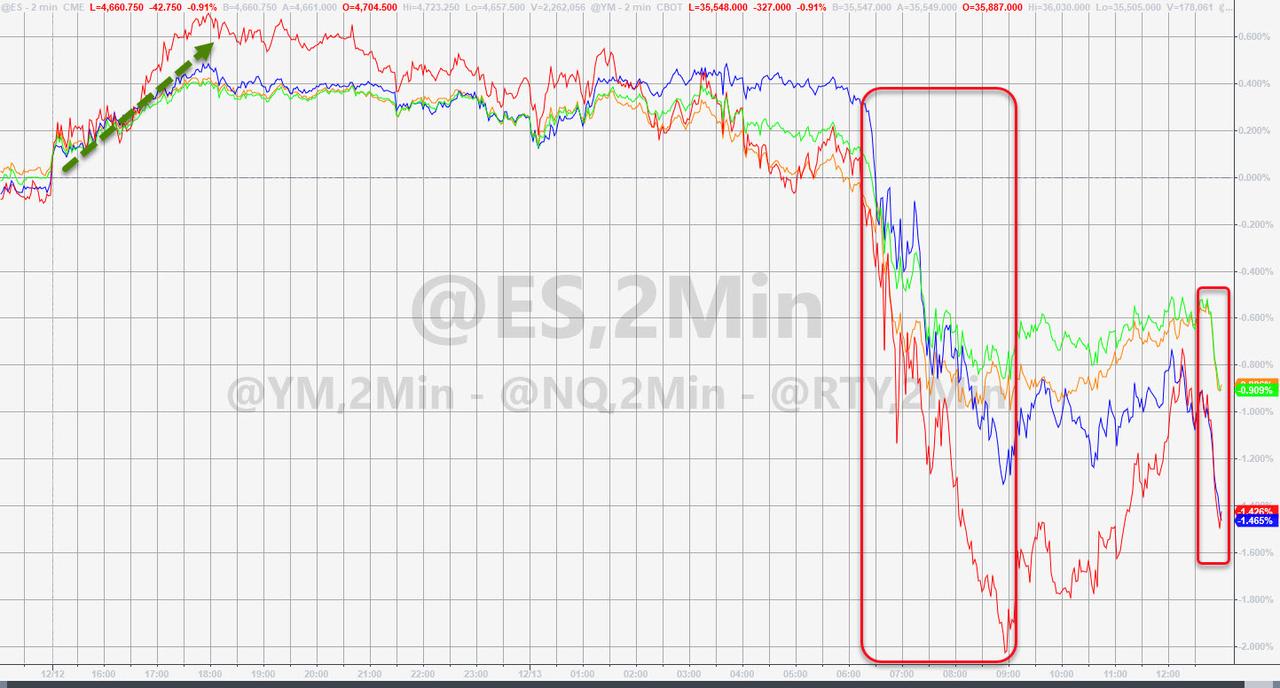
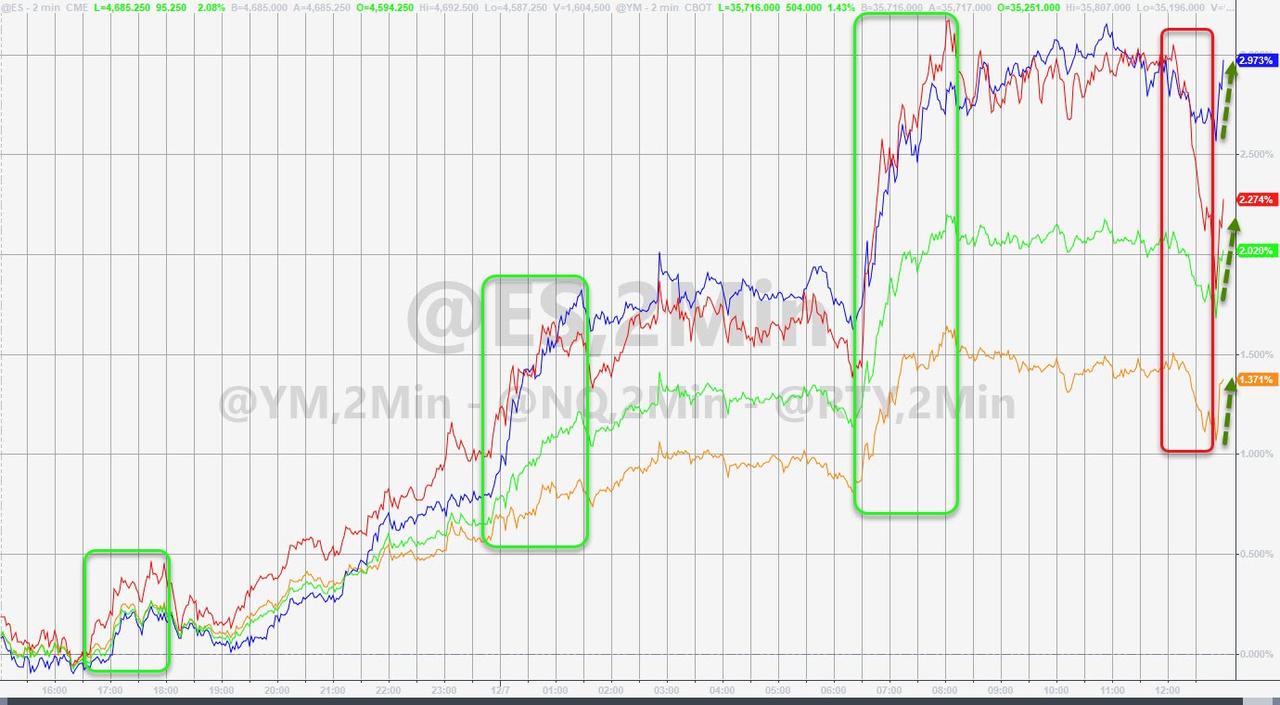
Despite the futures markets showing solid gains across the board last night, a sense of reality returned this morning, with all indexes opening to the downside.
A mid-day rebound ended in disappointment, as the bears asserted some strength and pushed the major indexes towards their lows of the session. However, this really comes as no surprise considering that the S&P 500 merely retreated from its record high set on Friday.
Adding to the uncertainty were continued jitters about the omicron variant and its potential economic impact, despite a host of scientists and physicians playing down its severity, but MSM is staunchly focused on fearmongering.
Also on traders’ minds is the outcome of the Fed’s two-day meeting to be released on Wednesday, with the main topics being the possible acceleration to end the bond-buying program, along with any thoughts of interest rate hikes. The Fed must handle both events with kid gloves and tread lightly, otherwise investors might be spooked and hand the baton to the bearish crowd.
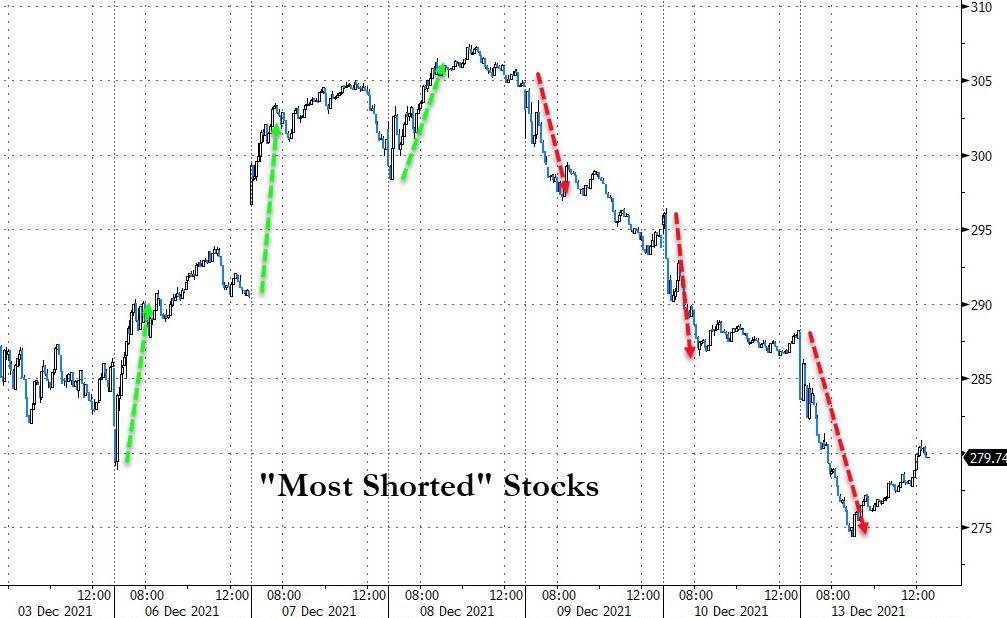
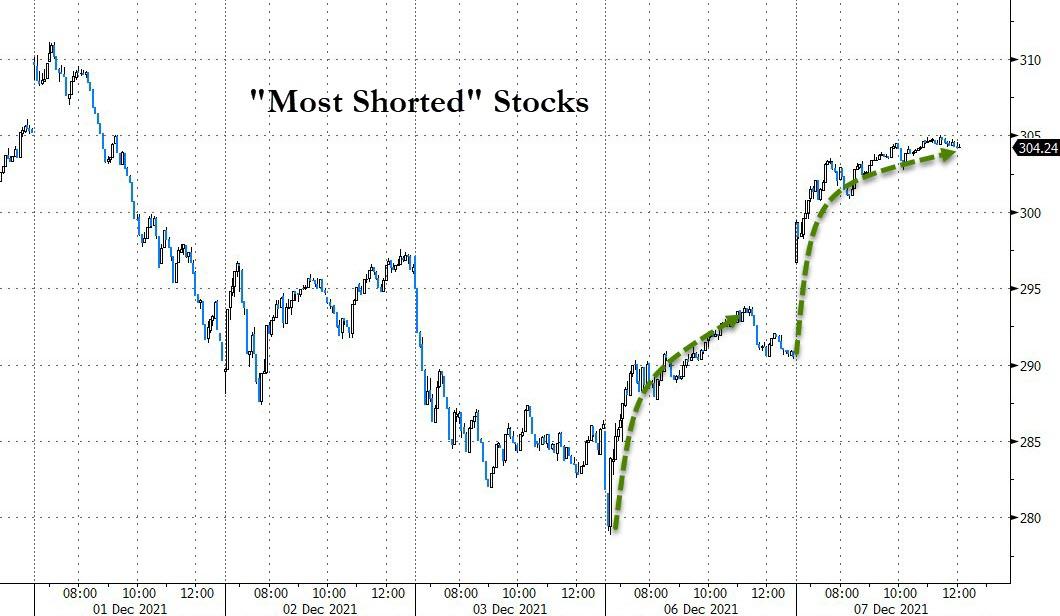
Last week’s massive short-squeeze, which peaked on Wednesday, ran into a brick wall and gave up all gains, with the underlying shorted stocks now doing what they are supposed to, namely drop.
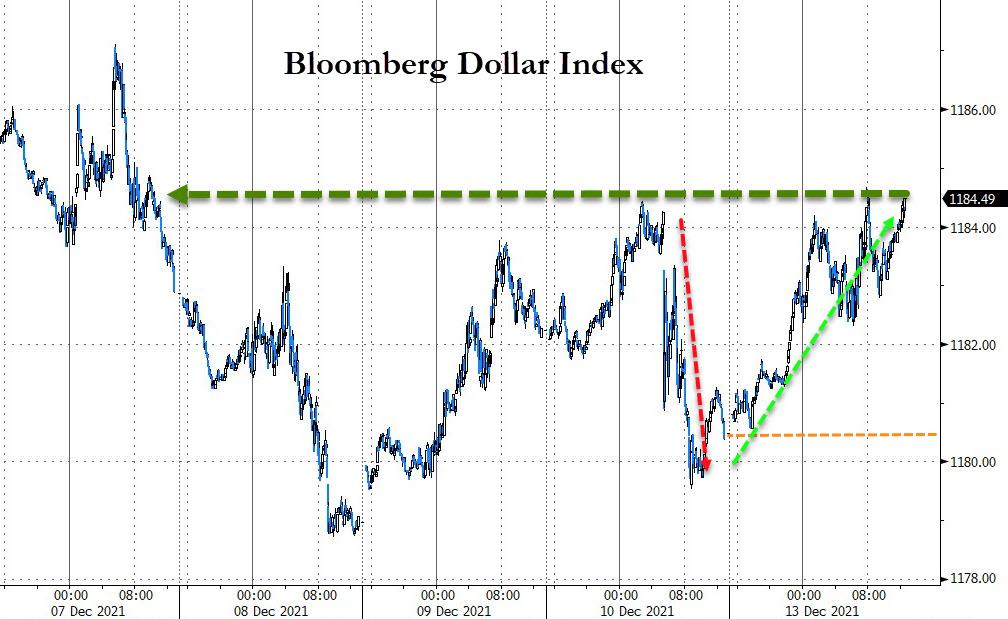
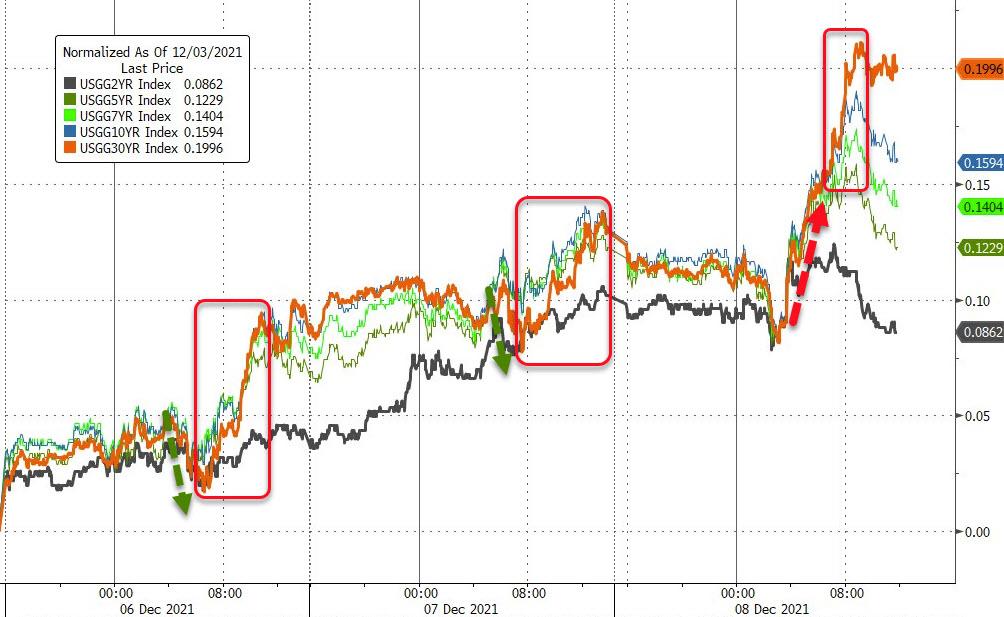
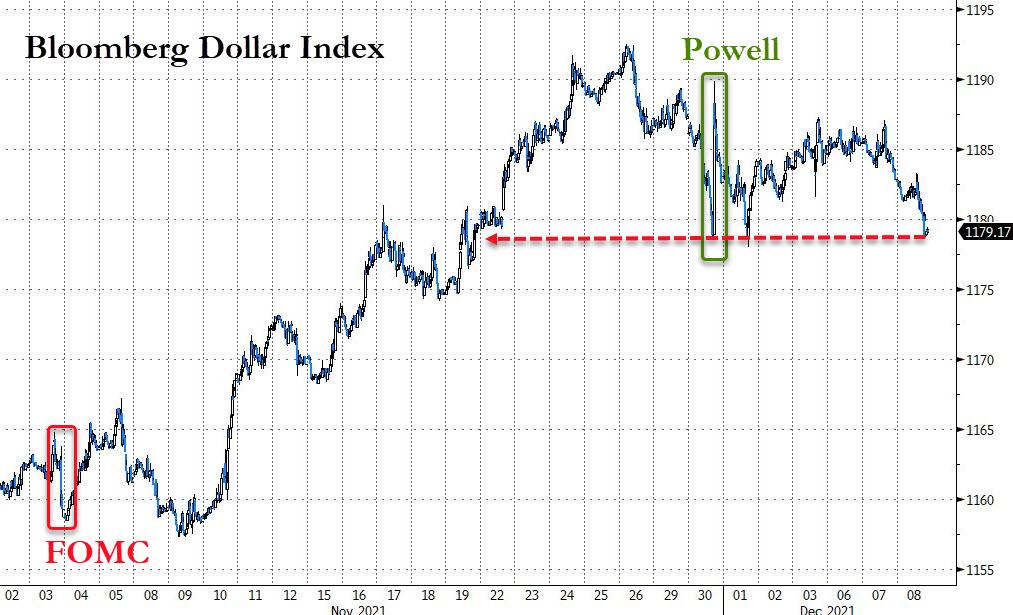
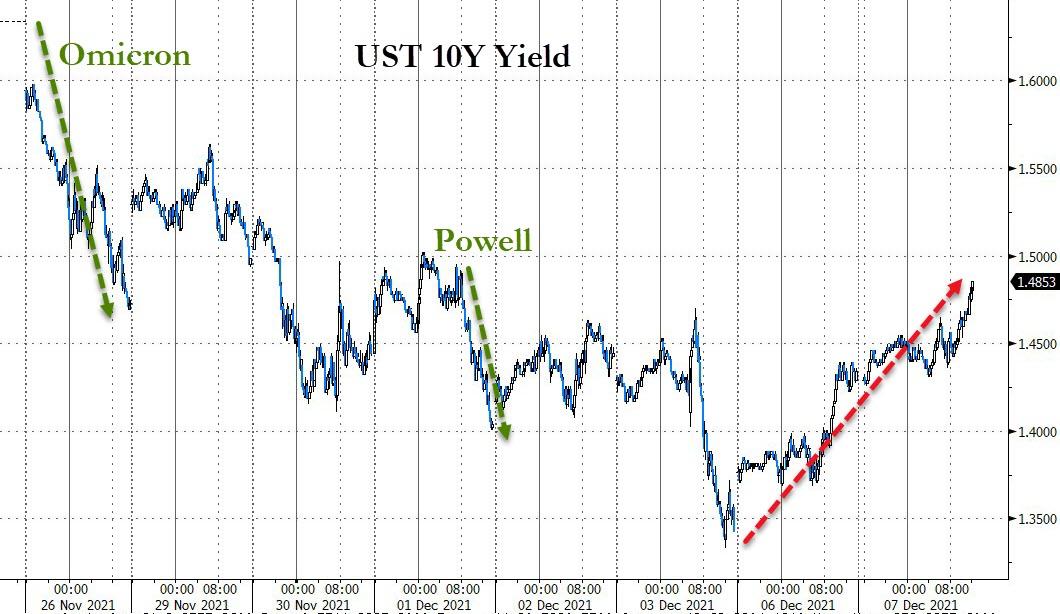
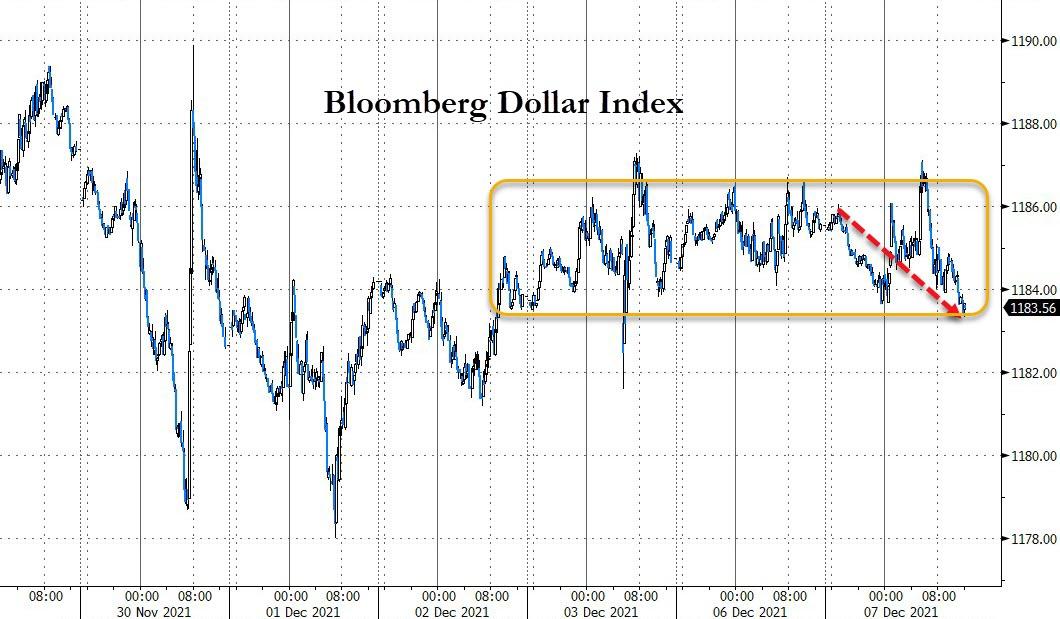
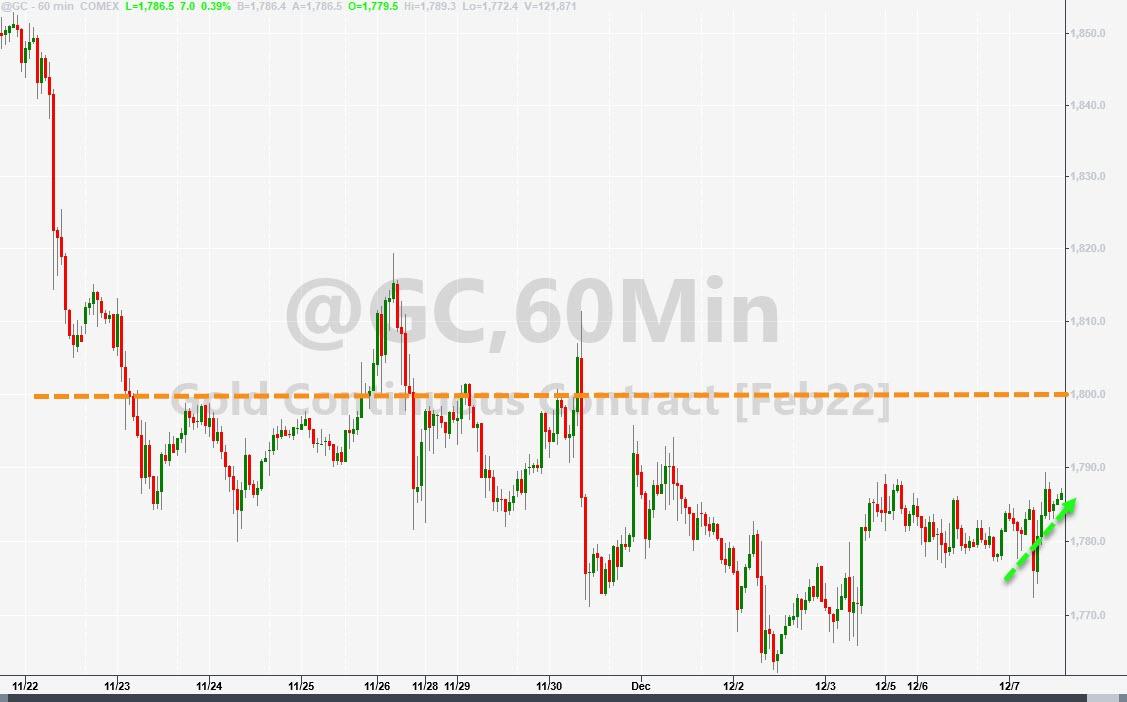
Bonds rallied as yields dropped, and the US Dollar recaptured Friday’s losses in one swoop. Gold mainly bounced above its trendline yet only managed to score a meager gain of 0.17%.
All eyes are now on Wednesday’s Federal Reserve policy decision.
Read More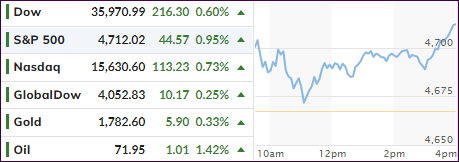
