
- Moving the markets
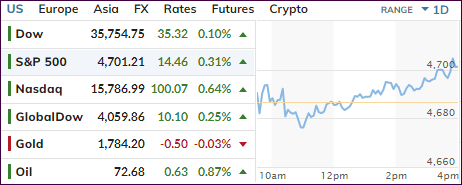
Despite some early wobbling, with the major indexes dipping below their respective unchanged lines, dip buyers stepped in late in the session and drove equites to a green close. The rebound effort was led by the Nasdaq with a 0.64% gain, while the Dow lagged but managed to advance by a tiny 0.10%.
The positive mood was the result of traders viewing the influence of the Omicron variant not as frightening as originally thought, thereby crossing one item off the worry list—that is for the time being.
Aiding the late afternoon rebound were announcements by Pfizer and BioNTech saying that “three doses of their vaccine are effective at neutralizing the omicron variant,” according to their own lab tests. They also pronounced that taking two doses still protect against the disease.
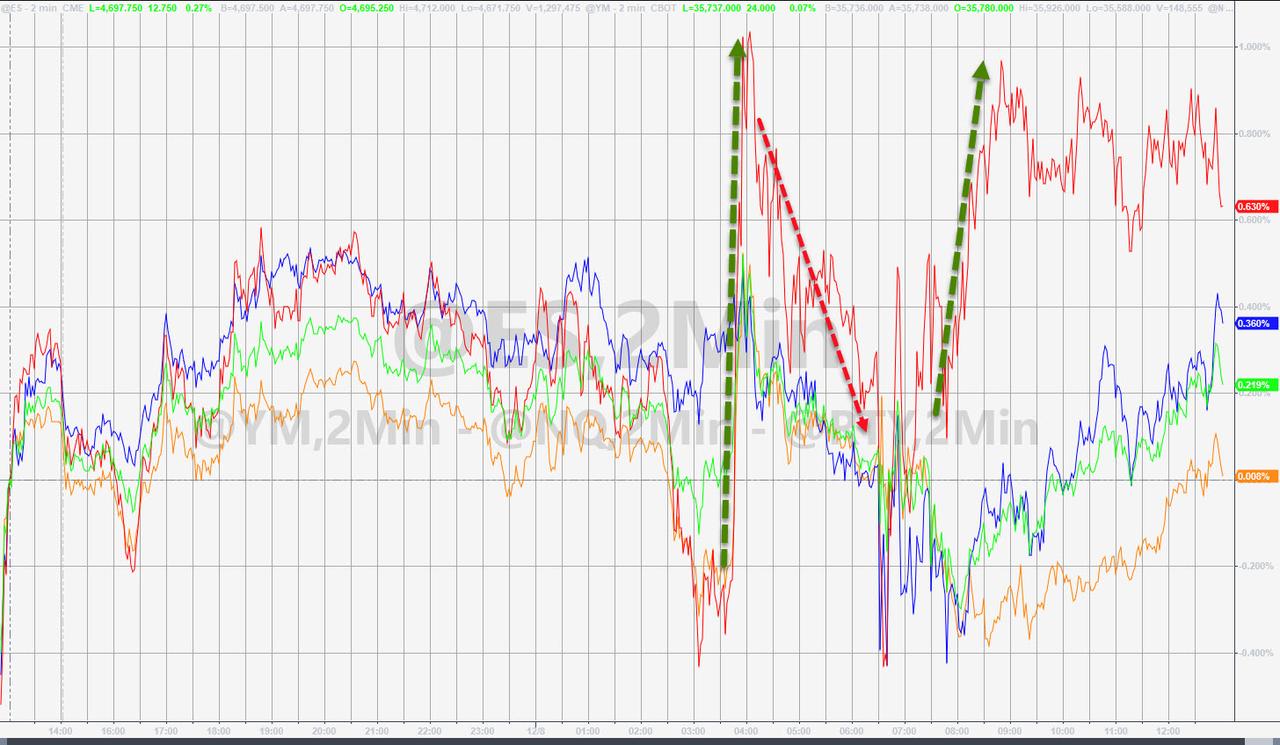
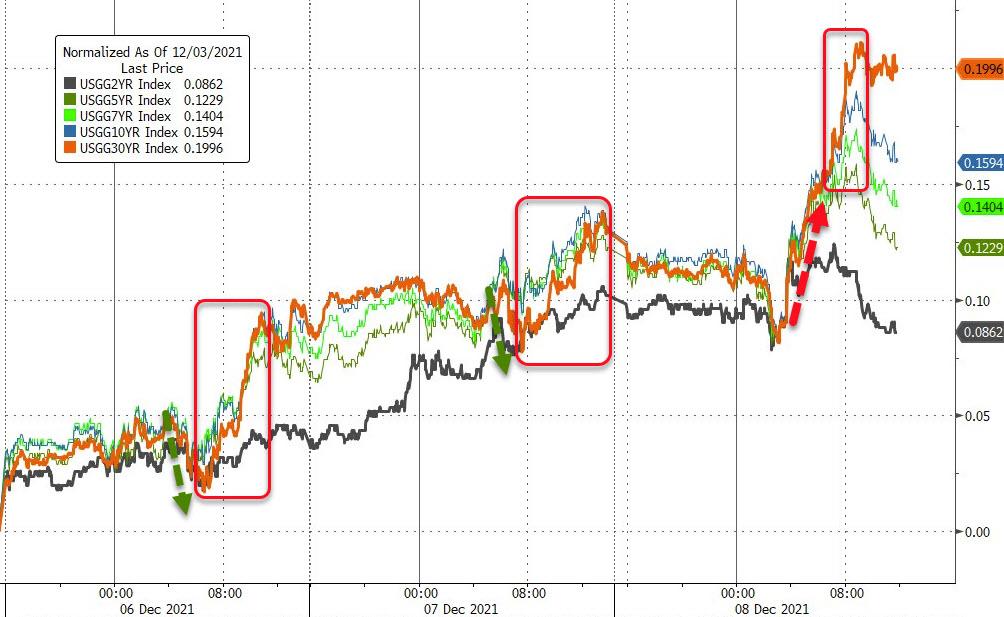
The award for the most chaotic roller coaster ride of the day goes to SmallCaps, which pumped, dumped and pumped and outperformed. Bond yields took an early dive, recovered, and stormed higher with the 10-year ending the day at 1.52%.
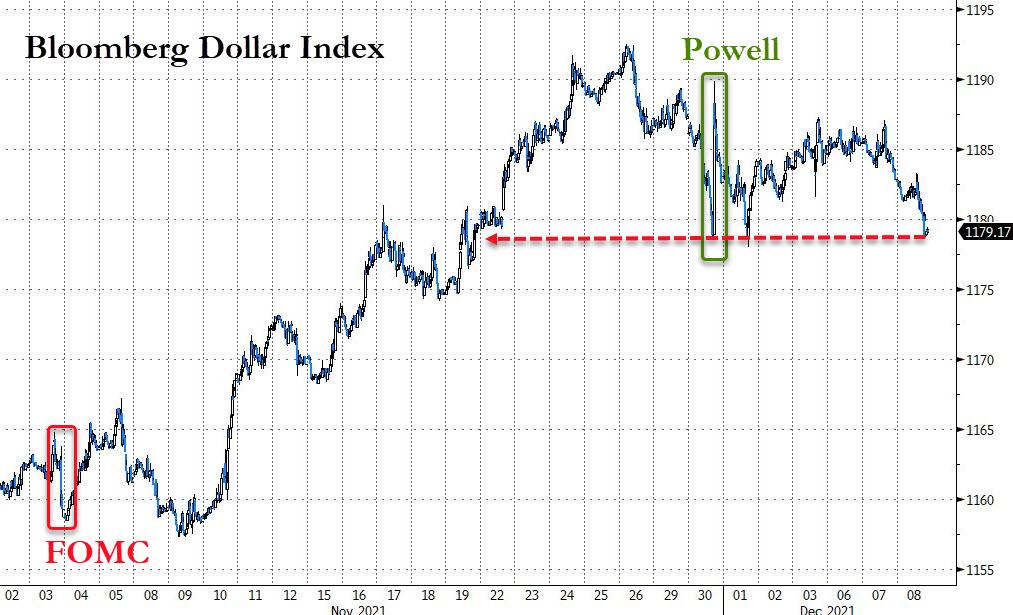
The US Dollar took a drop today by losing 0.48%, which allowed gold to built on yesterday’s bounce-back. The precious metal also was stuck on a wild ride, gave up mid-session gains, and closed just about unchanged.
I will be out tomorrow but will be back on Friday to write the week ending commentary.
2. ETFs in the Spotlight
In case you missed the announcement and description of this section, you can read it here again.
It features some of the 10 broadly diversified domestic and sector ETFs from my HighVolume list as posted every Saturday. Furthermore, they are screened for the lowest MaxDD% number meaning they have been showing better resistance to temporary sell offs than all others over the past year.
The below table simply demonstrates the magnitude with which these ETFs are fluctuating above or below their respective individual trend lines (%+/-M/A). A break below, represented by a negative number, shows weakness, while a break above, represented by a positive percentage, shows strength.
For hundreds of ETF choices, be sure to reference Thursday’s StatSheet.
For this current domestic “Buy” cycle, here’s how some our candidates have fared:
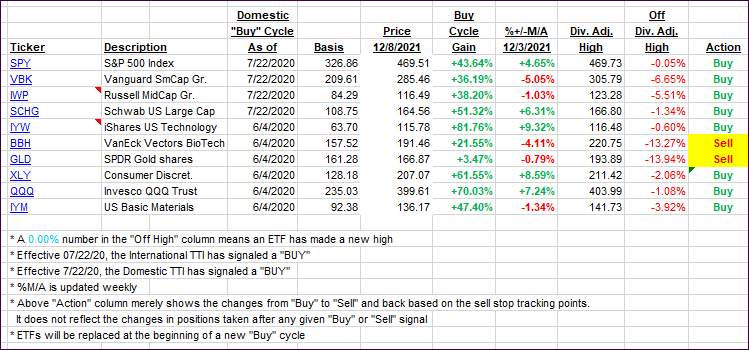
Click image to enlarge.
Again, the %+/-M/A column above shows the position of the various ETFs in relation to their respective long-term trend lines, while the trailing sell stops are being tracked in the “Off High” column. The “Action” column will signal a “Sell” once the -8% point has been taken out in the “Off High” column. For more volatile sector ETFs, the trigger point is -10%.
3. Trend Tracking Indexes (TTIs)
Our TTIs edged deeper into bullish territory, as the markets recorded their 3rd straight day of gains.
This is how we closed 12/08/2021:
Domestic TTI: +5.61% above its M/A (prior close +5.34%)—Buy signal effective 07/22/2020.
International TTI: +1.43% above its M/A (prior close +1.25%)—Buy signal effective 07/22/2020.
Disclosure: I am obliged to inform you that I, as well as my advisory clients, own some of the ETFs listed in the above table. Furthermore, they do not represent a specific investment recommendation for you, they merely show which ETFs from the universe I track are falling within the specified guidelines.
All linked charts above are courtesy of Bloomberg via ZeroHedge.
Contact Ulli