
- Moving the markets
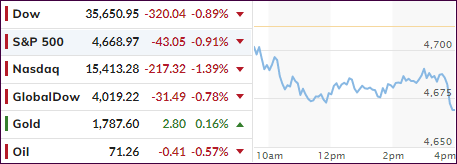
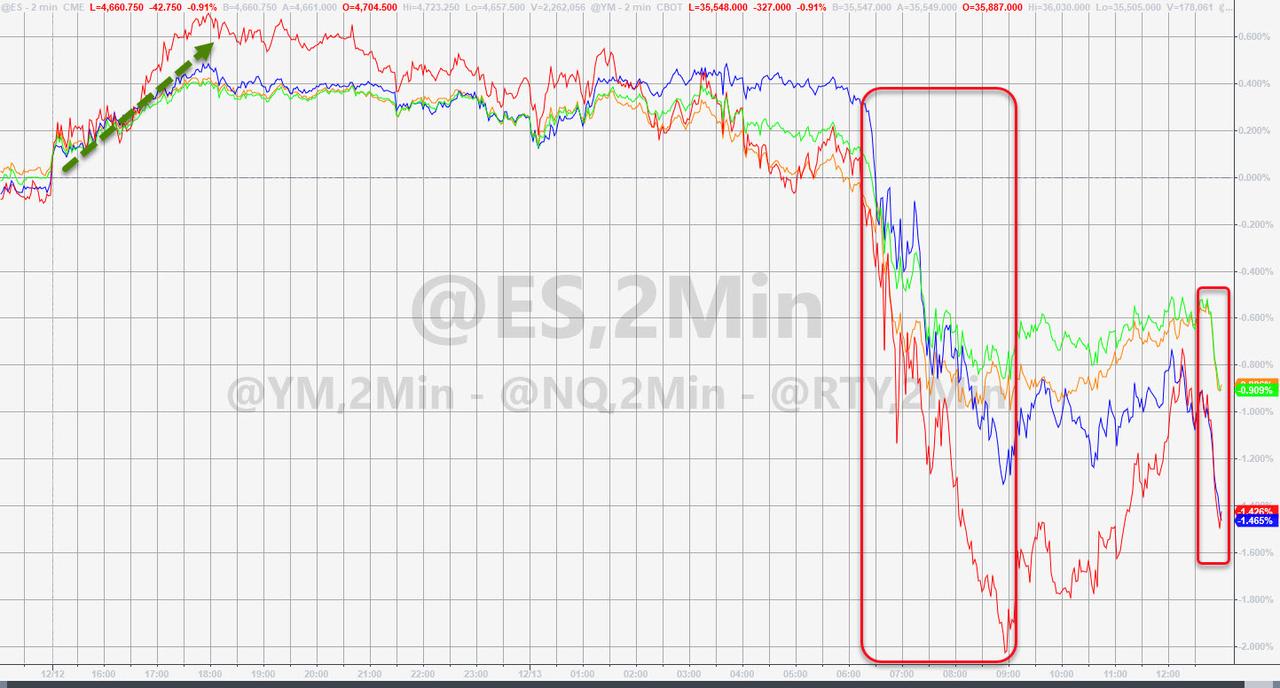
Despite the futures markets showing solid gains across the board last night, a sense of reality returned this morning, with all indexes opening to the downside.
A mid-day rebound ended in disappointment, as the bears asserted some strength and pushed the major indexes towards their lows of the session. However, this really comes as no surprise considering that the S&P 500 merely retreated from its record high set on Friday.
Adding to the uncertainty were continued jitters about the omicron variant and its potential economic impact, despite a host of scientists and physicians playing down its severity, but MSM is staunchly focused on fearmongering.
Also on traders’ minds is the outcome of the Fed’s two-day meeting to be released on Wednesday, with the main topics being the possible acceleration to end the bond-buying program, along with any thoughts of interest rate hikes. The Fed must handle both events with kid gloves and tread lightly, otherwise investors might be spooked and hand the baton to the bearish crowd.
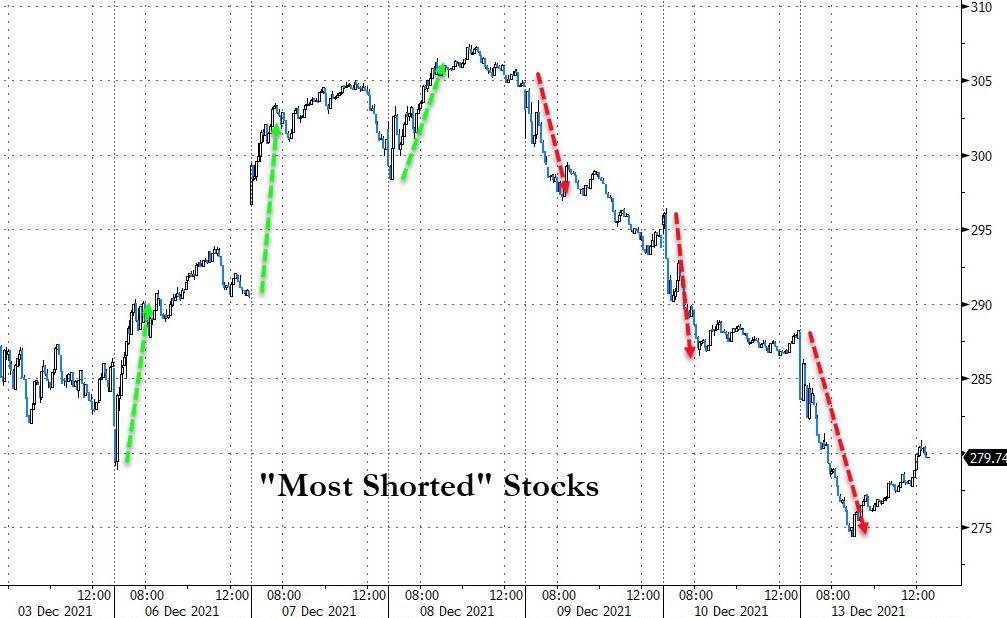
Last week’s massive short-squeeze, which peaked on Wednesday, ran into a brick wall and gave up all gains, with the underlying shorted stocks now doing what they are supposed to, namely drop.
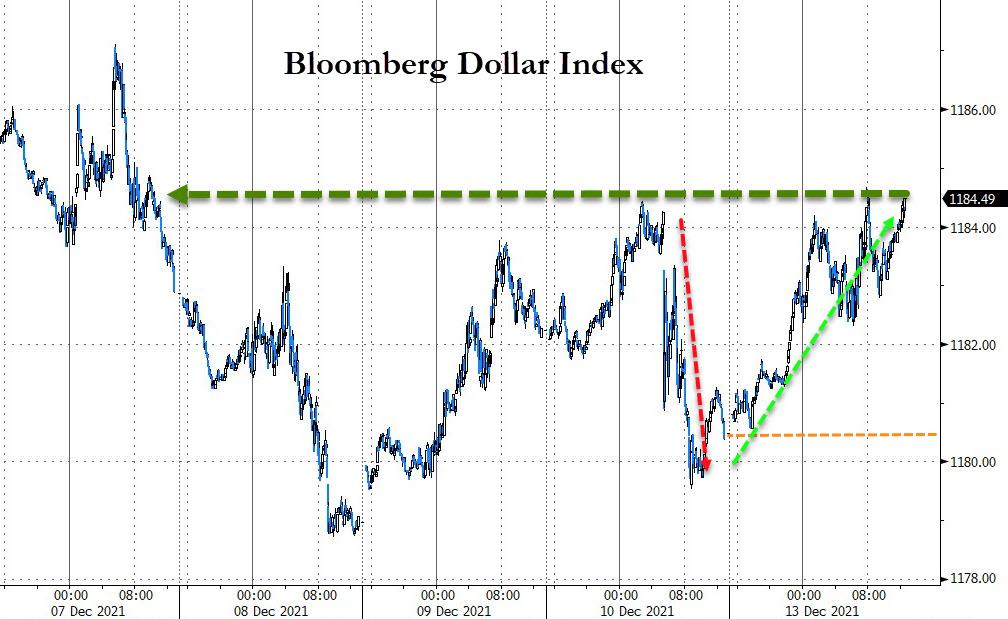
Bonds rallied as yields dropped, and the US Dollar recaptured Friday’s losses in one swoop. Gold mainly bounced above its trendline yet only managed to score a meager gain of 0.17%.
All eyes are now on Wednesday’s Federal Reserve policy decision.
2. ETFs in the Spotlight
In case you missed the announcement and description of this section, you can read it here again.
It features some of the 10 broadly diversified domestic and sector ETFs from my HighVolume list as posted every Saturday. Furthermore, they are screened for the lowest MaxDD% number meaning they have been showing better resistance to temporary sell offs than all others over the past year.
The below table simply demonstrates the magnitude with which these ETFs are fluctuating above or below their respective individual trend lines (%+/-M/A). A break below, represented by a negative number, shows weakness, while a break above, represented by a positive percentage, shows strength.
For hundreds of ETF choices, be sure to reference Thursday’s StatSheet.
For this current domestic “Buy” cycle, here’s how some our candidates have fared:
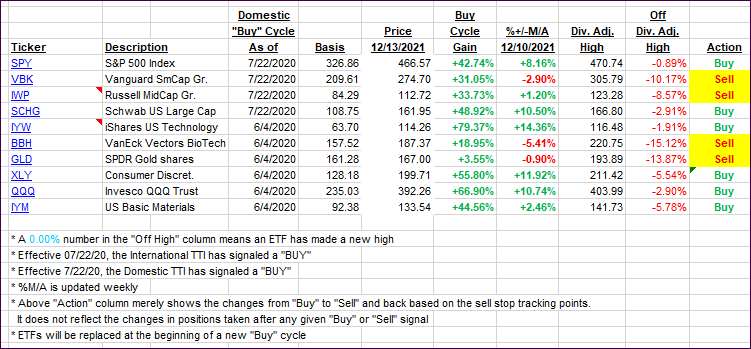
Click image to enlarge.
Again, the %+/-M/A column above shows the position of the various ETFs in relation to their respective long-term trend lines, while the trailing sell stops are being tracked in the “Off High” column. The “Action” column will signal a “Sell” once the -8% point has been taken out in the “Off High” column. For more volatile sector ETFs, the trigger point is -10%.
3. Trend Tracking Indexes (TTIs)
Our TTIs dropped with the International one threatening again to break its trend line to the downside.
This is how we closed 12/13/2021:
Domestic TTI: +4.42% above its M/A (prior close +5.18%)—Buy signal effective 07/22/2020.
International TTI: +0.27% above its M/A (prior close +1.12%)—Buy signal effective 07/22/2020.
Disclosure: I am obliged to inform you that I, as well as my advisory clients, own some of the ETFs listed in the above table. Furthermore, they do not represent a specific investment recommendation for you, they merely show which ETFs from the universe I track are falling within the specified guidelines.
All linked charts above are courtesy of Bloomberg via ZeroHedge.
Contact Ulli