
- Moving the markets
Yesterday’s strong recovery set the tone for further advances, as the bulls proved to be the dominating force after the opening bell rang. There was no hesitation as to the direction with higher prices being in clear focus for this session.
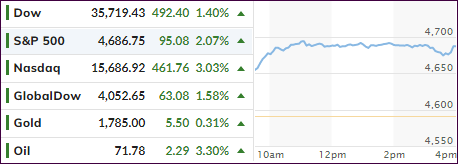
As a result, it was a one-way street with buyers being in charge because of lessening fears of any potential negative economic impact caused by the Omicron variant. In the absence of such worries, at least for this day, the major indexes stormed higher with especially the beaten down Nasdaq sporting a solid comeback of over 3%.
The revival was broad based, but it remains to be seen if any reappearance of Omicron headline news will keep traders in the game, or if we’ll be heading back from a one-way street to a two-way street.
“Growth” trounced “Value” by a huge margin with RPG gaining 3.58% vs. 1.43% for RPV. SmallCaps had a good showing too with VBK gaining 3.12%.
Posted Zero Hedge:
Omicron’s ability to evade vaccine and infection-induced immunity is “robust but not complete,” said the research head of a laboratory at the Africa Health Research Institute in South Africa.
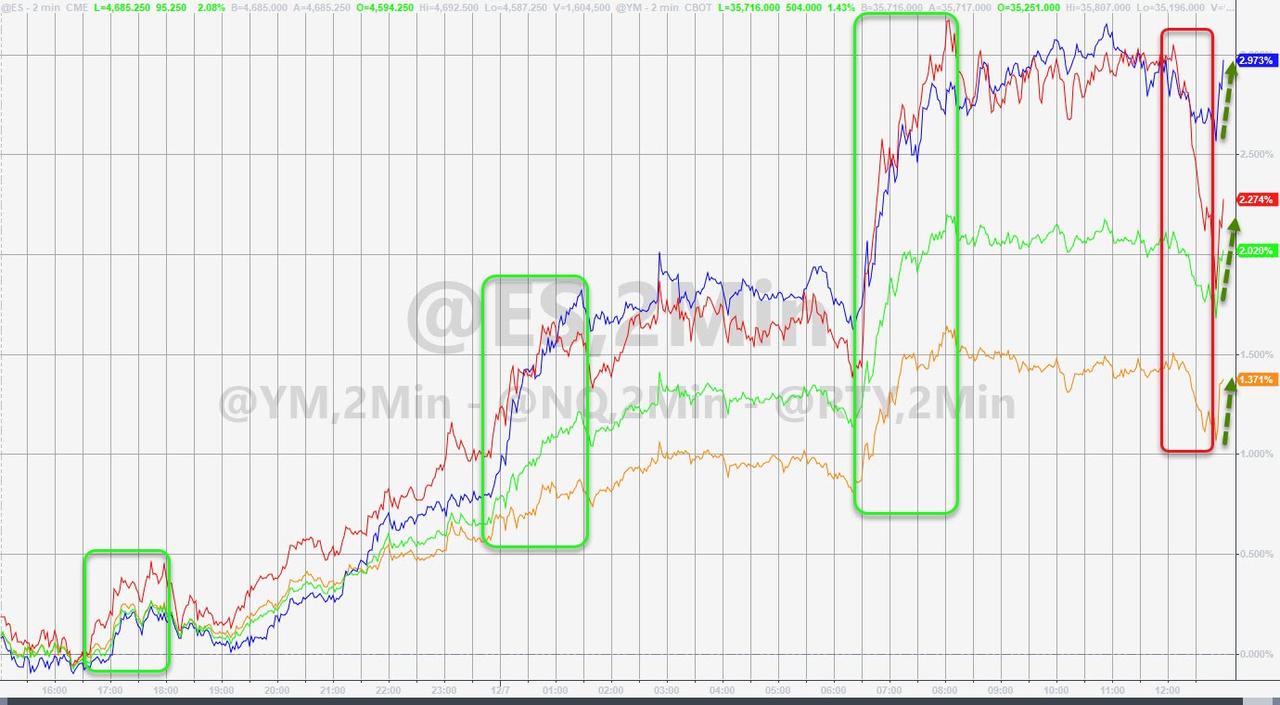
That news item took the starch out of upward momentum late in the day, with markets dipping and then ripping, a phenomenon that was especially apparent and unexplainable in the Nasdaq due to the index gaining 100 points in 4 minutes. Huh?
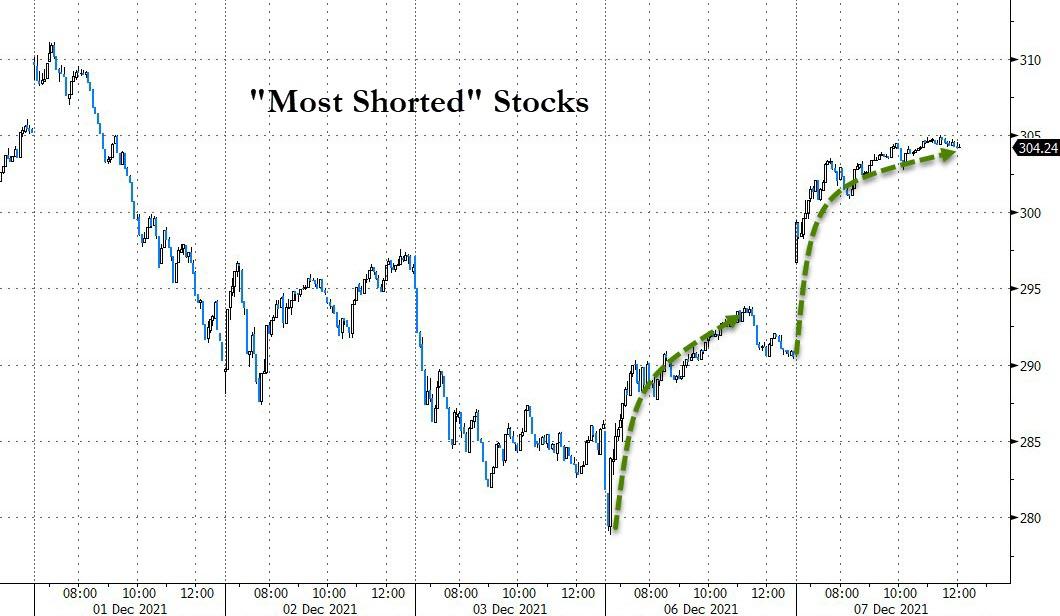
Of course, none of the above would be possible without solid support from another short squeeze, which was simply a continuation of yesterday’s ramp.
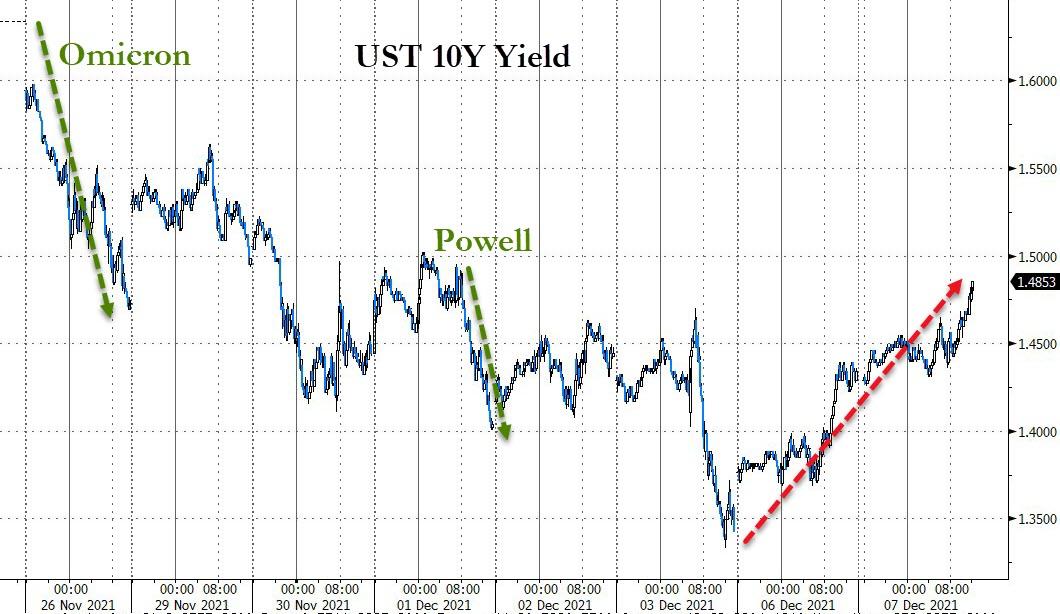
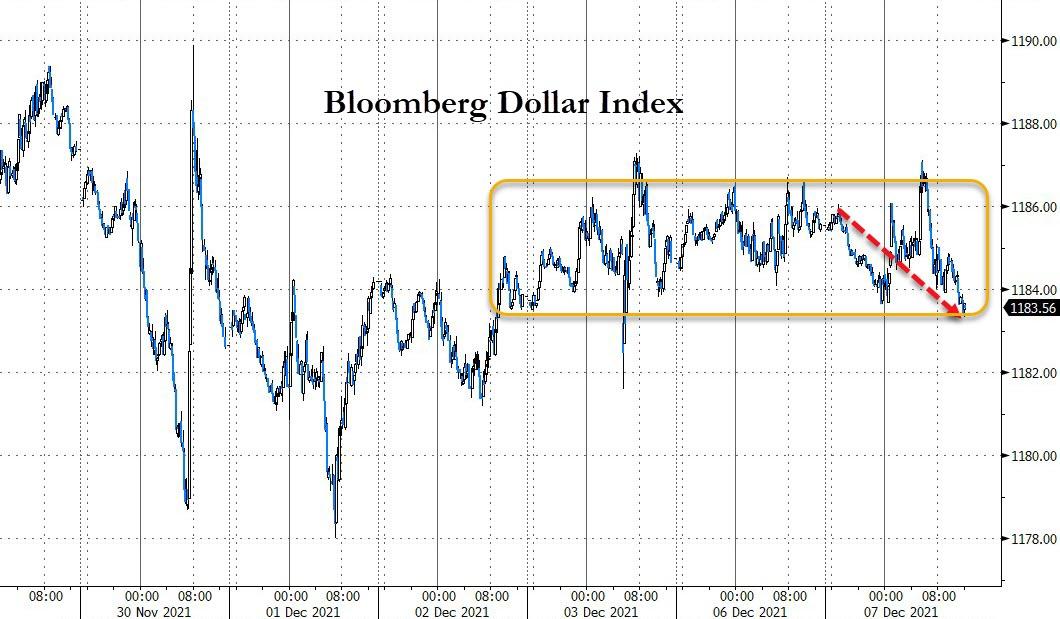
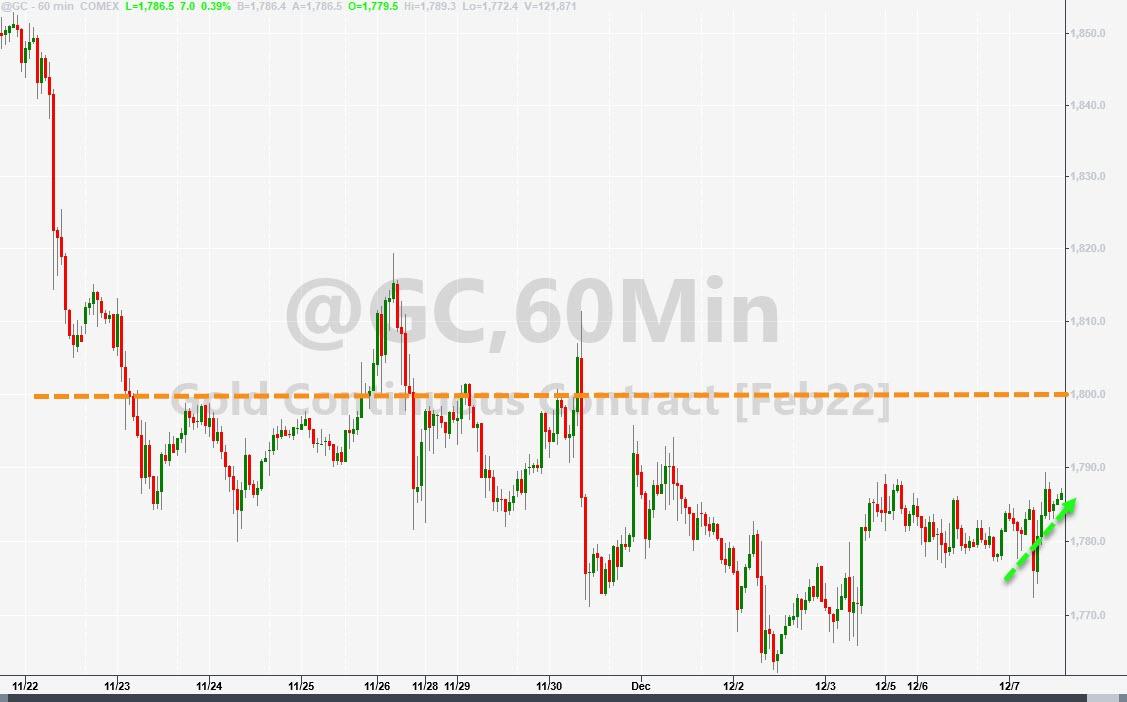
Bond yields rallied with the 10-year digging itself out of a deep hole for the second day in a row. The US Dollar danced within its recent trading range but closed slightly lower. Gold ended near its intra-day highs and gained a modest 0.30%.
It was another good day for the bulls. Is this the much hoped-for Santa Claus rally?
2. ETFs in the Spotlight
In case you missed the announcement and description of this section, you can read it here again.
It features some of the 10 broadly diversified domestic and sector ETFs from my HighVolume list as posted every Saturday. Furthermore, they are screened for the lowest MaxDD% number meaning they have been showing better resistance to temporary sell offs than all others over the past year.
The below table simply demonstrates the magnitude with which these ETFs are fluctuating above or below their respective individual trend lines (%+/-M/A). A break below, represented by a negative number, shows weakness, while a break above, represented by a positive percentage, shows strength.
For hundreds of ETF choices, be sure to reference Thursday’s StatSheet.
For this current domestic “Buy” cycle, here’s how some our candidates have fared:
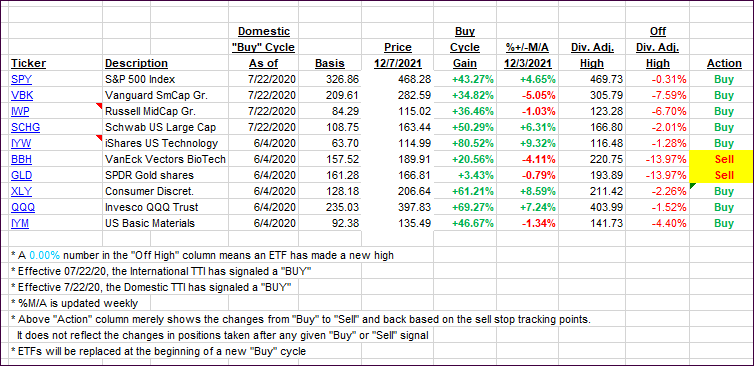
Click image to enlarge.
Again, the %+/-M/A column above shows the position of the various ETFs in relation to their respective long-term trend lines, while the trailing sell stops are being tracked in the “Off High” column. The “Action” column will signal a “Sell” once the -8% point has been taken out in the “Off High” column. For more volatile sector ETFs, the trigger point is -10%.
3. Trend Tracking Indexes (TTIs)
Our TTIs rocketed higher with the International one climbing back above its trend line and into bullish territory.
This is how we closed 12/07/2021:
Domestic TTI: +5.34% above its M/A (prior close +3.59%)—Buy signal effective 07/22/2020.
International TTI: +1.25% above its M/A (prior close -0.30%)—Buy signal effective 07/22/2020.
Disclosure: I am obliged to inform you that I, as well as my advisory clients, own some of the ETFs listed in the above table. Furthermore, they do not represent a specific investment recommendation for you, they merely show which ETFs from the universe I track are falling within the specified guidelines.
All linked charts above are courtesy of Bloomberg via ZeroHedge.
Contact Ulli