
- Moving the markets
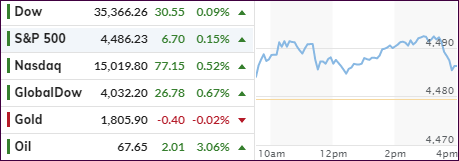
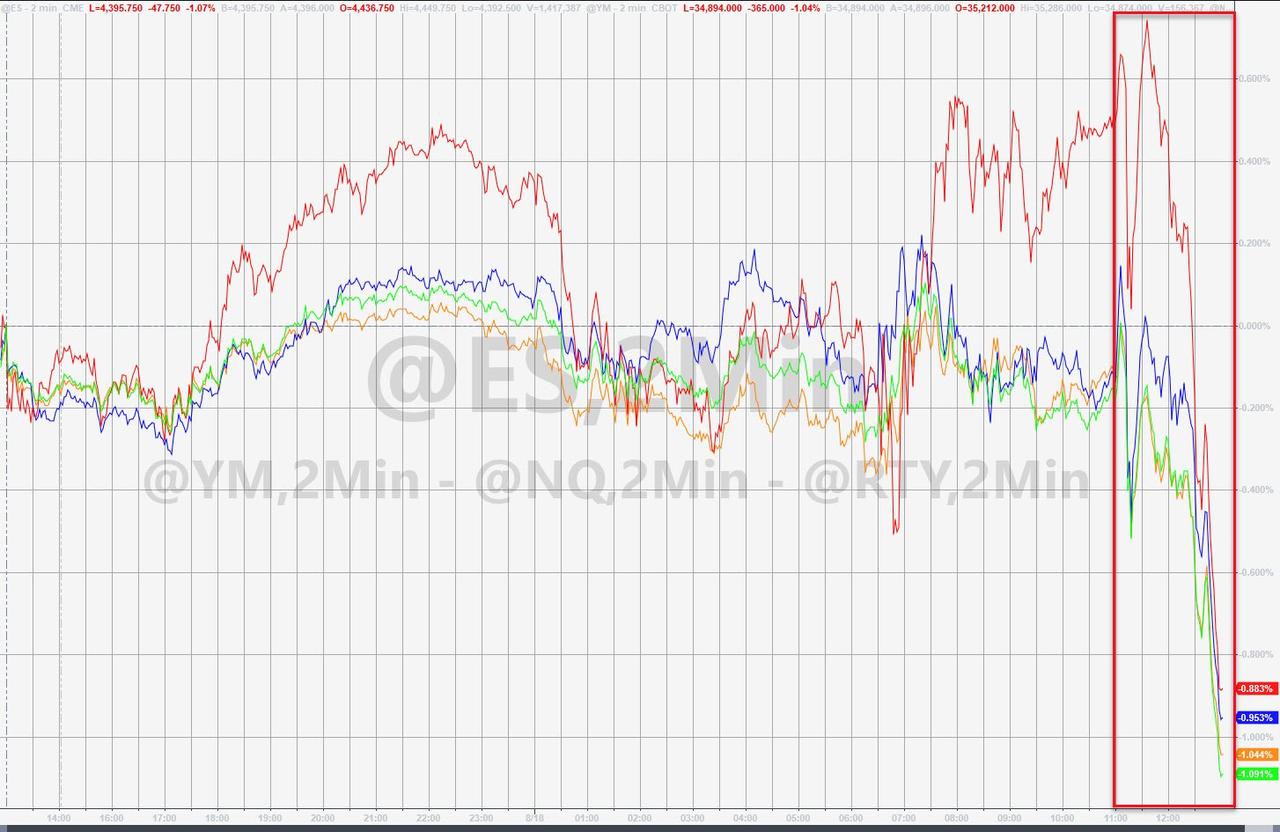
After yesterday’s ramp, you could have expected some sort of pullback in the markets, but the rally continued unabated with some sell off into close, however, green numbers prevailed. Leading the charge was the Nasdaq with a gain of +0.52%.
Helping the major indexes to maintain upward momentum was news that US regulators granted full approval for the Pfizer vaccine, causing traders to presume that the latest Covid flare up has peaked.
Overall, it was a fairly quiet day with the focus being on the upcoming Jackson Hole symposium later this week. Again, the open-ended question is whether the bankers will disclose more details about their intended plans to taper stimulus—or not.
The summit will be on a virtual basis and held on Thursday with Fed head Powell giving a speech on Friday. Opined one analyst: “It will probably be a slow taper with no commitments over interest hikes.”
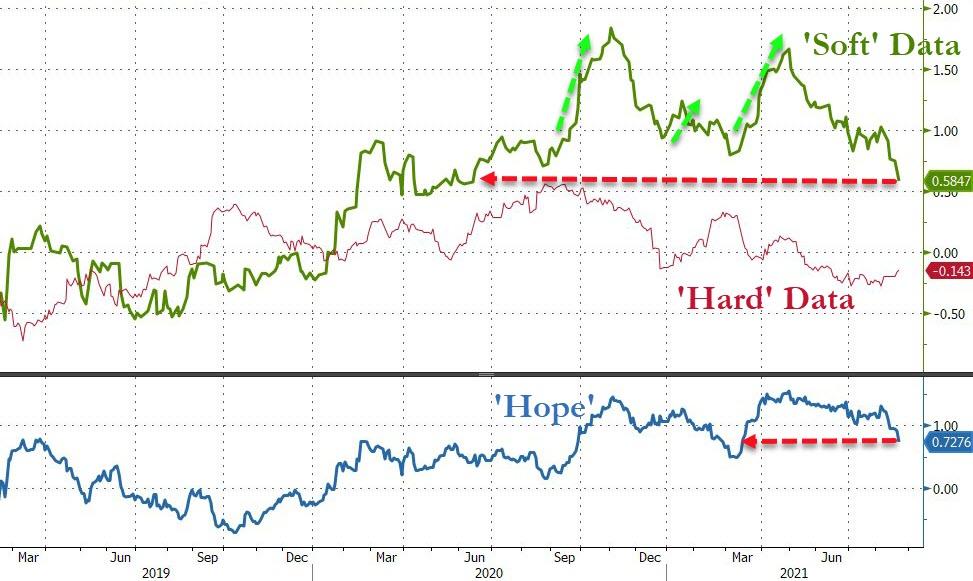
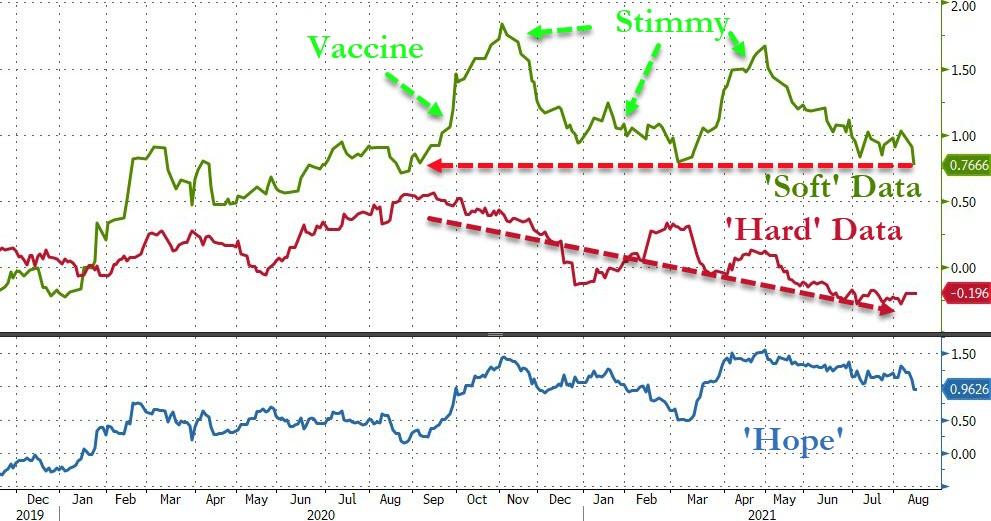
Business Sentiment soured, confirming the recent trend of “soft” survey data dumping back to the reality of “hard” data, as Zero Hedge saw it, with Bloomberg graphing the trend here.
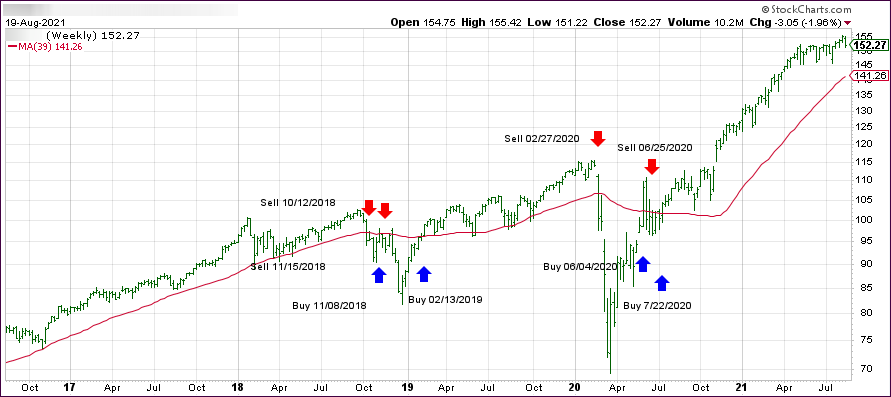
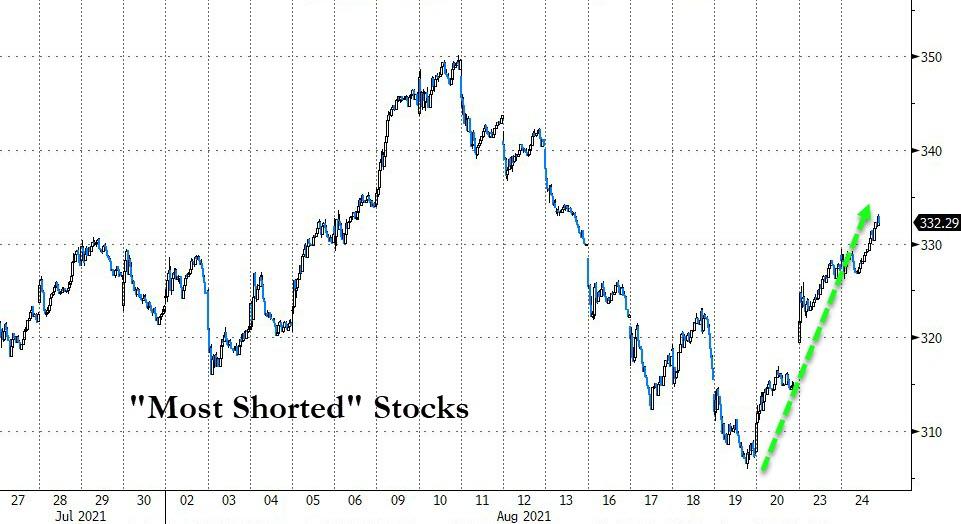
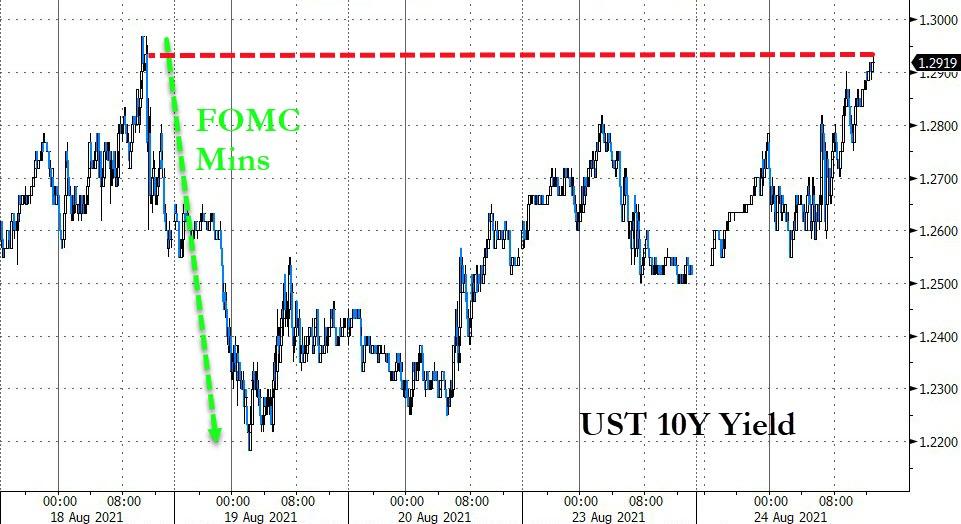
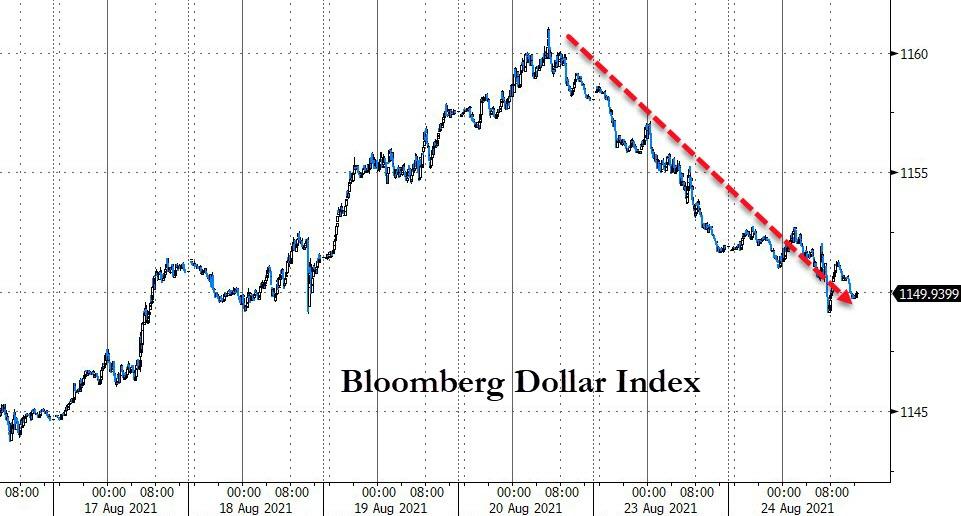
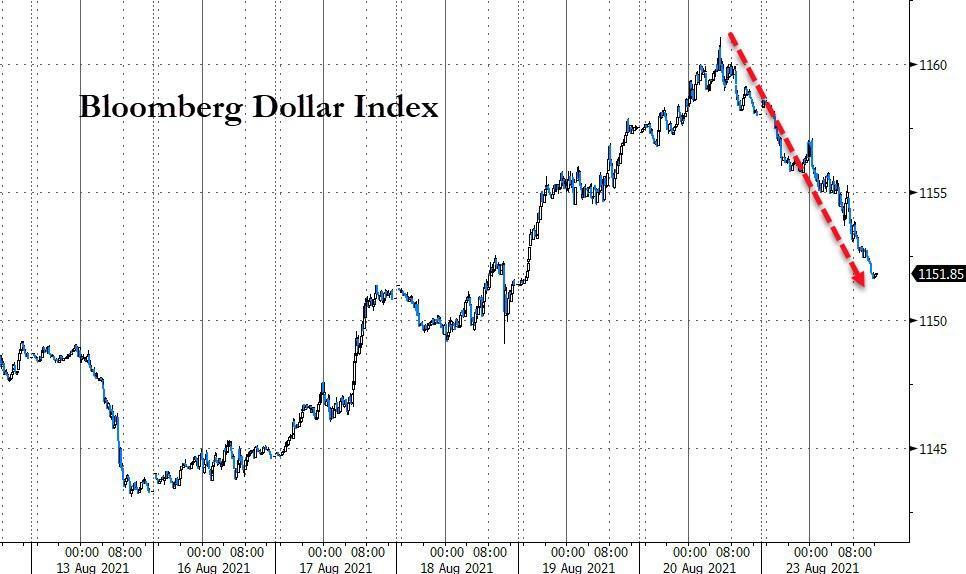
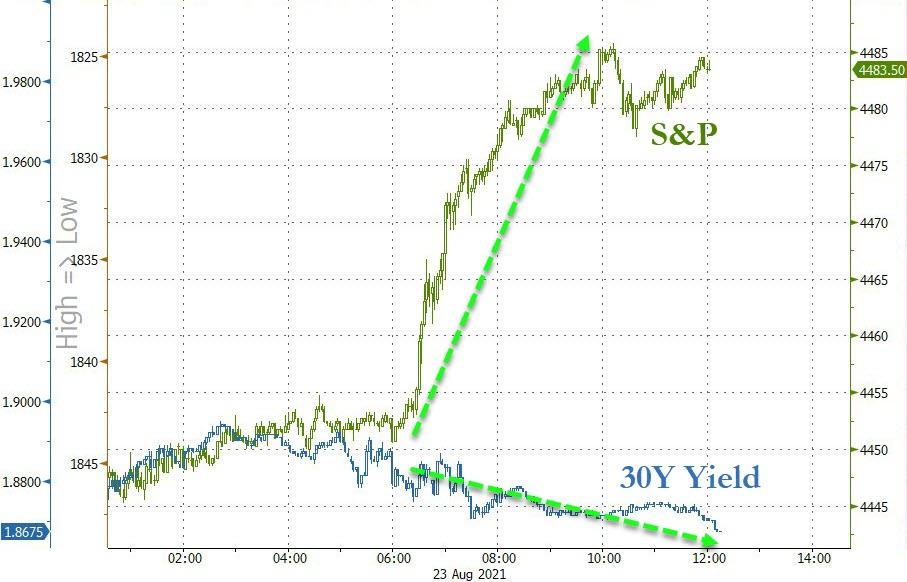
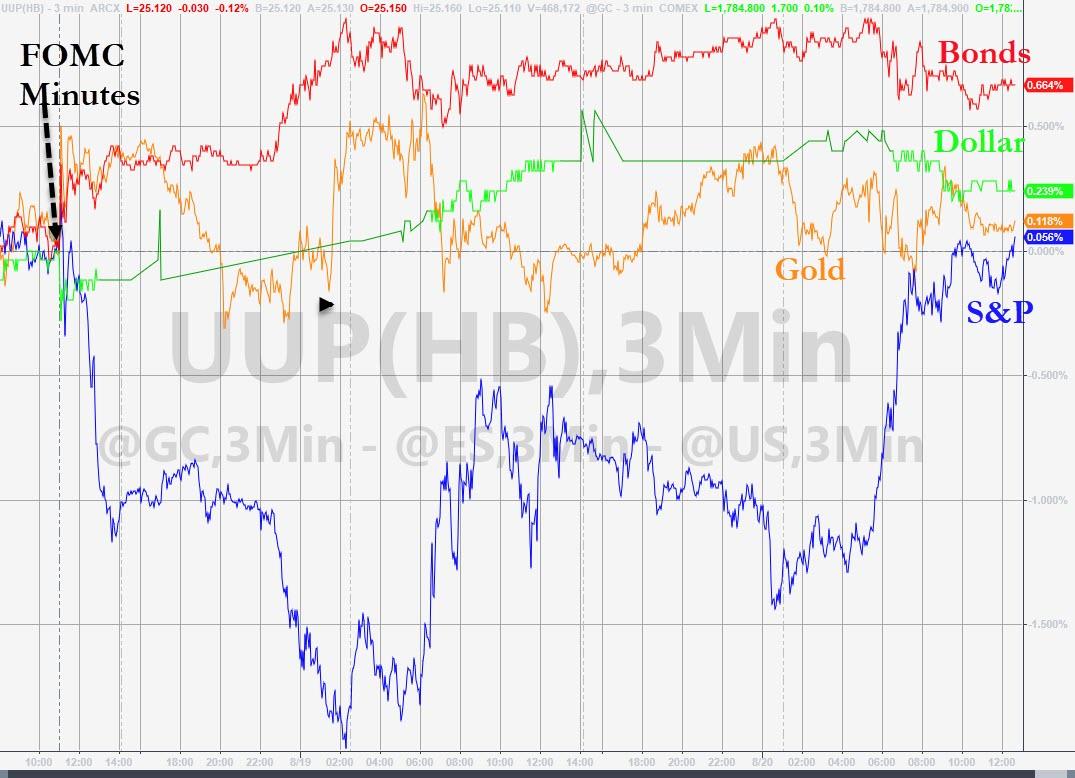
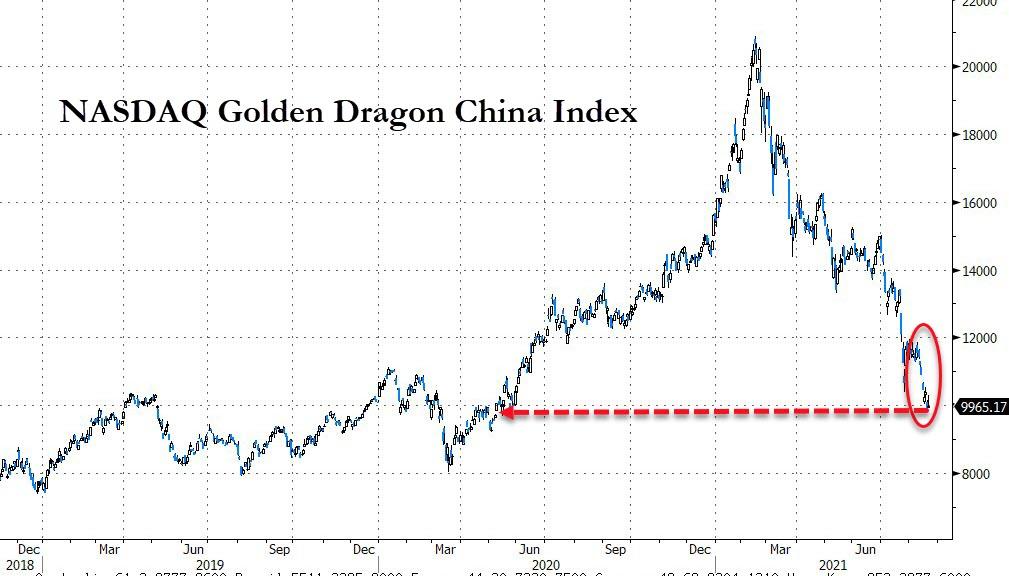
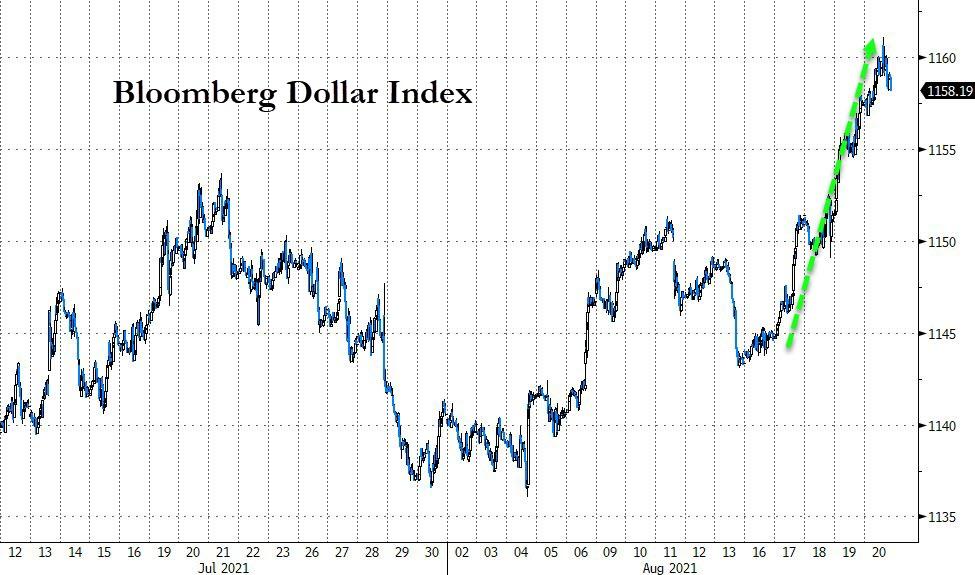
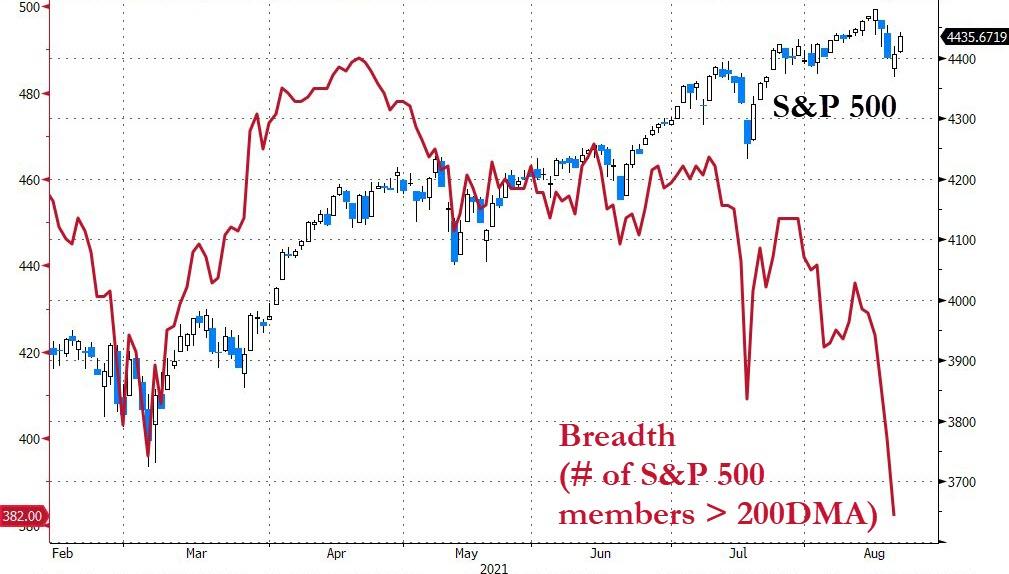
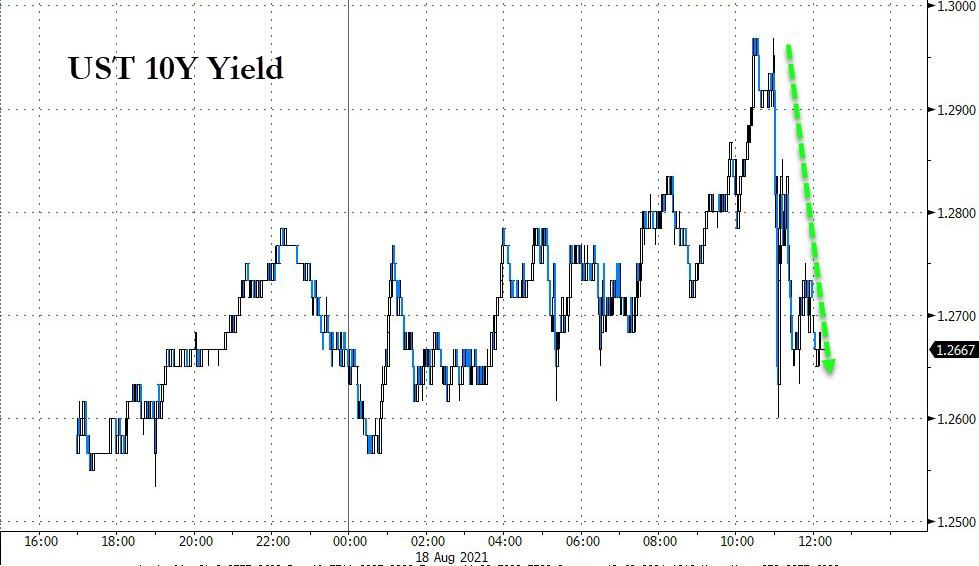
The short squeeze of the past few days persisted with the index now having bounced off the bottom by some 9%. The 10-year bond yield headed north hitting overhead resistance, while the US Dollar accelerated its southerly path of the past two days.
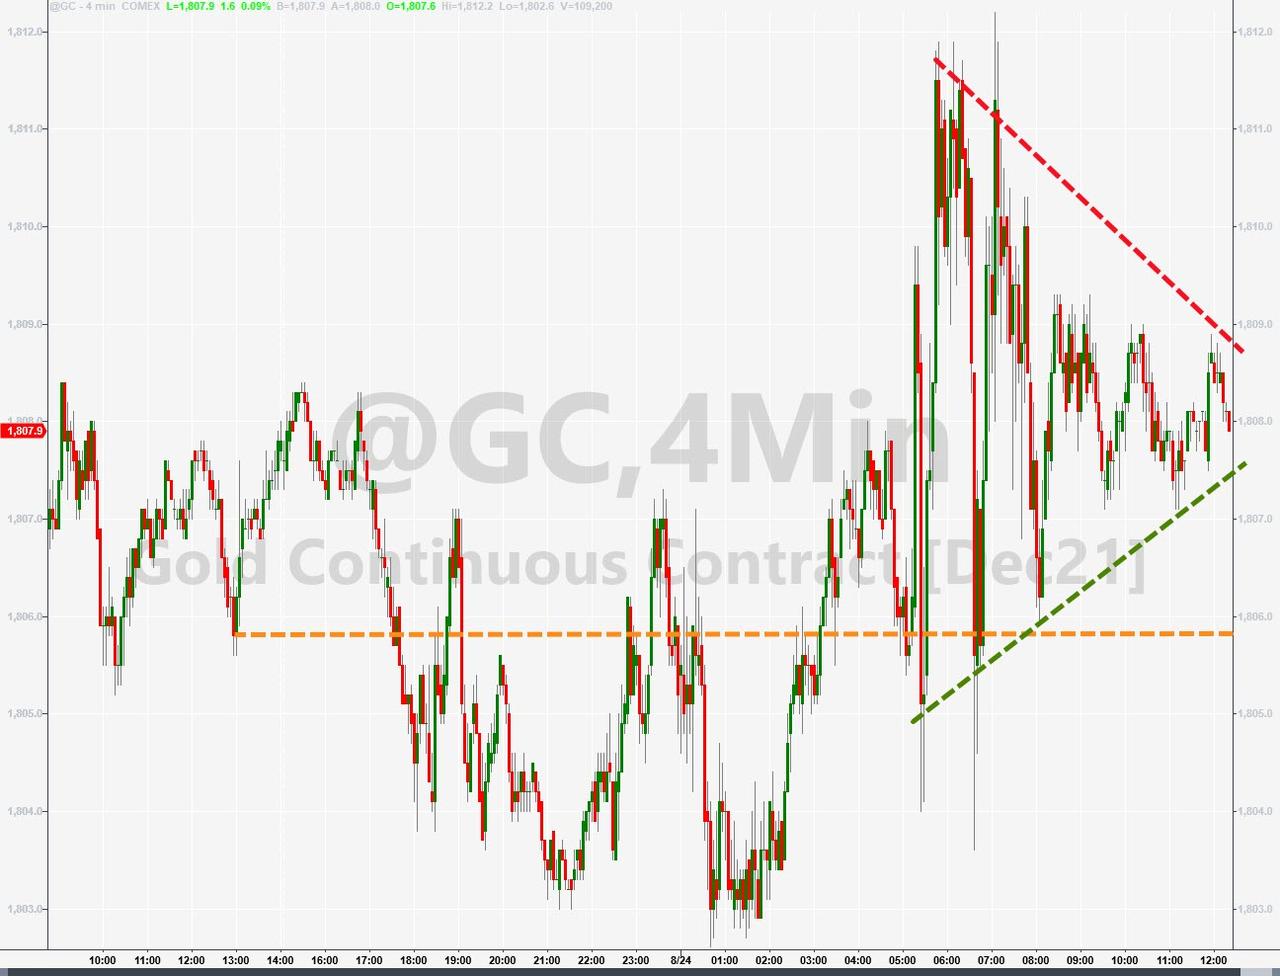
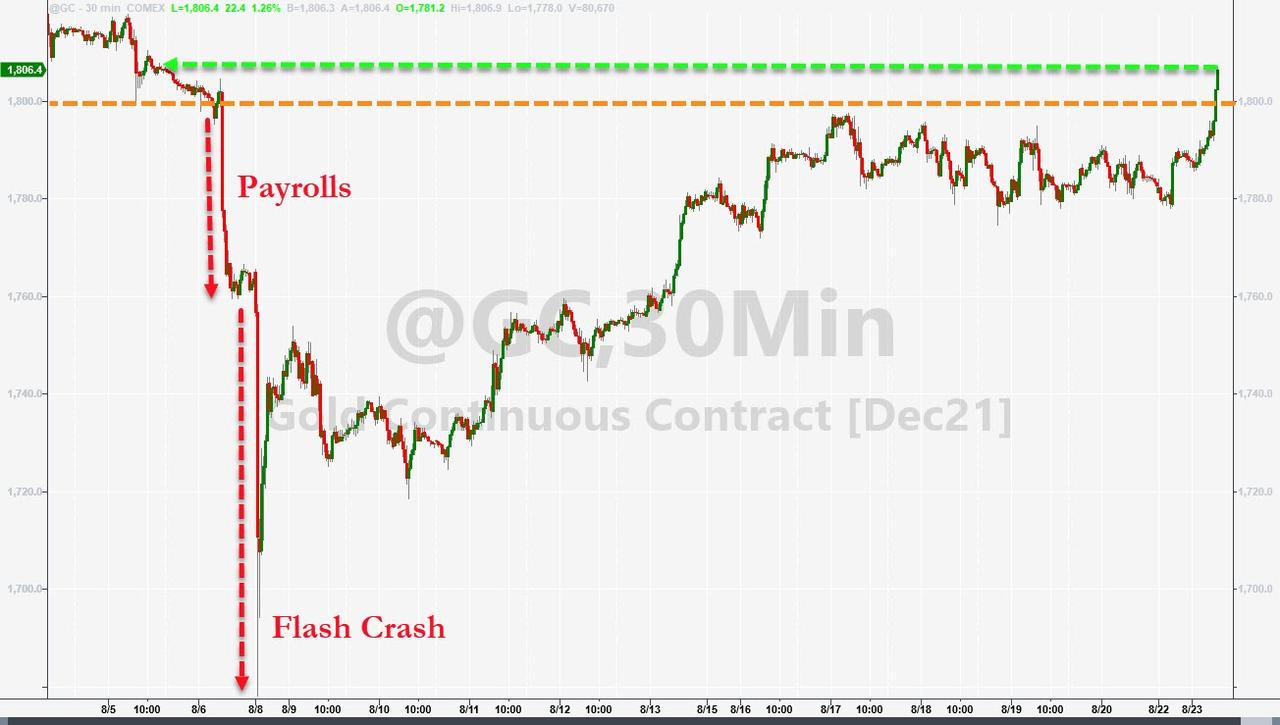
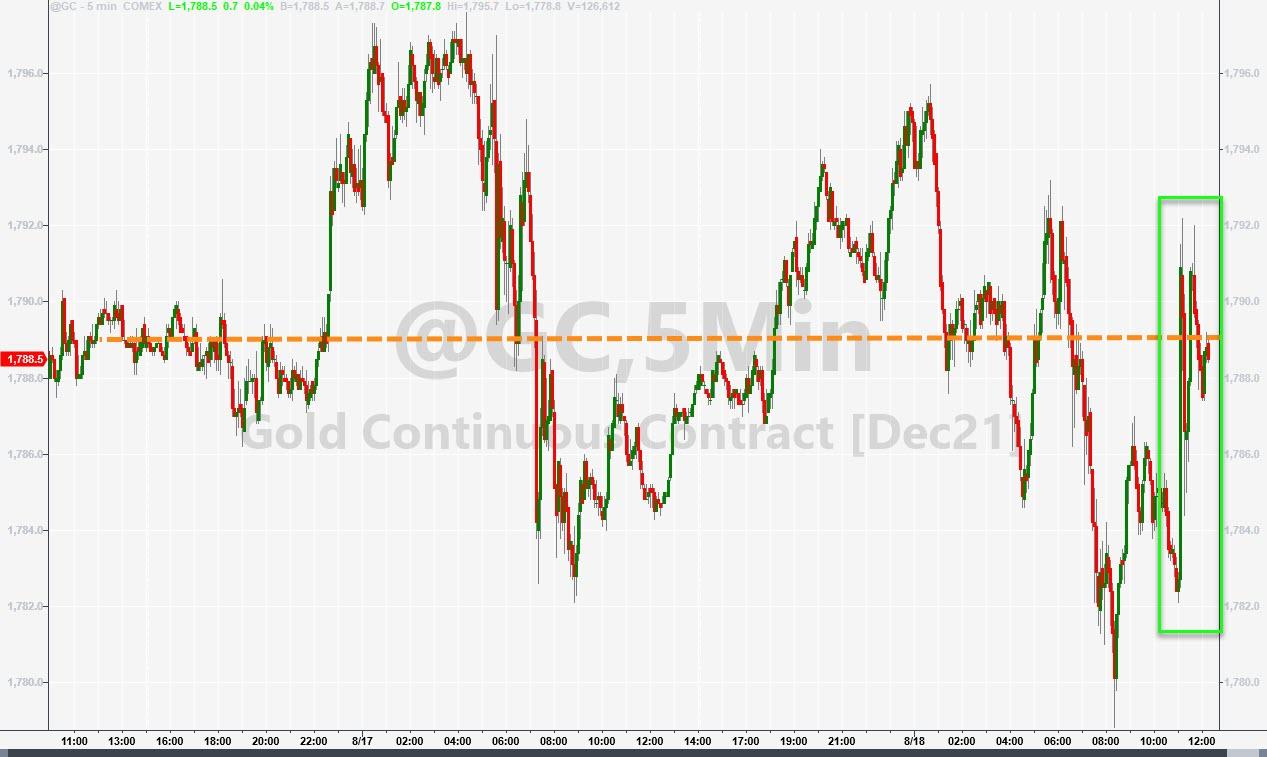
The leap in yields neutralized gold, which bounced around its unchanged line and ended the session down a tad, but its chart pattern indicates that a breakout, either up or down, will be a distinct possibility in the near future.
Read More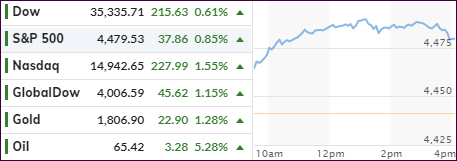

