
- Moving the markets
On deck today were the Fed minutes from the July meeting, which disclosed what everyone already knew, namely that discussions about a possible reduction of its monthly $120 billion bond buying program had already happened.
Here’s what the minutes said:
Looking ahead, most participants noted that, provided that the economy were to evolve broadly as they anticipated, they judged that it could be appropriate to start reducing the pace of asset purchases this year.
The economy has reached its inflation goal and was “close to being satisfied” with the progress of job growth.
The timing of the tapering had been a hot topic ever since the Fed’s July get together, with participants expressing support of announcing such a move in September with an effective date of October.
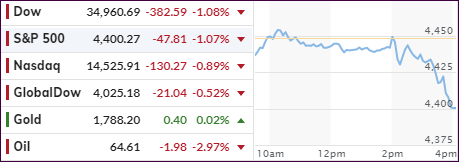
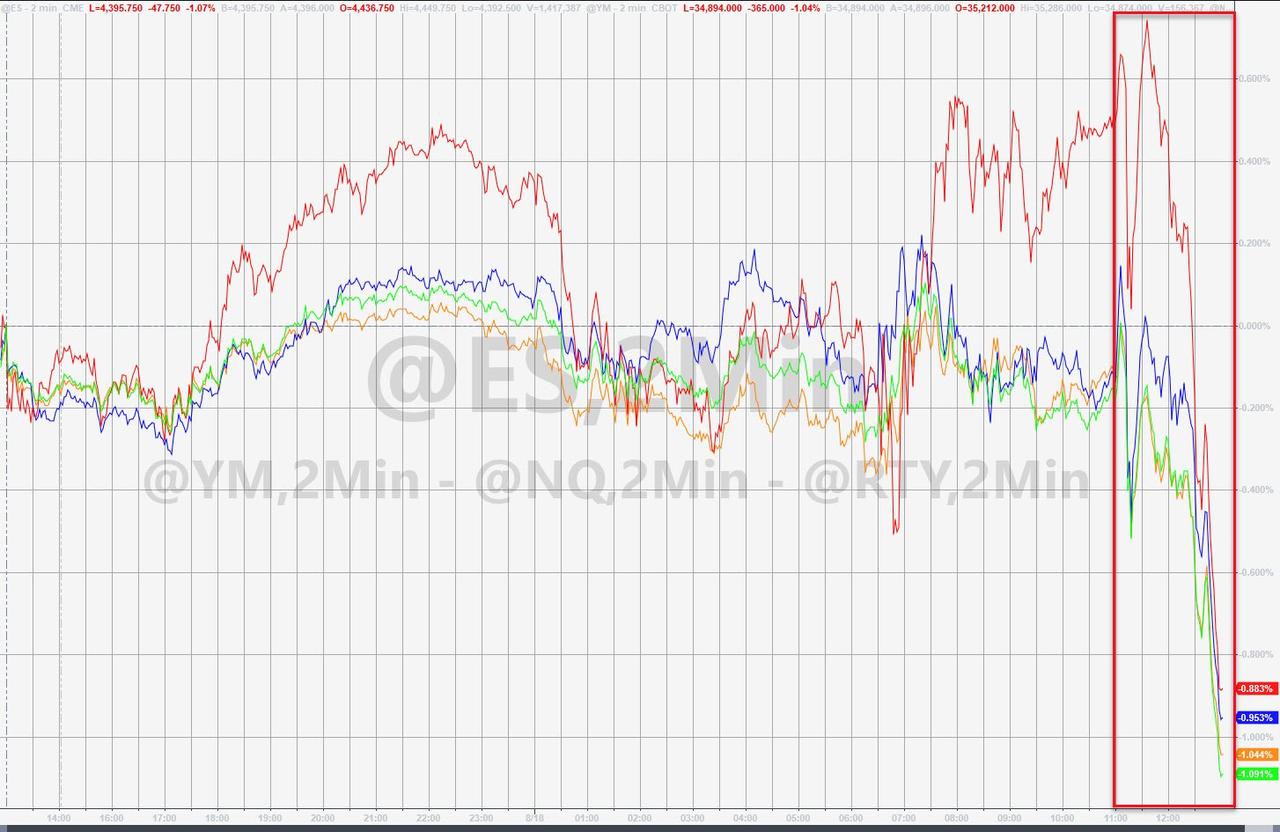
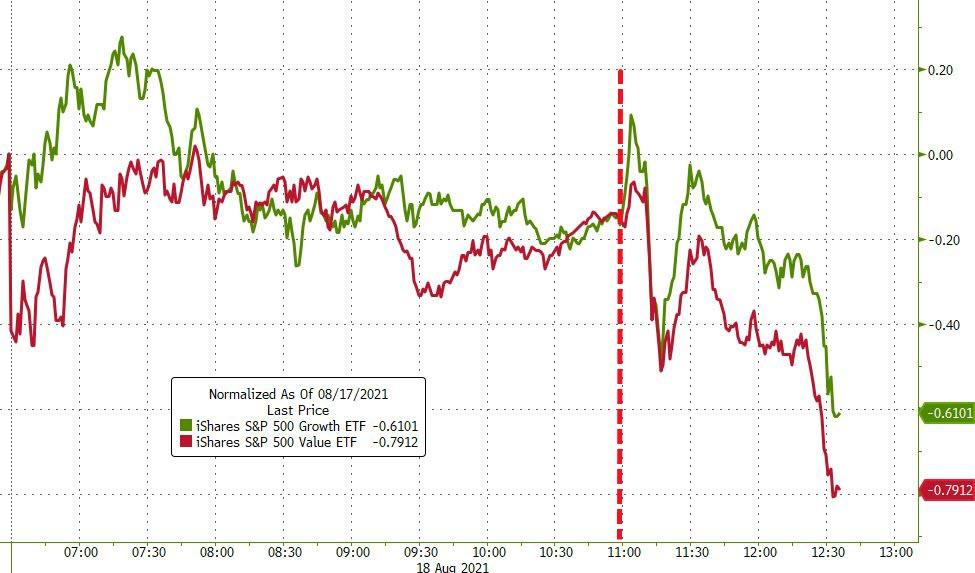
Now that the cat has been let out of the bag, traders, and computer algos alike are left to figure out how this “tightening” could maintain the bullish meme. At least for today, the reaction was negative and, while the major indexes originally maintained a neutral sideways pattern, in the end, they dumped into the close. “Value” and “Growth” followed the same premise.
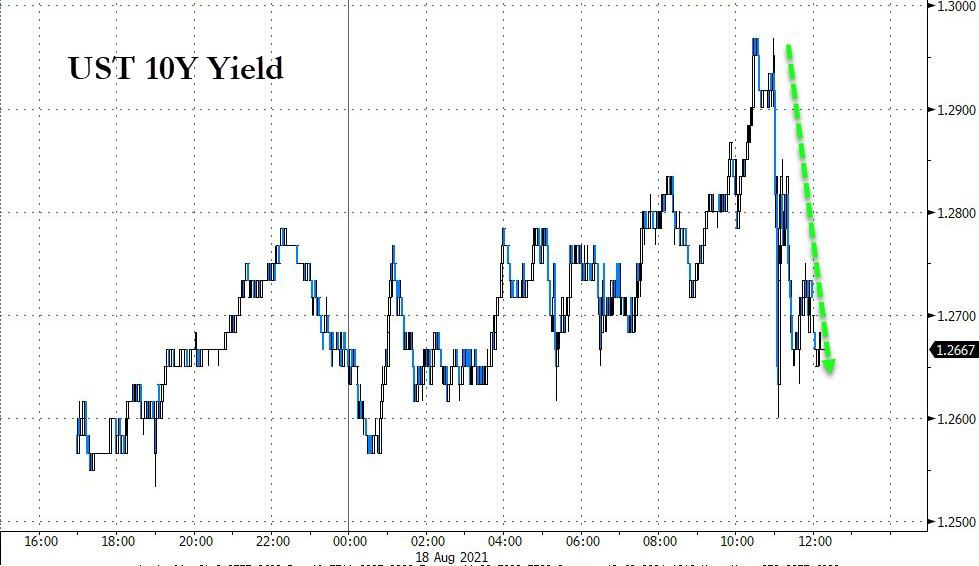
Bond yields rose for most of the session with the 10-year approaching its 1.30% level, but sold off into the close ending the day just about unchanged.
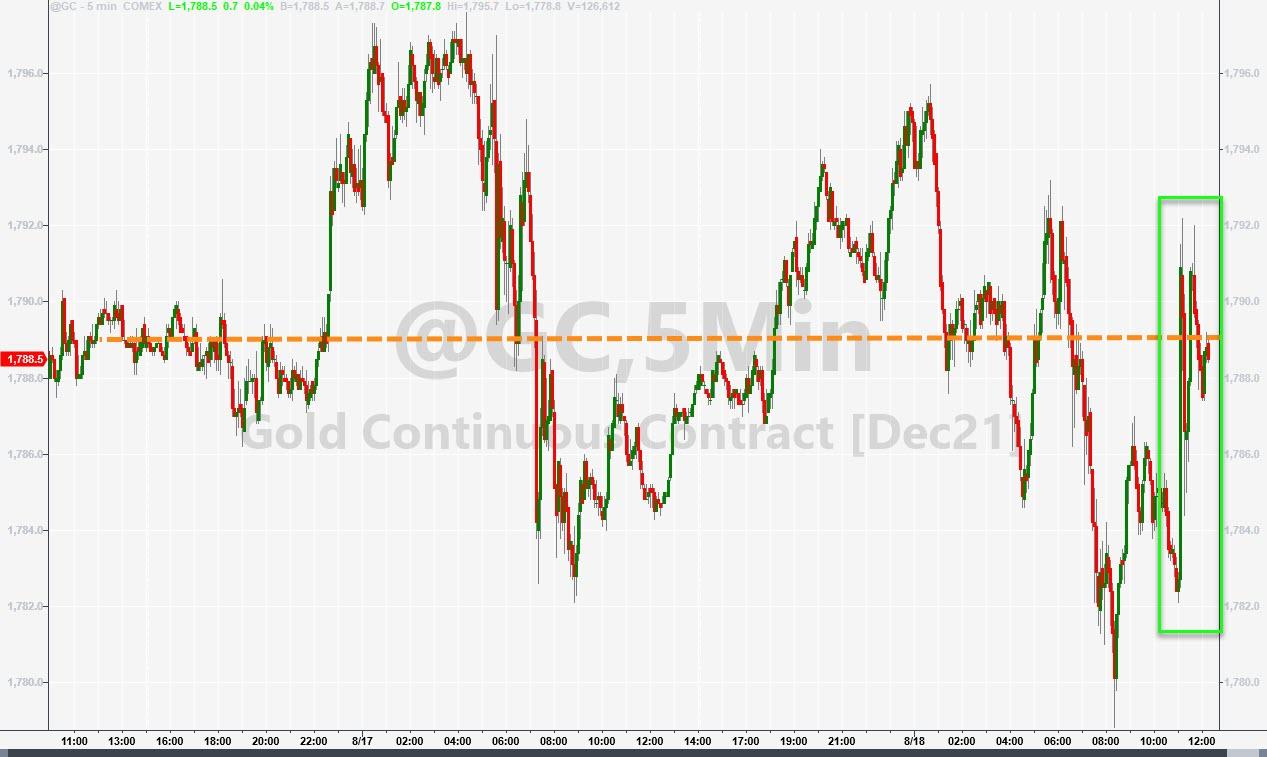
The US Dollar index ripped early on and then dipped, recovered and closed slightly in the green. Gold had its own roller coaster ride and ended the session right at the unchanged line.
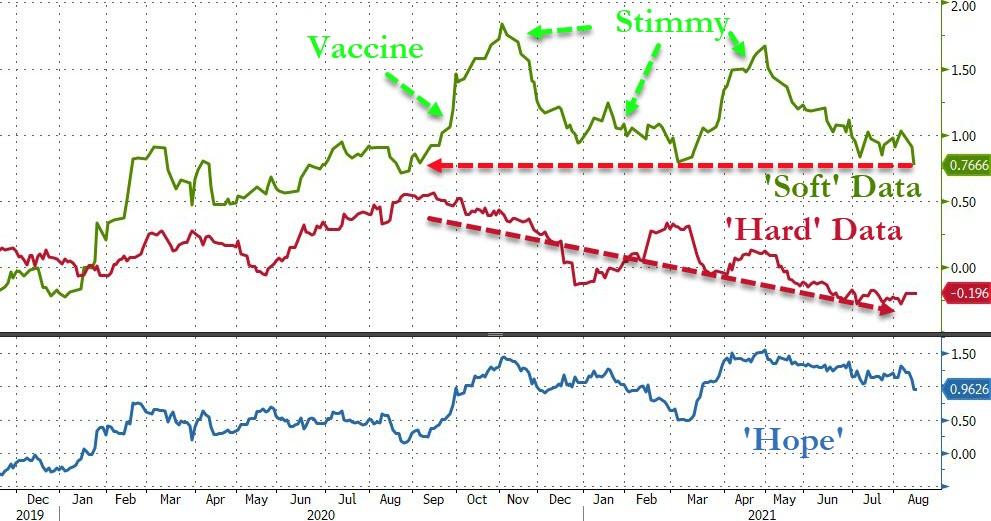
I see the economy slowing down, which is clearly demonstrated in this chart by Bloomberg, a possibility that is not yet acknowledged in the equity markets.
2. ETFs in the Spotlight
In case you missed the announcement and description of this section, you can read it here again.
It features some of the 10 broadly diversified domestic and sector ETFs from my HighVolume list as posted every Saturday. Furthermore, they are screened for the lowest MaxDD% number meaning they have been showing better resistance to temporary sell offs than all others over the past year.
The below table simply demonstrates the magnitude with which these ETFs are fluctuating above or below their respective individual trend lines (%+/-M/A). A break below, represented by a negative number, shows weakness, while a break above, represented by a positive percentage, shows strength.
For hundreds of ETF choices, be sure to reference Thursday’s StatSheet.
For this current domestic “Buy” cycle, here’s how some our candidates have fared:
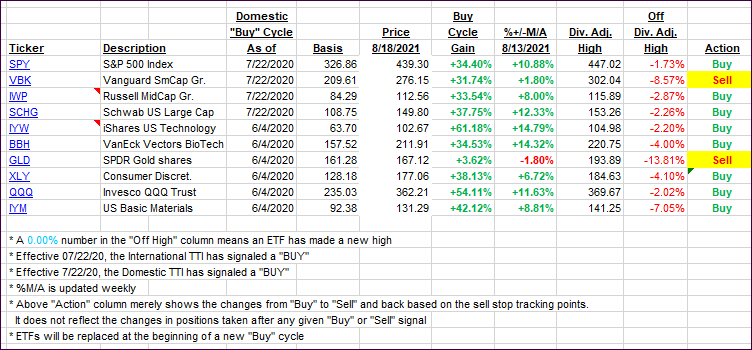
Click image to enlarge.
Again, the %+/-M/A column above shows the position of the various ETFs in relation to their respective long-term trend lines, while the trailing sell stops are being tracked in the “Off High” column. The “Action” column will signal a “Sell” once the -8% point has been taken out in the “Off High” column. For more volatile sector ETFs, the trigger point is -10%.
3. Trend Tracking Indexes (TTIs)
Our TTIs pulled back for the second day in a row as the bears manhandled the bulls.
This is how we closed 08/18/2021:
Domestic TTI: +8.68% above its M/A (prior close +9.81%)—Buy signal effective 07/22/2020.
International TTI: +5.93% above its M/A (prior close +6.47%)—Buy signals effective 07/22/2020.
Disclosure: I am obliged to inform you that I, as well as my advisory clients, own some of the ETFs listed in the above table. Furthermore, they do not represent a specific investment recommendation for you, they merely show which ETFs from the universe I track are falling within the specified guidelines.
All linked charts above are courtesy of Bloomberg via ZeroHedge.
Contact Ulli