
- Moving the markets
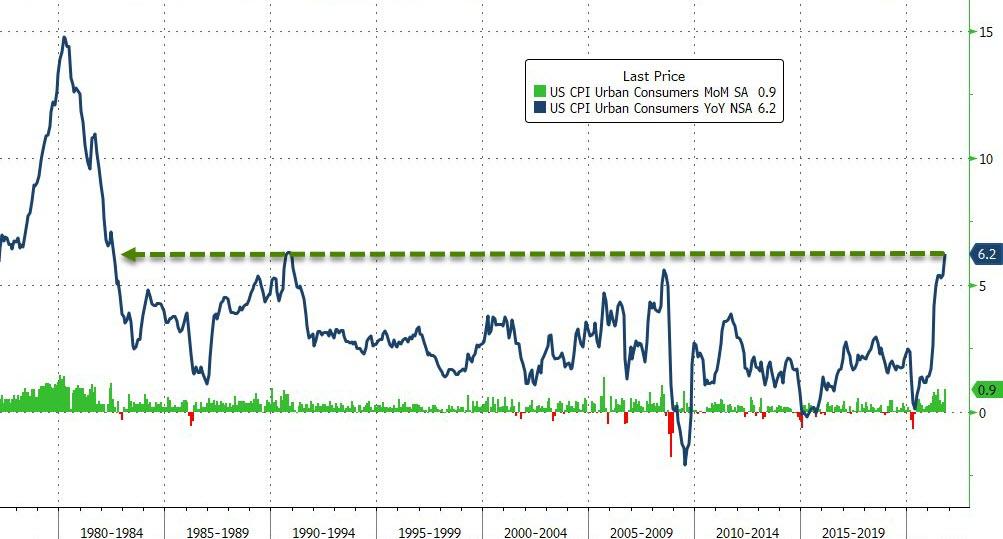
Following yesterday’s eye-popping Producer Price report, it came as no surprise to me that today’s soaring CPI release confirmed what I have been pouncing on all year, namely that inflation is here is to say and likely will get worse.
US Consumer prices soared at their fastest rate in 40 years, as ZH reported, by increasing 6.2% YoY in October, thereby blowing by expectations of 5.9% YoY and accelerating from September’s 5.4% YoY. The Core CPI spiked to its highest since August 1991, which confirms another non-transitory surge in inflation.
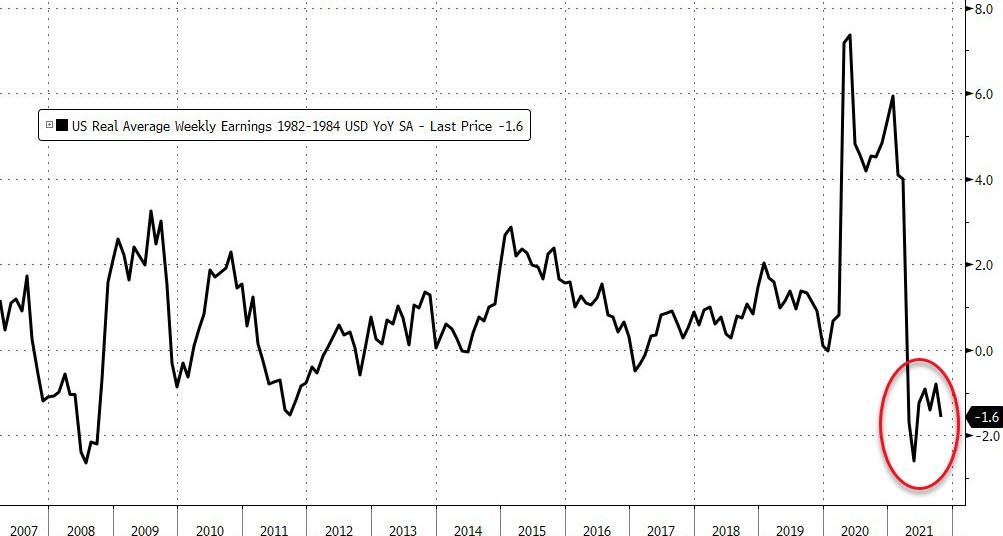
Added ZeroHedge:
Real weekly earnings are down 1.6% YoY.
The gap between PPI and CPI continues to run at record highs, meaning either consumers are about to be crushed or margins are going to collapse.
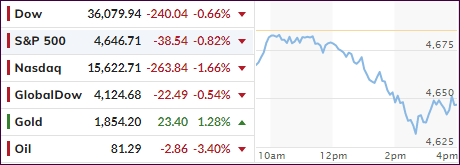
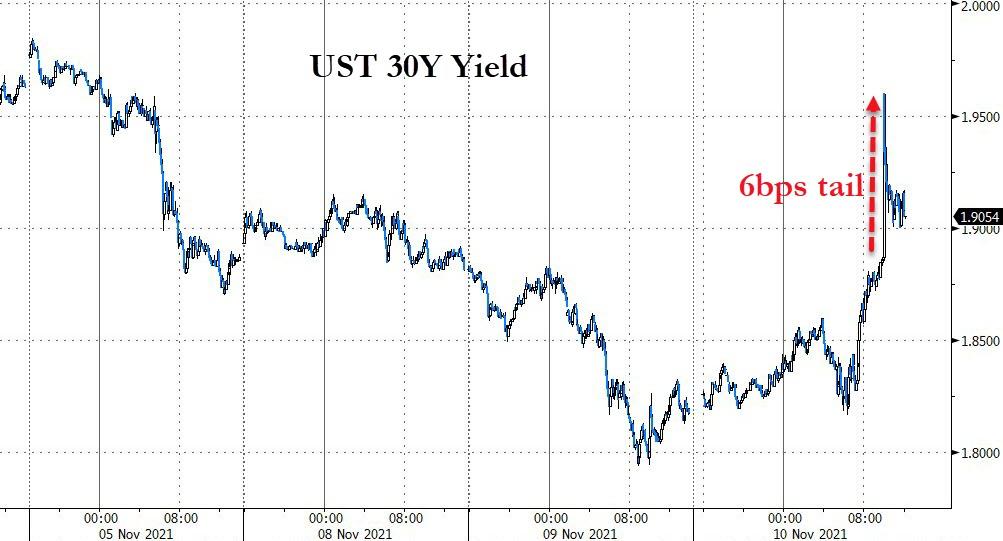
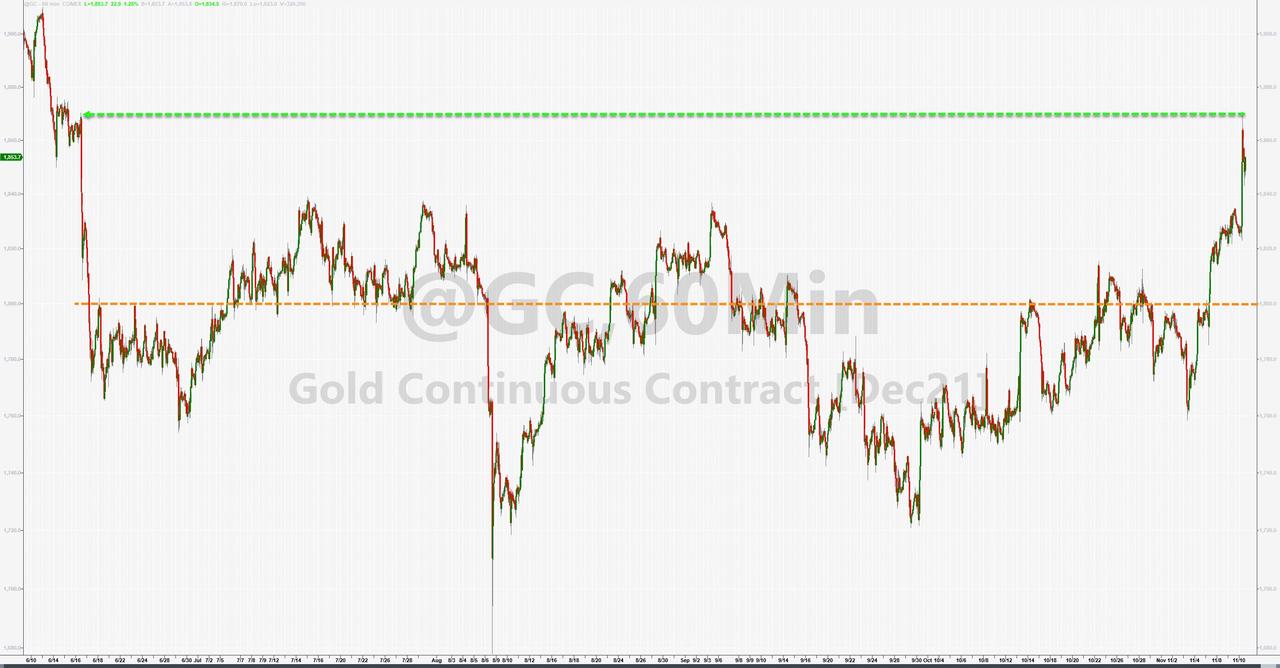
As a result, the markets retreated from their lofty levels, assisted by a spike in bond yields, with the 10-year exploding almost 12 basis points higher to end the session at 1.563%. Traders dumped the high-flying tech sector and rotated into bank stocks and gold, the latter of which closed at 5-month highs.
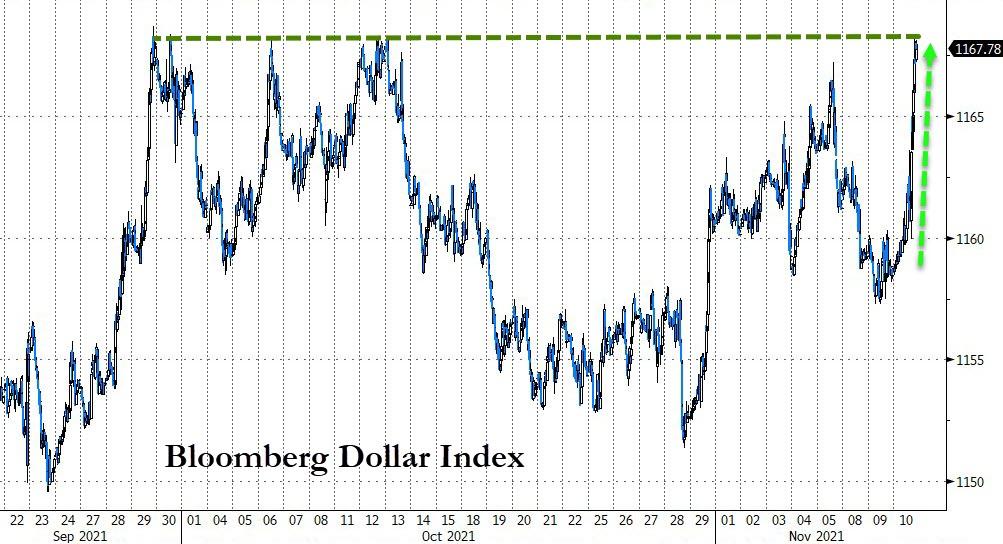
The precious metal surged and gained 1.27% on the day and is now moving towards the $1,900 level, while the US Dollar rallied almost 1%. It was crunch time on Wall Street, as neither spiking bond yields nor a rising dollar were able to prevent gold from levitating.
The “clueless comment of the day” award goes to MSNBC, who lectures us as to why the inflation we are seeing is a good thing, as this picture tries to explain.
Go figure…
2. ETFs in the Spotlight
In case you missed the announcement and description of this section, you can read it here again.
It features some of the 10 broadly diversified domestic and sector ETFs from my HighVolume list as posted every Saturday. Furthermore, they are screened for the lowest MaxDD% number meaning they have been showing better resistance to temporary sell offs than all others over the past year.
The below table simply demonstrates the magnitude with which these ETFs are fluctuating above or below their respective individual trend lines (%+/-M/A). A break below, represented by a negative number, shows weakness, while a break above, represented by a positive percentage, shows strength.
For hundreds of ETF choices, be sure to reference Thursday’s StatSheet.
For this current domestic “Buy” cycle, here’s how some our candidates have fared:
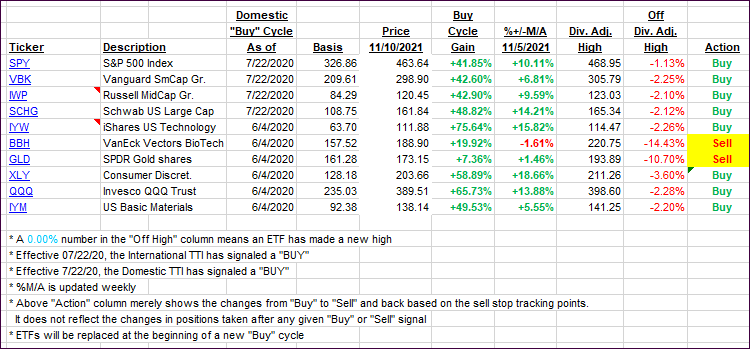
Click image to enlarge.
Again, the %+/-M/A column above shows the position of the various ETFs in relation to their respective long-term trend lines, while the trailing sell stops are being tracked in the “Off High” column. The “Action” column will signal a “Sell” once the -8% point has been taken out in the “Off High” column. For more volatile sector ETFs, the trigger point is -10%.
3. Trend Tracking Indexes (TTIs)
Our TTIs pulled back as a worse-than-expected CPI reading manhandled the markets.
This is how we closed 11/10/2021:
Domestic TTI: +7.78% above its M/A (prior close +8.47%)—Buy signal effective 07/22/2020.
International TTI: +3.90% above its M/A (prior close +4.50%)—Buy signal effective 07/22/2020.
Disclosure: I am obliged to inform you that I, as well as my advisory clients, own some of the ETFs listed in the above table. Furthermore, they do not represent a specific investment recommendation for you, they merely show which ETFs from the universe I track are falling within the specified guidelines.
All linked charts above are courtesy of Bloomberg via ZeroHedge.
Contact Ulli