
- Moving the markets
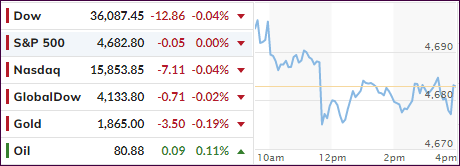
One look at the chart above tells the entire story, namely that the markets were aimlessly wandering, as bond yields reversed and spiked, which kept any bullish meme in check. On deck, and awaited with some anxiety, are the quarterly reports from the big box retailers due out later this week.
Inflation remains the elephant in the room and will affect bond prices negatively (higher yields), as various data points and more Fed speak scheduled throughout the week, may push interest rates around, despite the Central Bank’s announcement of their policy going forward.
It’s almost amusing to watch Tesla trade like a penny stock. Down 20% off its highs today, then a sudden mysterious buying ramp, exactly like last week, pushed the stock back up, as ZeroHedge elaborated.
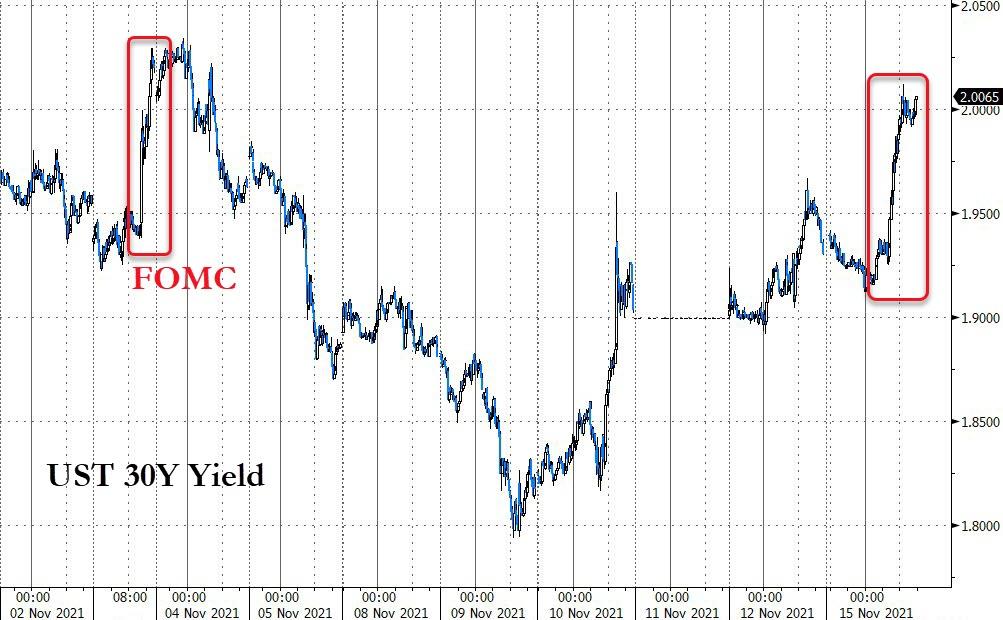
Back to bond yields. The 30-year spiked above the 2% level but stayed below its recent high. Not to be outdone, the US dollar followed suit and gained 0.45% for the session.
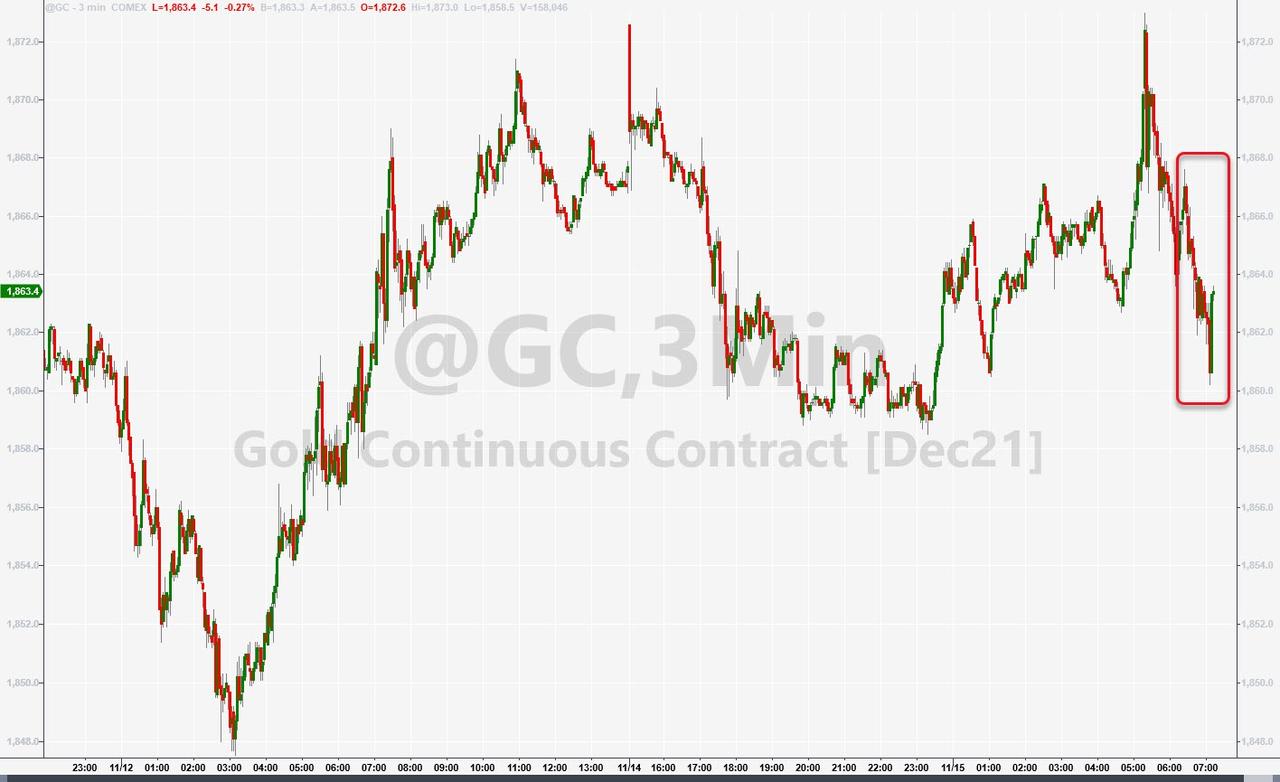
Rising yields and a rallying dollar are the recipe for lower gold prices, and that’s what happened today. However, gold’s retreatment of 0.20% was minor and did not disturb its current bullish rebound.
In the end, it was a session during which the major indexes did nothing but tread water.
2. ETFs in the Spotlight
In case you missed the announcement and description of this section, you can read it here again.
It features some of the 10 broadly diversified domestic and sector ETFs from my HighVolume list as posted every Saturday. Furthermore, they are screened for the lowest MaxDD% number meaning they have been showing better resistance to temporary sell offs than all others over the past year.
The below table simply demonstrates the magnitude with which these ETFs are fluctuating above or below their respective individual trend lines (%+/-M/A). A break below, represented by a negative number, shows weakness, while a break above, represented by a positive percentage, shows strength.
For hundreds of ETF choices, be sure to reference Thursday’s StatSheet.
For this current domestic “Buy” cycle, here’s how some our candidates have fared:
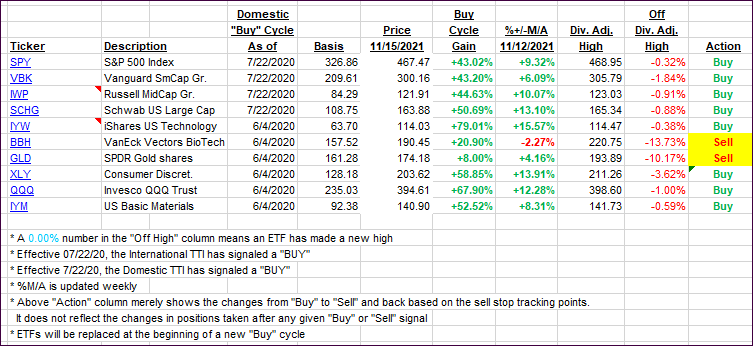
Click image to enlarge.
Again, the %+/-M/A column above shows the position of the various ETFs in relation to their respective long-term trend lines, while the trailing sell stops are being tracked in the “Off High” column. The “Action” column will signal a “Sell” once the -8% point has been taken out in the “Off High” column. For more volatile sector ETFs, the trigger point is -10%.
3. Trend Tracking Indexes (TTIs)
Our TTIs were mixed and hardly moved from Friday’s position.
This is how we closed 11/15/2021:
Domestic TTI: +8.23% above its M/A (prior close +8.05%)—Buy signal effective 07/22/2020.
International TTI: +3.83% above its M/A (prior close +3.86%)—Buy signal effective 07/22/2020.
Disclosure: I am obliged to inform you that I, as well as my advisory clients, own some of the ETFs listed in the above table. Furthermore, they do not represent a specific investment recommendation for you, they merely show which ETFs from the universe I track are falling within the specified guidelines.
All linked charts above are courtesy of Bloomberg via ZeroHedge.
Contact Ulli