
ETF Tracker StatSheet
You can view the latest version here.
FIRST DOWN WEEK IN SIX
- Moving the markets
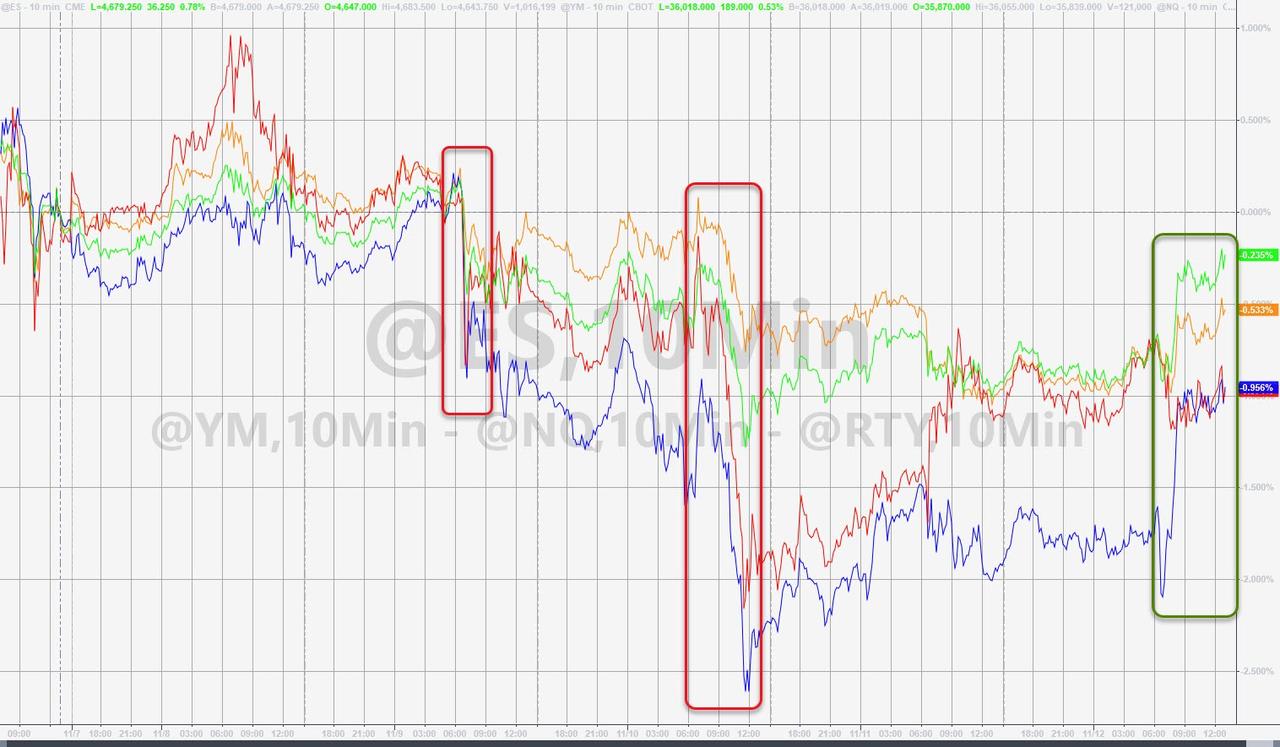
After weakness in the markets, we saw a rebound attempt yesterday, which faded into the close, but had the Nasdaq come out ahead with a 0.52% gain. This positive theme travelled through the futures market and creature a bullish opening this morning.
A little sideways bobbing and weaving set up the bullish levitation early in the day but, despite all efforts of, the major indexes closed the week down but finished this Friday on an up note.
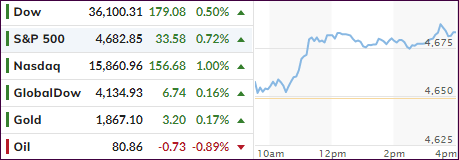
All three major indexes posted solid gains, but the Nasdaq with an 1% advance was again the king of the hill. Still, the “hot” inflation numbers of the PPI and CPI continue to weigh on traders’ minds. However, they but now appear to be an accepted fact with the bullish theme remaining the dominant force in the face of questionable economic data.
As ZeroHedge reported, a record number of Americans just quit their jobs, as job openings surpassed unemployed workers by a record 2.8 million:
The number of quits, which for the second month in a row soared to an all-time high, jumping in September by 164K to a record 4.434 million.
As a reminder, this “take this job and shove it” indicator is generally seen as a real-time proxy of how marketable employees think they are, as they tend to quit jobs and look for higher paying occupations when the job market is red hot. And since it tends to lag peaks in job openings modestly, the surge in quits was probably not all that surprising.
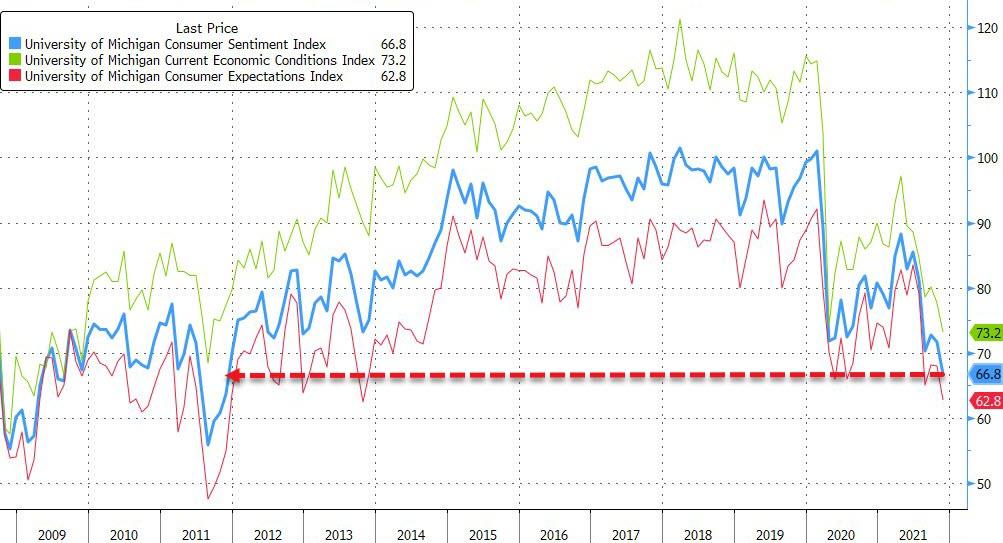
We also learned that the Consumer Sentiment survey collapsed to 11-year lows due a surge in inflationary expectations. This is another nail in the coffin of the ridiculous narrative that inflation is “transitory” in nature.
After being closed yesterday for Veteran’s Day, bond yields travelled above their unchanged line with the 10-year adding almost 2 basis points to 1.573%. The US Dollar meandered aimlessly and ended just about unchanged.
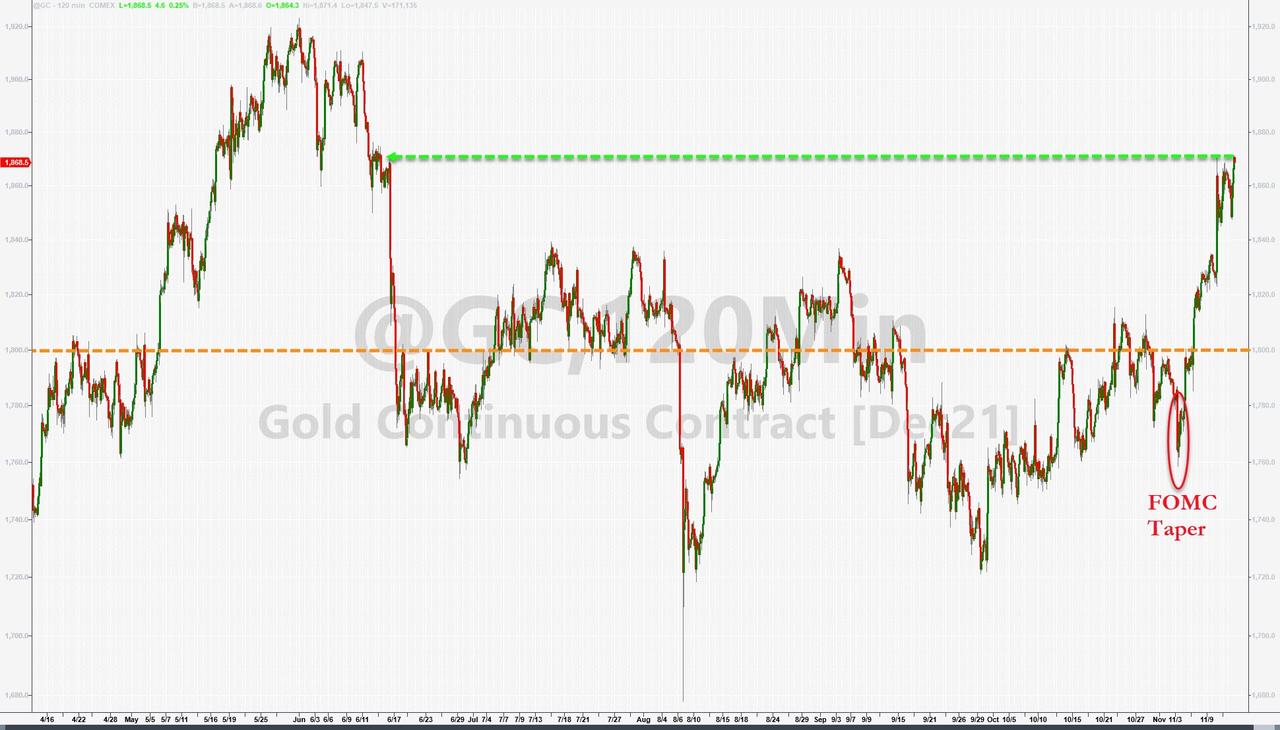
Gold jumped above $1,870 this week and had its best day since June, but its potential for more gains is supported by further strength in the CPI during the upcoming months. That is, until inflation expectations become more moderate due to higher interest rates, but this may take a while to materialize.
Why?
Because the Fed will avoid raising rates if it can, because any sudden hike in bond yields, either voluntary or forced by the marketplace, will have a bearish/crashing effect on equities. And we can’t have that, can we?
2. ETFs in the Spotlight
In case you missed the announcement and description of this section, you can read it here again.
It features some of the 10 broadly diversified domestic and sector ETFs from my HighVolume list as posted every Saturday. Furthermore, they are screened for the lowest MaxDD% number meaning they have been showing better resistance to temporary sell offs than all others over the past year.
The below table simply demonstrates the magnitude with which these ETFs are fluctuating above or below their respective individual trend lines (%+/-M/A). A break below, represented by a negative number, shows weakness, while a break above, represented by a positive percentage, shows strength.
For hundreds of ETF choices, be sure to reference Thursday’s StatSheet.
For this current domestic “Buy” cycle, here’s how some our candidates have fared:
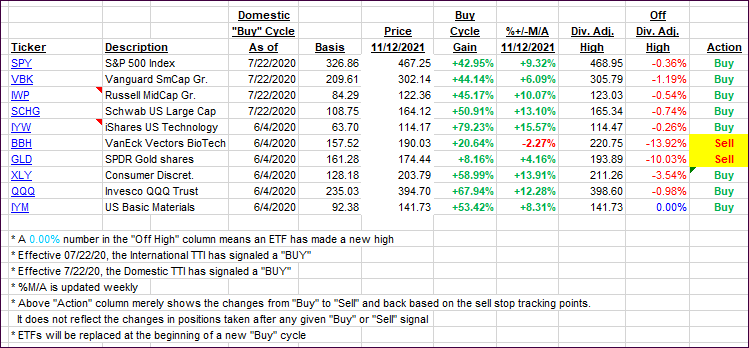
Click image to enlarge.
Again, the %+/-M/A column above shows the position of the various ETFs in relation to their respective long-term trend lines, while the trailing sell stops are being tracked in the “Off High” column. The “Action” column will signal a “Sell” once the -8% point has been taken out in the “Off High” column. For more volatile sector ETFs, the trigger point is -10%.
3. Trend Tracking Indexes (TTIs)
Our TTIs barely changed and remain solidly on the bullish side of their respective trend lines.
This is how we closed 11/12/2021:
Domestic TTI: +8.05% above its M/A (prior close +8.04%)—Buy signal effective 07/22/2020.
International TTI: +3.86% above its M/A (prior close +3.91%)—Buy signal effective 07/22/2020.
Disclosure: I am obliged to inform you that I, as well as my advisory clients, own some of the ETFs listed in the above table. Furthermore, they do not represent a specific investment recommendation for you, they merely show which ETFs from the universe I track are falling within the specified guidelines.
All linked charts above are courtesy of Bloomberg via ZeroHedge.
———————————————————-
WOULD YOU LIKE TO HAVE YOUR INVESTMENTS PROFESSIONALLY MANAGED?
Do you have the time to follow our investment plans yourself? If you are a busy professional who would like to have his portfolio managed using our methodology, please contact me directly or get more details here.
Contact Ulli