
- Moving the markets
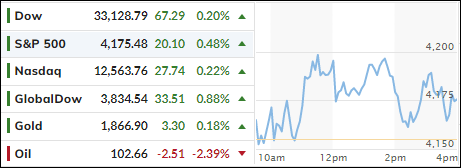
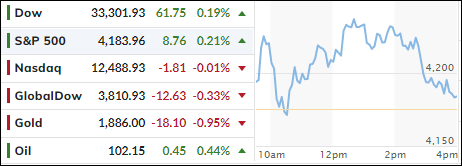
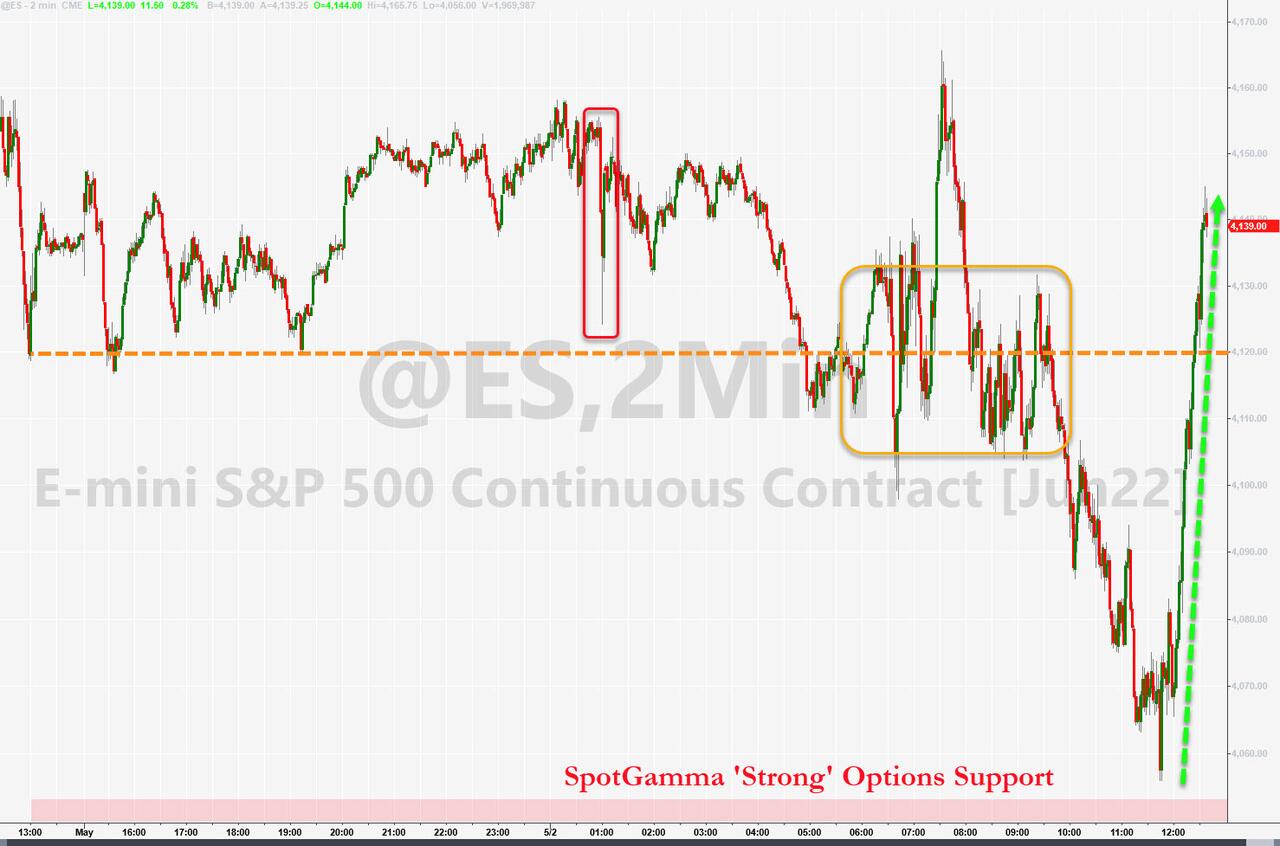
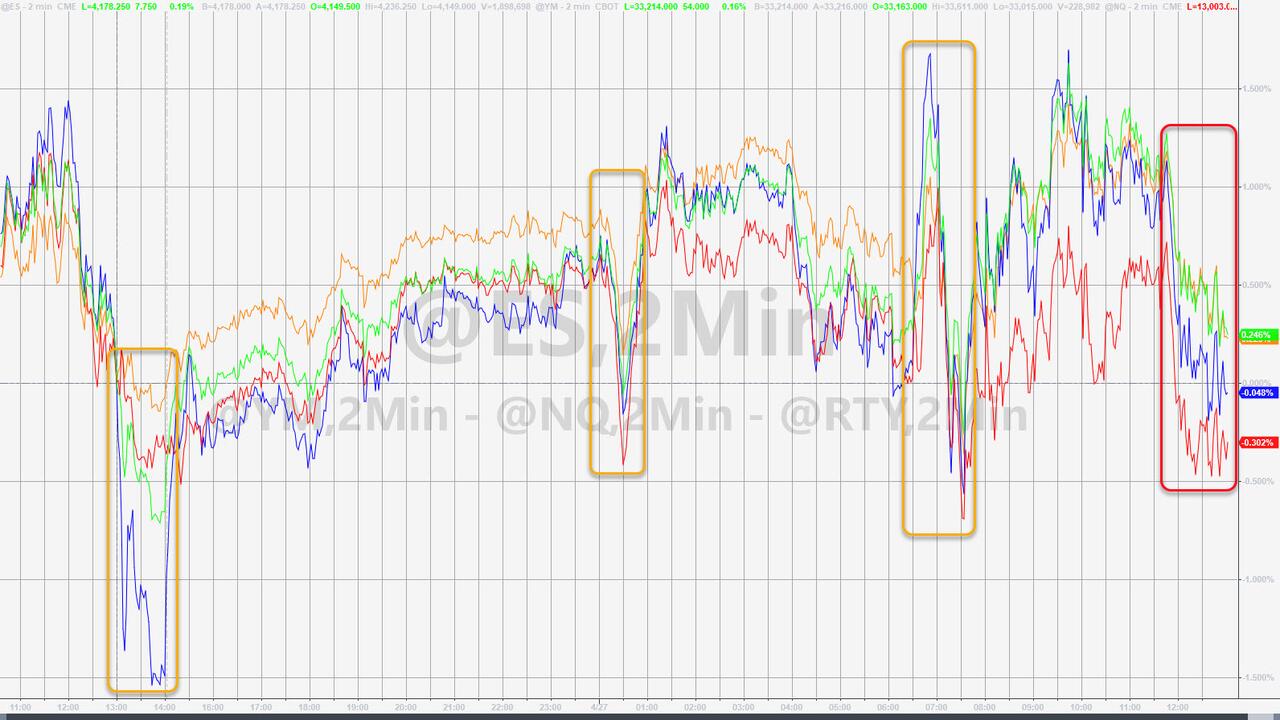
Aimless meandering best describes today’s session during which rally attempts were rebuffed with the major indexes dropping, bouncing off their respective unchanged lines and ending up moderately in the green.
Ahead of the Fed’s decision on interest rates tomorrow, the market environment was one of nervousness with the tug-of-war continuing between those traders who believe “the bottom” is in vs. the bears who are anxious about the potential of a sharp rebound rally.
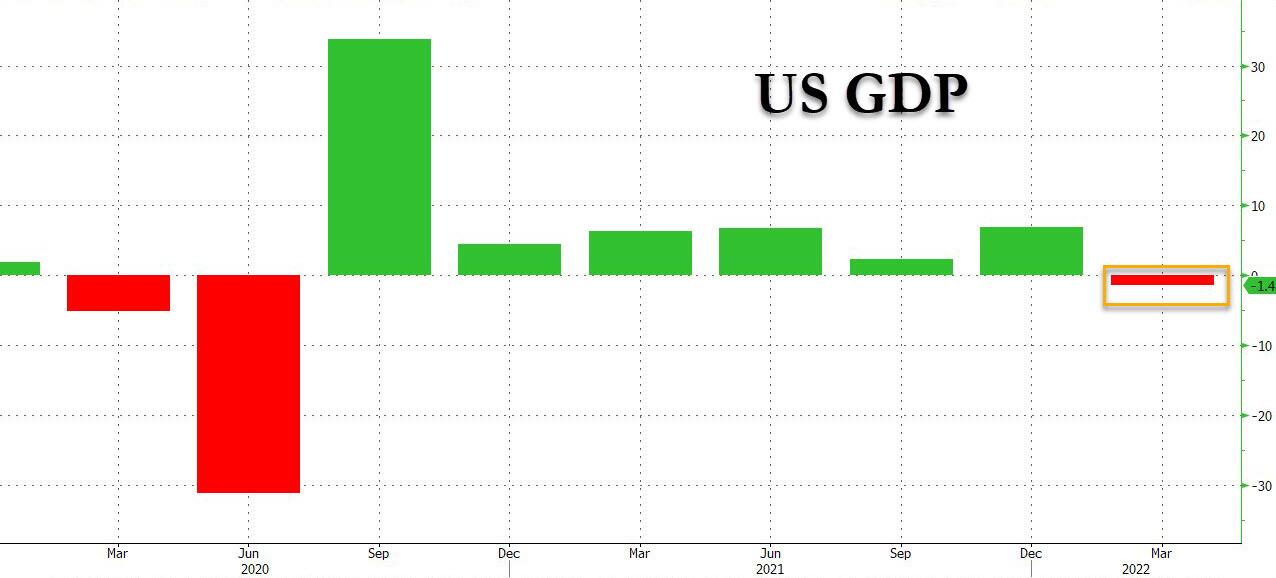
With opposite forces at play, namely a slowing economy and a tightening Fed, hedge fund manager Paul Tudor Jones took time out from his busy schedule to utter these words of wisdom that “capital preservation should be the main goal for investors.”
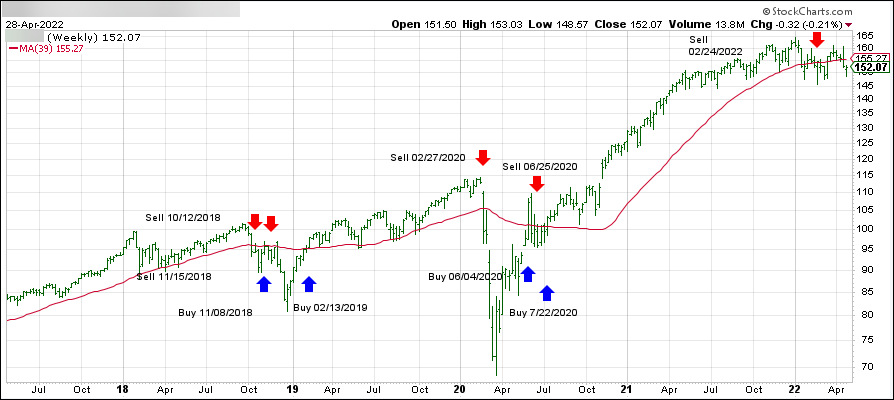
No kidding. This is the purpose of engaging in Trend Tracking and the use of trailing sell stops to begin with, because there will always be periods where risk and uncertainty have risen to an all-time high, such as we are experiencing now.
Of course, not everyone understands the prudence of riding out bearish periods on the sidelines, which prompted ZeroHedge to tweet this keen and spot-on observation:

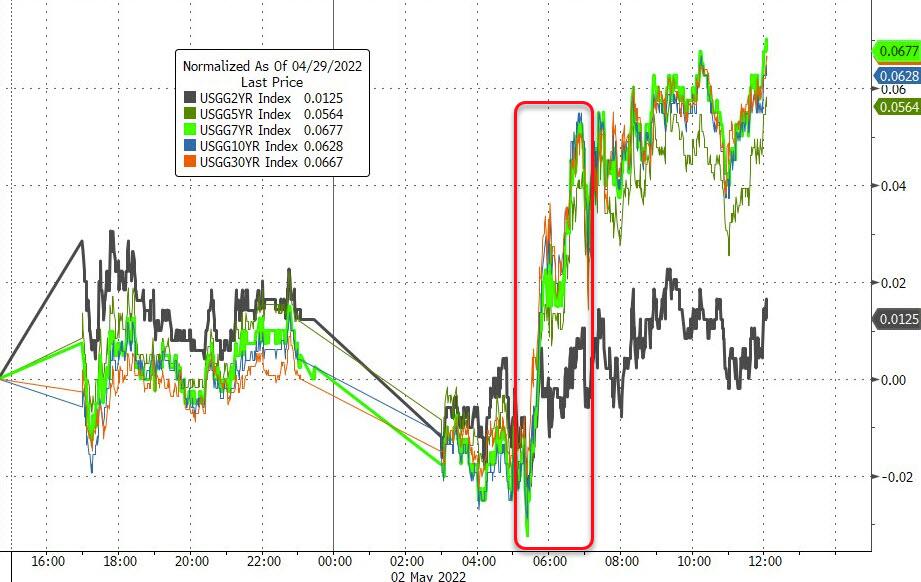
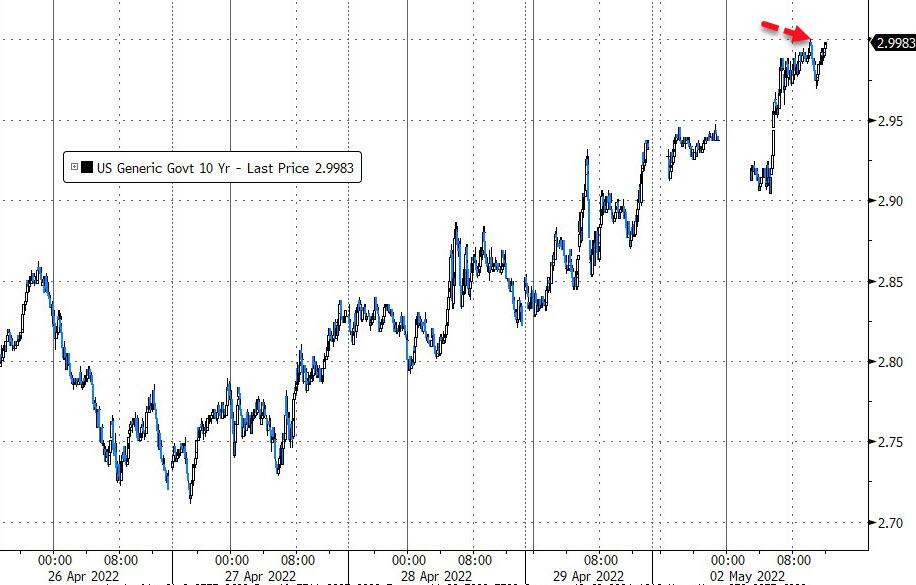
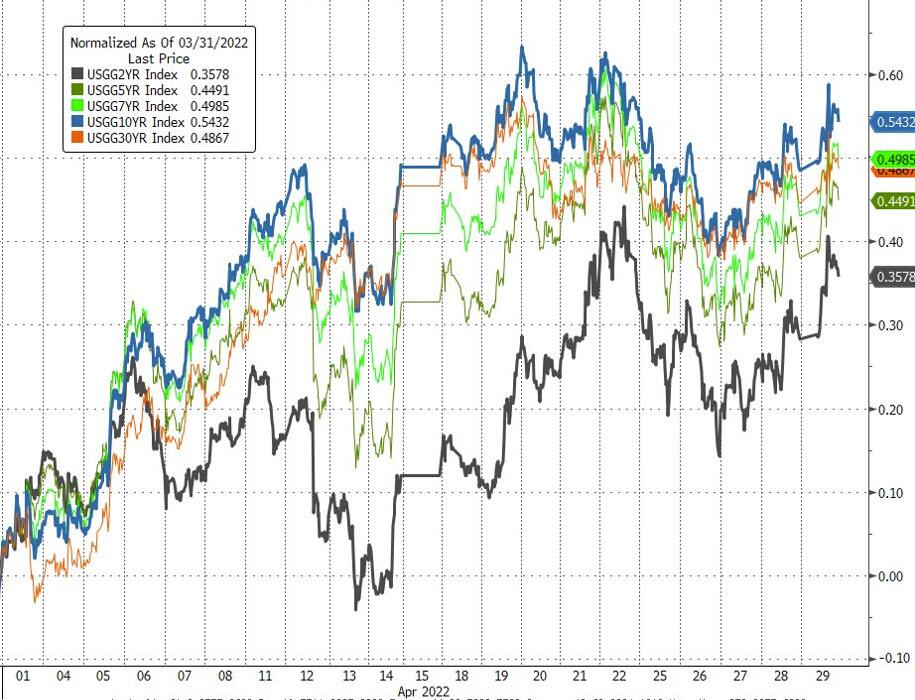
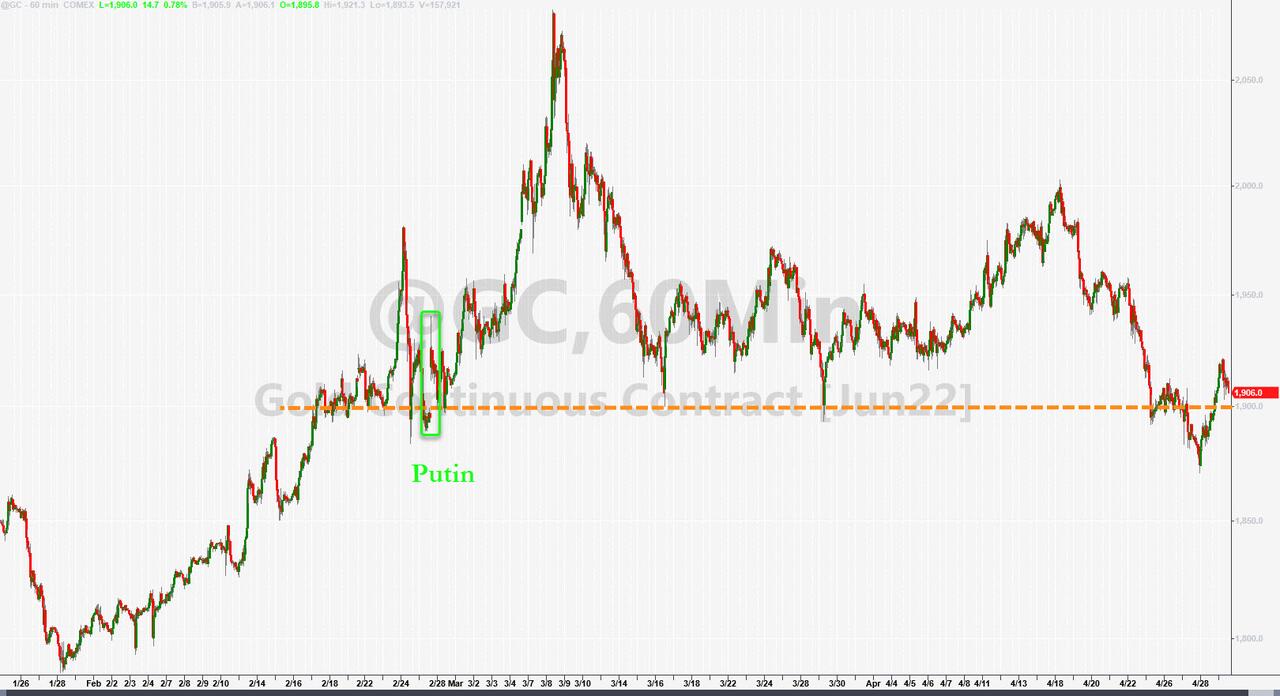
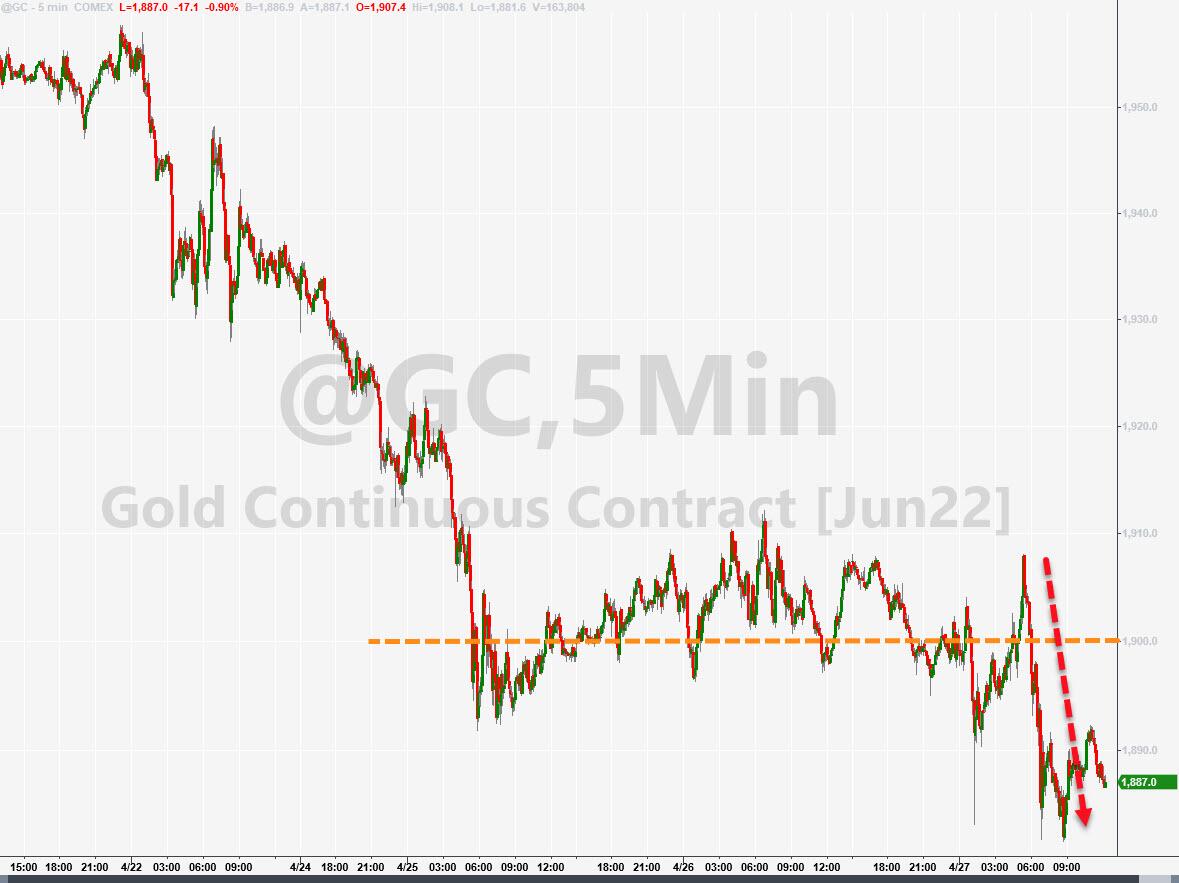
Bond yields dropped and popped, but the 10-year stopped short of reaching its 3% level again. Energy took top billing with VDE adding a solid +3.05%. Gold found some stability as well but only gained a tad and remains short of reaching its $1,900 level.
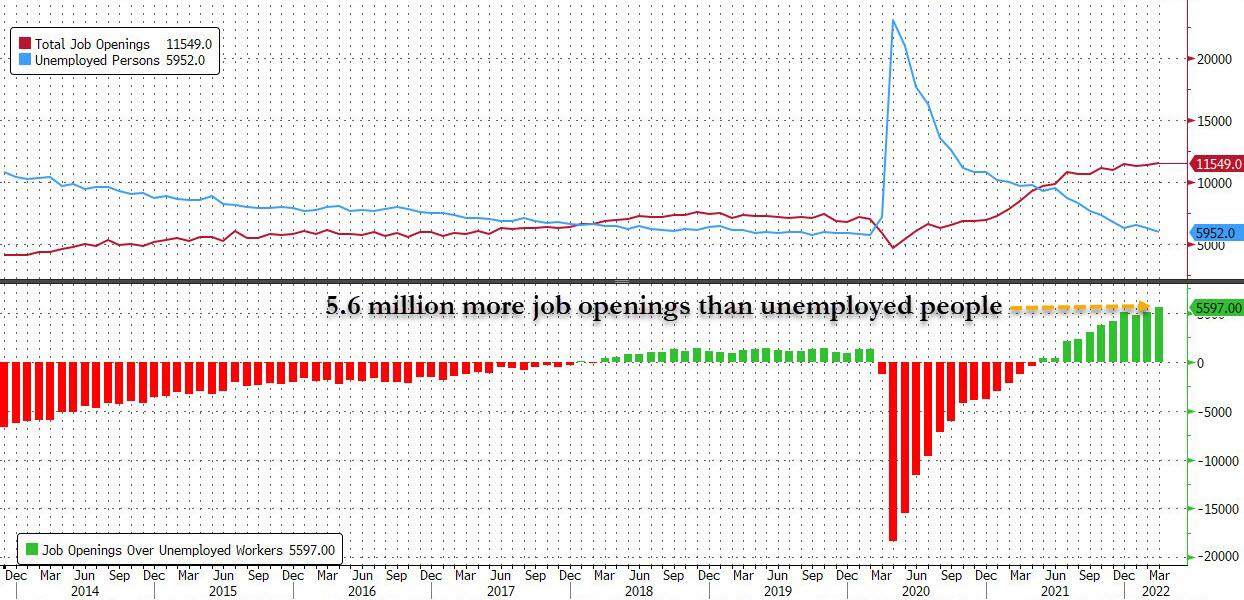
On the economic side, ZH reported that a record number of Americans just quit their job, as Job Openings surpassed unemployed workers by a record 5.6 million causing hedge fund manager Jeff Gundlach to quip:

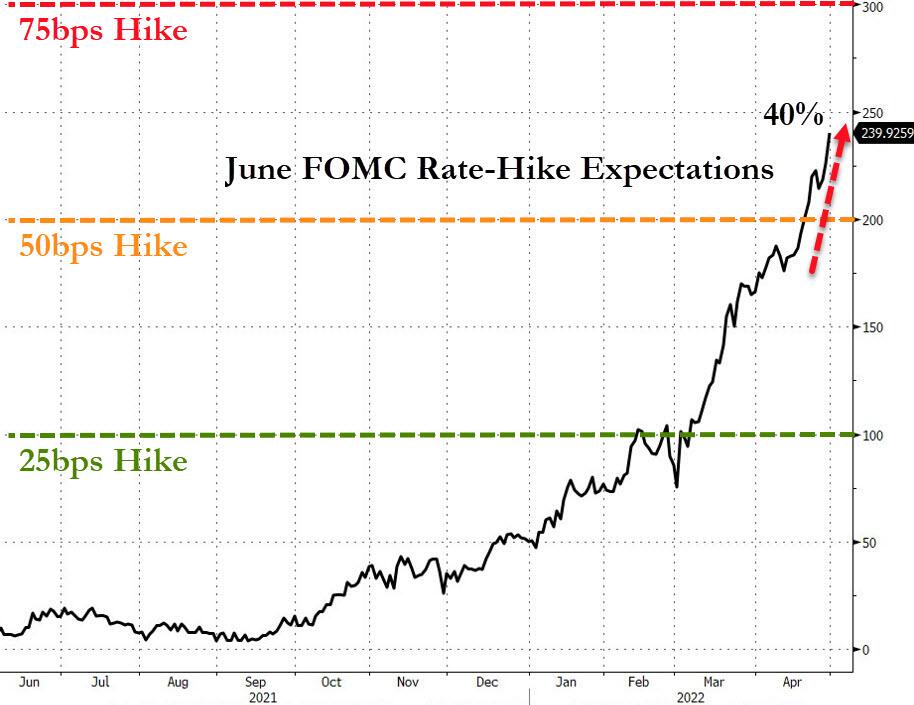
Now it’s up to the Fed to determine future market direction, which will be based on the aggressiveness with which it will battle the inflation monster.
Read More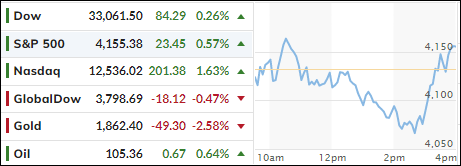
