
- Moving the markets
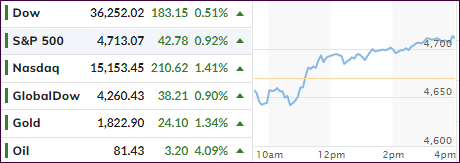
The major indexes built on yesterday’s comeback rally with the Nasdaq again taking the lead by gaining 1.41%. Still, the markets are struggling to find some footing after the New Year’s sell-off.
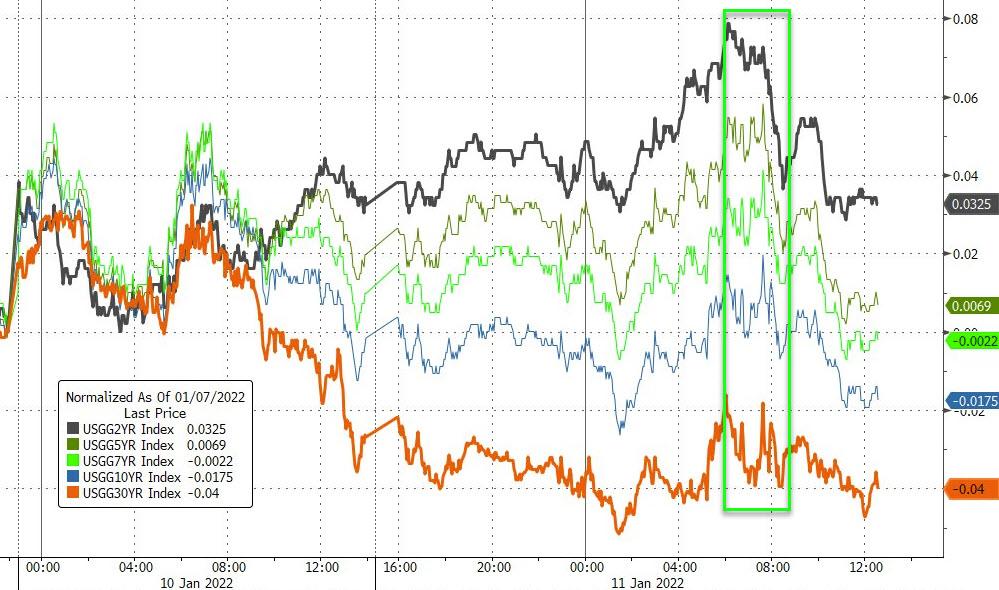
Rising interest rates have been the culprit that brought the Santa Clause rally to a standstill and a subsequent reversal. For a change, the voracious rise in bond yields slowed down with the 1-year ending the day at 1.75% giving equities a reprieve.
Fed head Powell testified before a Senate committee this morning as part of his re-confirmation process. He expects supply chain issues to normalize, which should mitigate inflationary pressures this year, and that he would not be afraid to hike rates further than intended should inflation remain high.
The markets took that as a rally cry, because of what he did not say, namely that the words “accelerated changes in policy,” above and beyond of what they already had indicated, were missing.
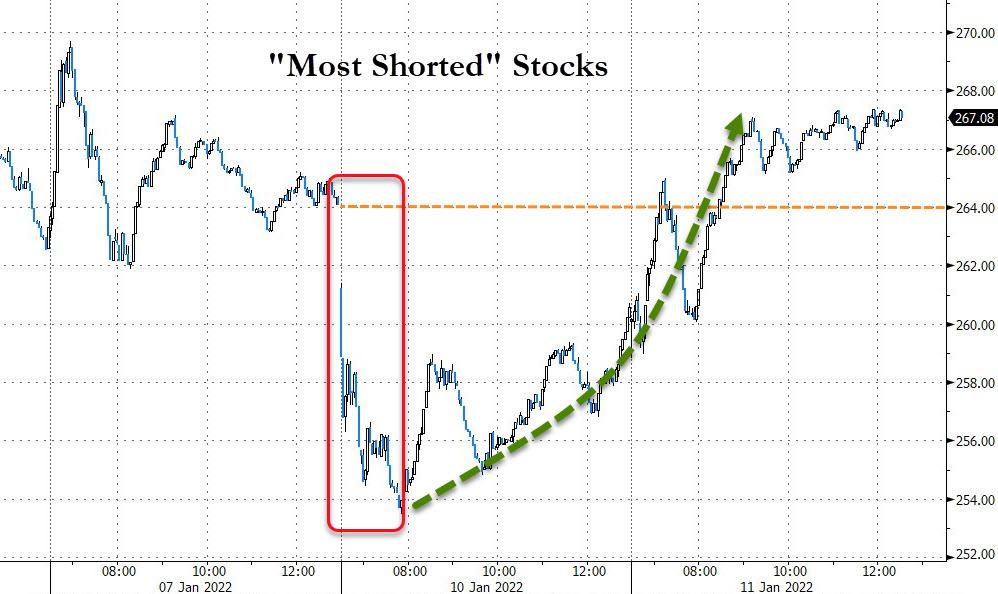
As a result, the bulls roamed freely and turned a weak opening into a ramp-a-thon with broad gains across the entire spectrum. Both, “value” and “growth” rallied in unison with SmallCaps outperforming. Of course, a continued short squeeze did its part of lending bullish support.
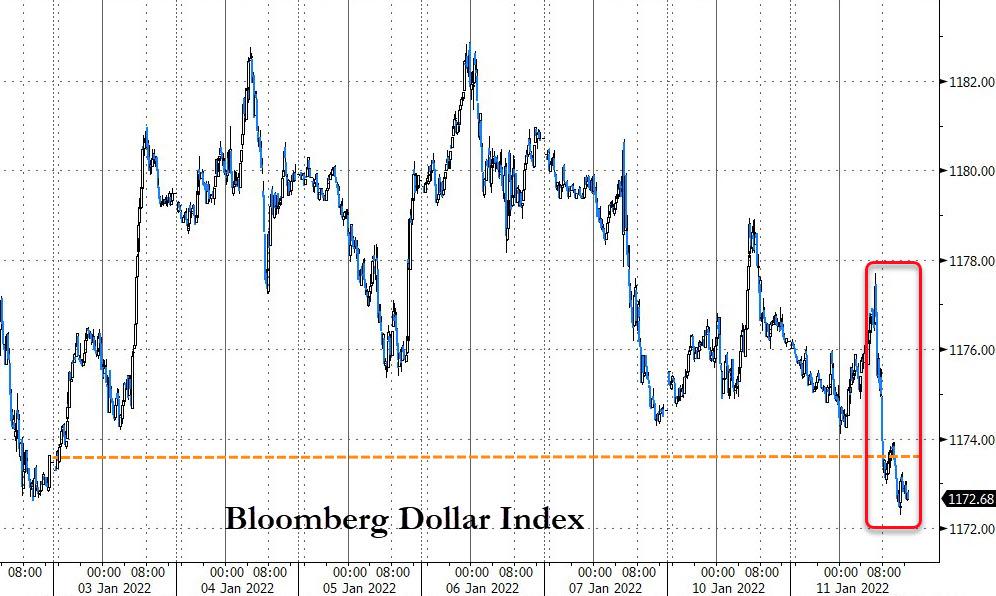
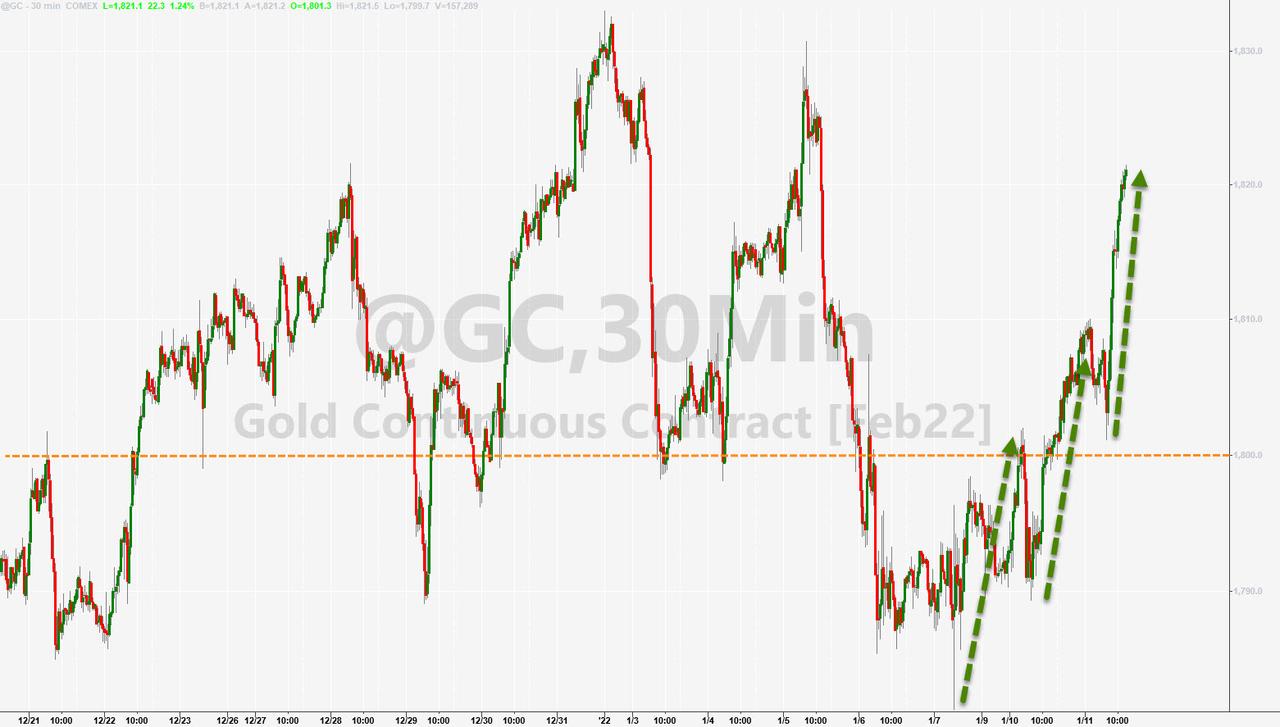
Easing yields sent the US Dollar lower and gold higher, with the precious metal scoring a chest-pounding advance of 1.33% thereby ending solidly above the $1,800 level.
This tweet below made me laugh out loud because it sums up the relationship between the markets and the Fed:
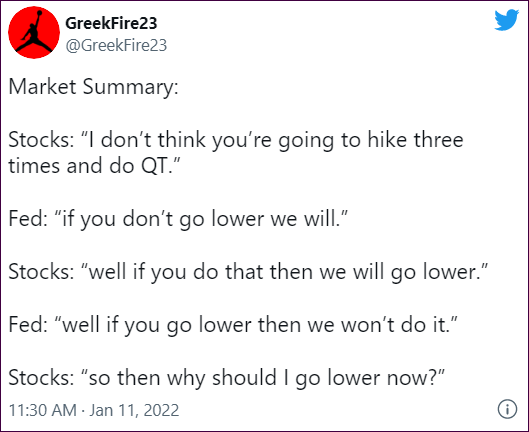
A tip of the hat to ZH for pointing towards this bon mot.
2. ETFs in the Spotlight
In case you missed the announcement and description of this section, you can read it here again.
It features some of the 10 broadly diversified domestic and sector ETFs from my HighVolume list as posted every Saturday. Furthermore, they are screened for the lowest MaxDD% number meaning they have been showing better resistance to temporary sell offs than all others over the past year.
The below table simply demonstrates the magnitude with which these ETFs are fluctuating above or below their respective individual trend lines (%+/-M/A). A break below, represented by a negative number, shows weakness, while a break above, represented by a positive percentage, shows strength.
For hundreds of ETF choices, be sure to reference Thursday’s StatSheet.
For this current domestic “Buy” cycle, here’s how some of our candidates have fared:

Click image to enlarge.
Again, the %+/-M/A column above shows the position of the various ETFs in relation to their respective long-term trend lines, while the trailing sell stops are being tracked in the “Off High” column. The “Action” column will signal a “Sell” once the -12% point has been taken out in the “Off High” column, which has replaced the prior -8% to -10% limits.
3. Trend Tracking Indexes (TTIs)
Our TTIs reversed and followed the bullish theme in the market.
This is how we closed 01/11/2022:
Domestic TTI: +5.66% above its M/A (prior close +4.68%)—Buy signal effective 07/22/2020.
International TTI: +5.35% above its M/A (prior close 4.41%)—Buy signal effective 07/22/2020.
Disclosure: I am obliged to inform you that I, as well as my advisory clients, own some of the ETFs listed in the above table. Furthermore, they do not represent a specific investment recommendation for you, they merely show which ETFs from the universe I track are falling within the specified guidelines.
All linked charts above are courtesy of Bloomberg via ZeroHedge.
Contact Ulli