
ETF Tracker StatSheet
You can view the latest version here.
SLITHERING INTO THE WEEKEND
- Moving the markets
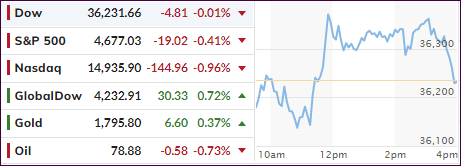
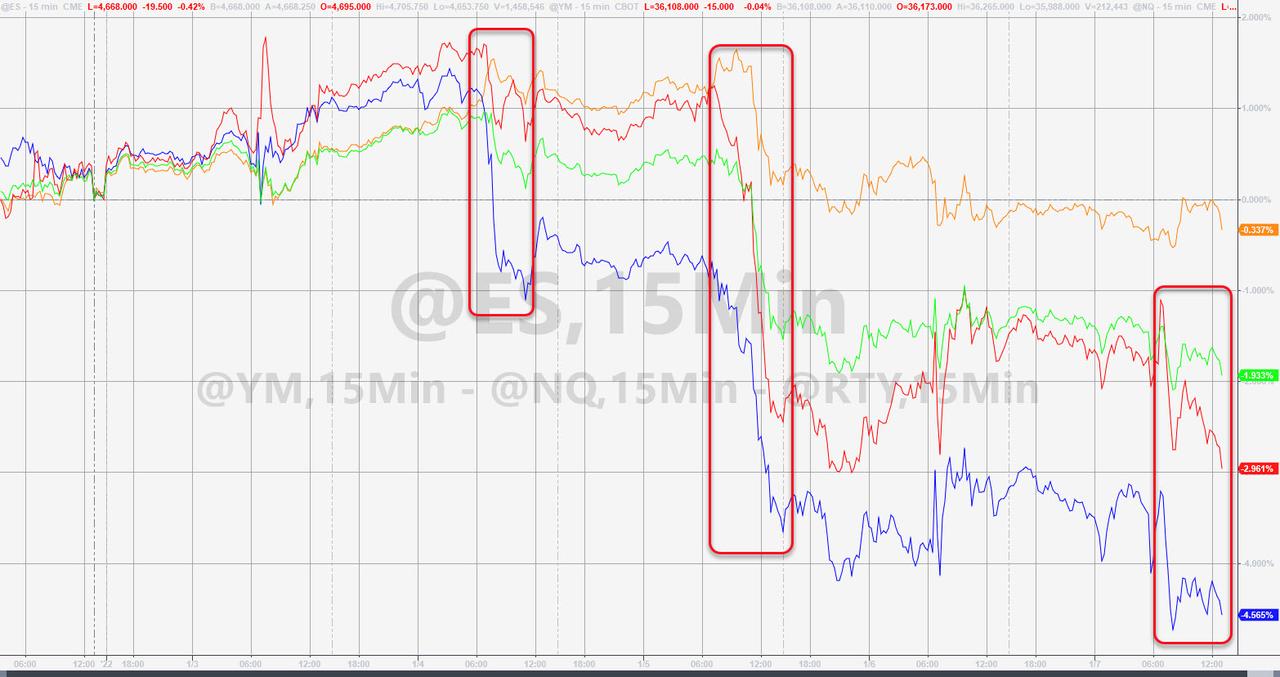
After the most recent bullish ramp, which commenced the middle of December, the major indexes finally ran into some headwinds in the form of surging bond yields and started 2022 by posting a losing week.
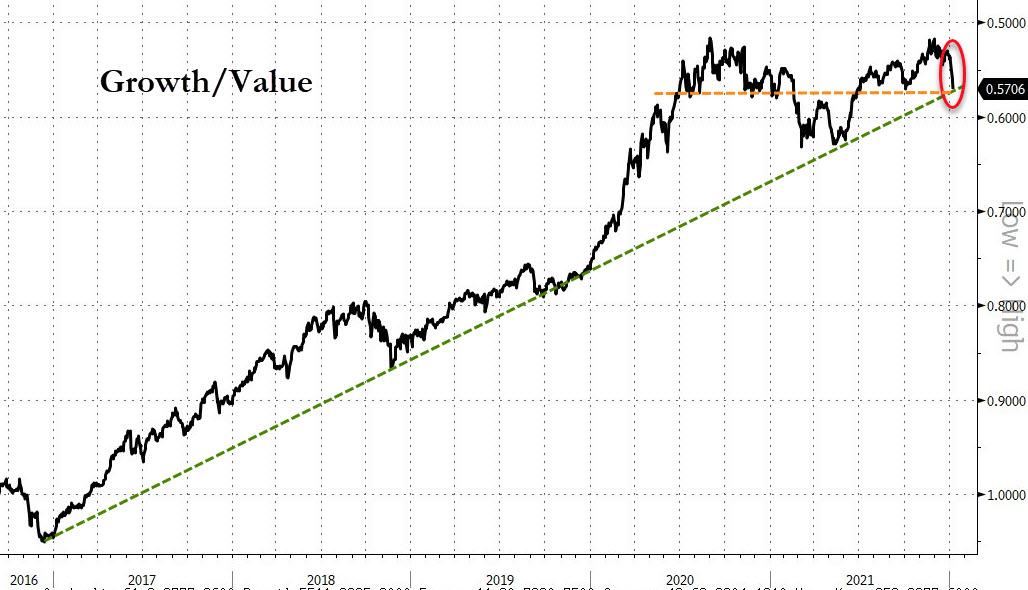
Given the nearness to its all-time highs, the S&P’s weekly loss of 1.8% is hardly concerning. The tech sector (-4%) bore the brunt of the selling due to its sensitivity to higher rates. Therefore, it’s not surprising that SmallCaps (-1.58%) were hit hard, along with the Pure Growth ETF RPG (-1.78%), while its value cousin RPV surged and gained a solid +1.34% for the day.
The culprit was spiking bond yields with the 10-year surpassing 1.79% today before settling at 1.77%. Again, we started the year with 1.51%, which means yields have shot up by 17% in only five trading days. The Fed has made it clear that it will dial back its economic help faster than anticipated, thereby creating anxiety and uncertainty in the trading community.
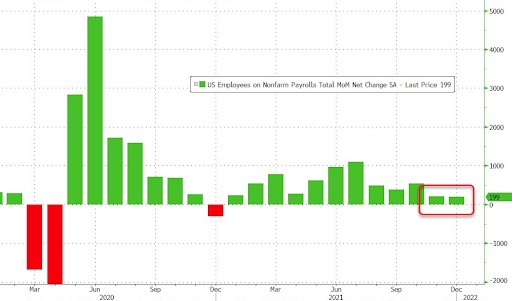
Not helping equites was today’s huge miss in December payrolls, as we learned that only 199k jobs were added, a huge miss to expectations of 447k and a whisper number of over 500k. Ouch! The unemployment rate dropped to 3.9% but, given shortages in most labor sectors, this may not be a positive.
The US Dollar took a dive and ended where it started the year allowing gold to score a modest rebound of +0.34%, which was not enough to reach its recently lost $1,800 level.
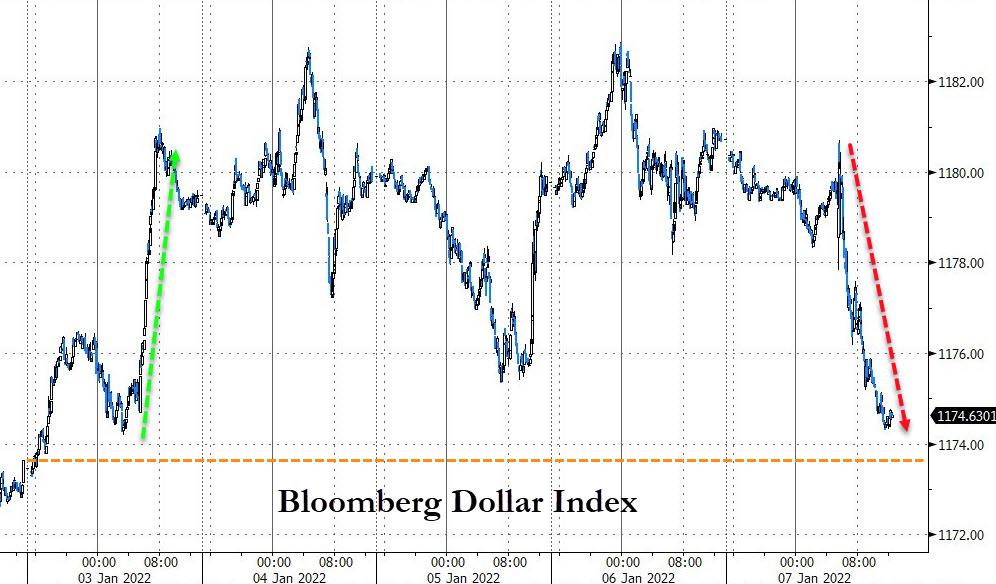
Traders will have to digest a lot of information this weekend.
2. ETFs in the Spotlight
In case you missed the announcement and description of this section, you can read it here again.
It features some of the 10 broadly diversified domestic and sector ETFs from my HighVolume list as posted every Saturday. Furthermore, they are screened for the lowest MaxDD% number meaning they have been showing better resistance to temporary sell offs than all others over the past year.
The below table simply demonstrates the magnitude with which these ETFs are fluctuating above or below their respective individual trend lines (%+/-M/A). A break below, represented by a negative number, shows weakness, while a break above, represented by a positive percentage, shows strength.
For hundreds of ETF choices, be sure to reference Thursday’s StatSheet.
For this current domestic “Buy” cycle, here’s how some of our candidates have fared:
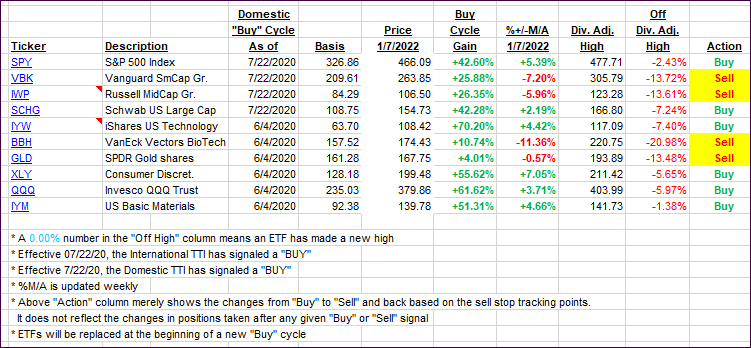
Click image to enlarge.
Again, the %+/-M/A column above shows the position of the various ETFs in relation to their respective long-term trend lines, while the trailing sell stops are being tracked in the “Off High” column. The “Action” column will signal a “Sell” once the -12% point has been taken out in the “Off High” column, which has replaced the prior -8% to -10% limits.
3. Trend Tracking Indexes (TTIs)
Our TTIs again went opposite ways. The International one surged even though the Domestic one pulled back slightly.
This is how we closed 01/07/2022:
Domestic TTI: +5.79% above its M/A (prior close +5.96%)—Buy signal effective 07/22/2020.
International TTI: +5.08% above its M/A (prior close 4.30%)—Buy signal effective 07/22/2020.
Disclosure: I am obliged to inform you that I, as well as my advisory clients, own some of the ETFs listed in the above table. Furthermore, they do not represent a specific investment recommendation for you, they merely show which ETFs from the universe I track are falling within the specified guidelines.
All linked charts above are courtesy of Bloomberg via ZeroHedge.
———————————————————-
WOULD YOU LIKE TO HAVE YOUR INVESTMENTS PROFESSIONALLY MANAGED?
Do you have the time to follow our investment plans yourself? If you are a busy professional who would like to have his portfolio managed using our methodology, please contact me directly or get more details here.
Contact Ulli