
- Moving the markets
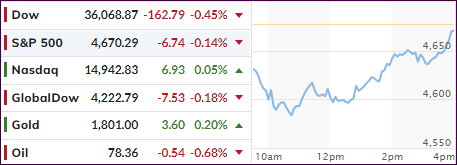
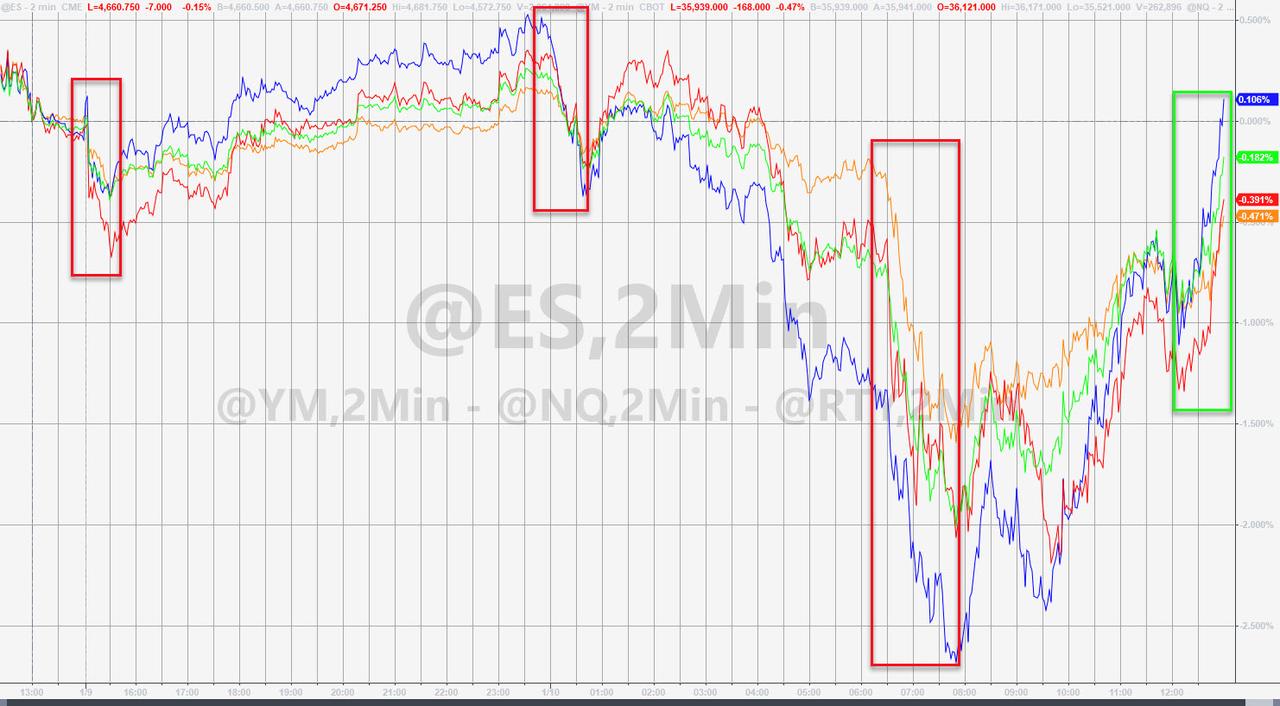
Last week’s negative market theme continued this morning when the major indexes took another dive with the Dow being down over 500 points at one moment in time. Dip buyers made an appearance, as the indexes attempted to climb out of a deep hole.
Though they did not manage to crawl back to their respective unchanged lines, except for the Nasdaq, it was a valiant effort nonetheless with early losses being cut substantially.
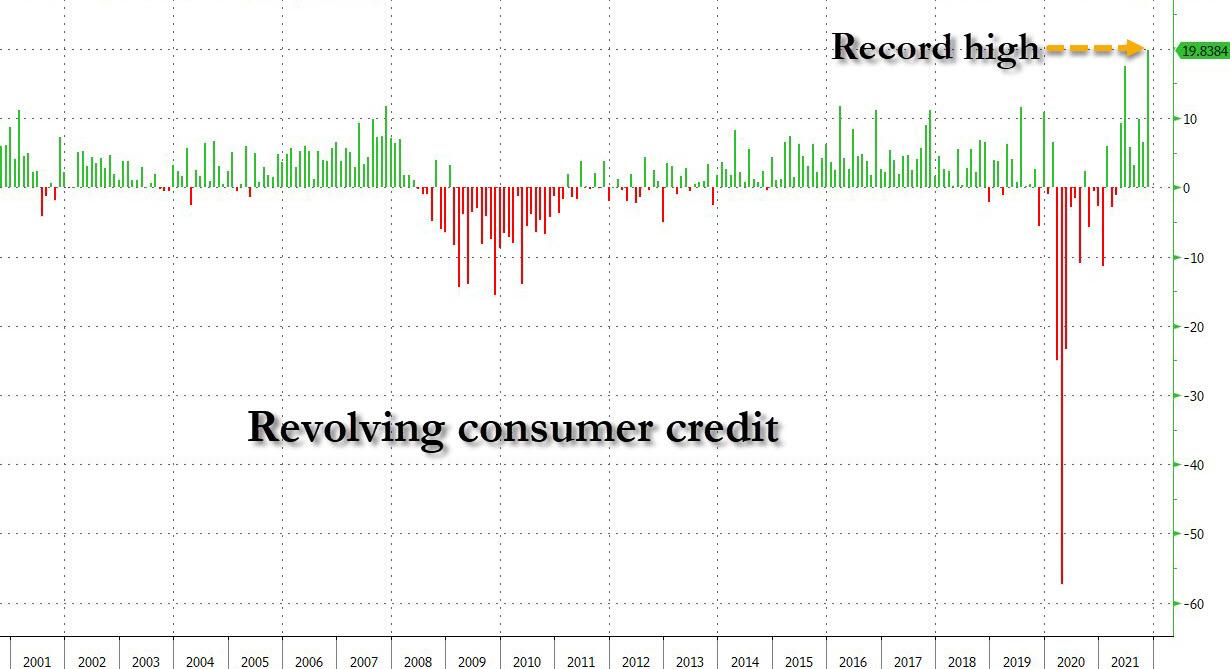
Bond yields continued to soar with the 10-year breaking briefly through the 1.80% level but settling at 1.77%. We are now witnessing rising yields meeting a slowing economy with consumers, having spent all of their stimulus checks, taking advantage of their credit card availability and going on a record spending spree, as ZH reported.
The sell-off was broad with more than 70% of the S&P 500 stocks declining. The mid-day rebound had pure growth ETFs like RPG rally off their lows, along with the tech sector in general, and advance by 0.29% for the day.
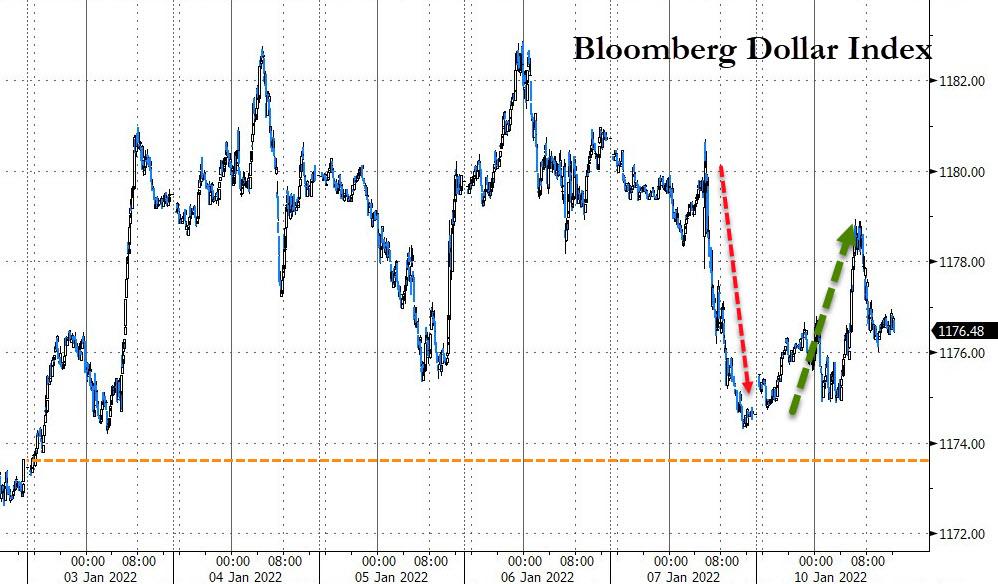
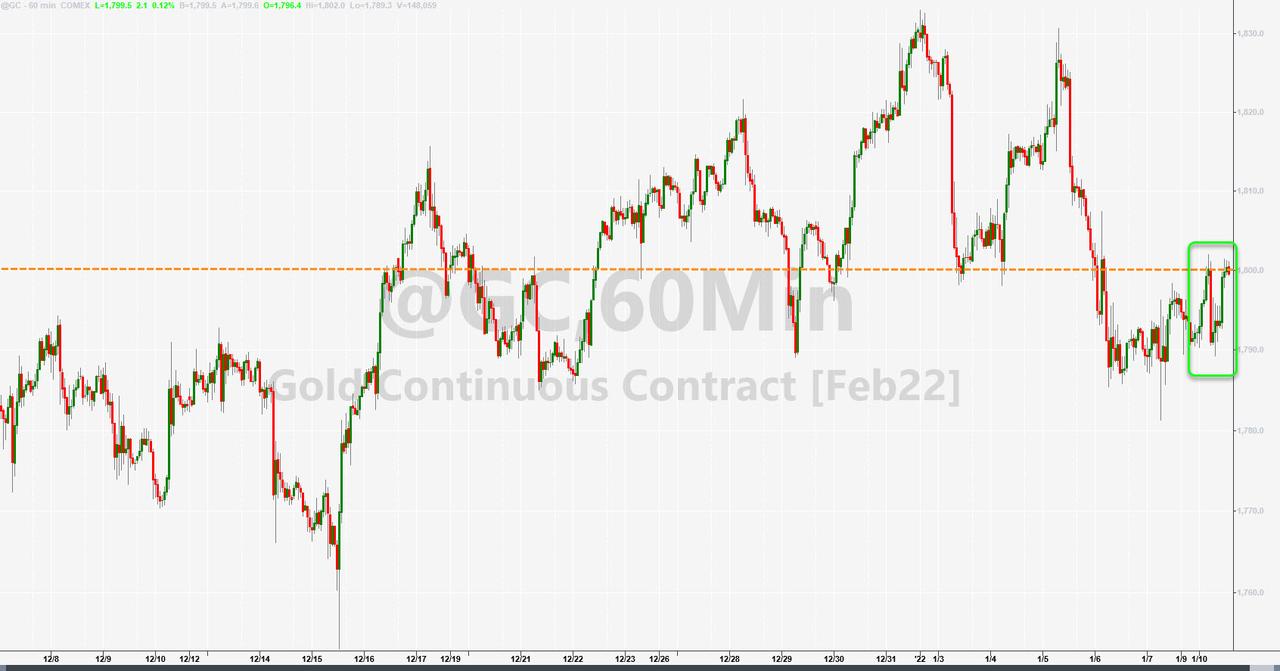
The US Dollar index pumped and dumped but closed moderately higher. Surprisingly, Gold was not affected by the dollar’s strength, and the precious metal eked out a modest gain and reclaimed its $1,800 level.
Based on Bloomberg’s Financial Conditions Index, there is more downside on deck. However, I think much depends on how serious the Fed will be to fight inflation with much higher rates and less stimulus. After all, they are the elephant in the room.
2. ETFs in the Spotlight
In case you missed the announcement and description of this section, you can read it here again.
It features some of the 10 broadly diversified domestic and sector ETFs from my HighVolume list as posted every Saturday. Furthermore, they are screened for the lowest MaxDD% number meaning they have been showing better resistance to temporary sell offs than all others over the past year.
The below table simply demonstrates the magnitude with which these ETFs are fluctuating above or below their respective individual trend lines (%+/-M/A). A break below, represented by a negative number, shows weakness, while a break above, represented by a positive percentage, shows strength.
For hundreds of ETF choices, be sure to reference Thursday’s StatSheet.
For this current domestic “Buy” cycle, here’s how some of our candidates have fared:
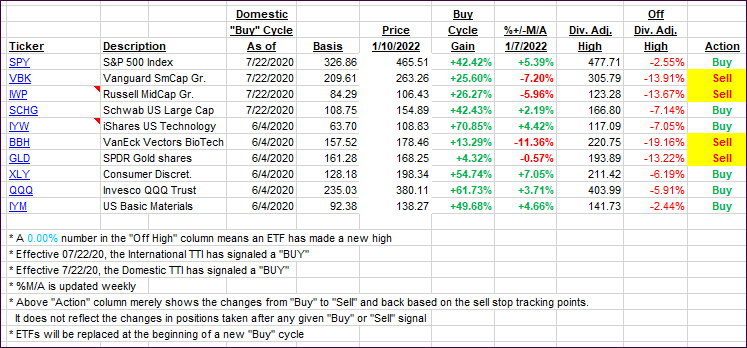
Click image to enlarge.
Again, the %+/-M/A column above shows the position of the various ETFs in relation to their respective long-term trend lines, while the trailing sell stops are being tracked in the “Off High” column. The “Action” column will signal a “Sell” once the -12% point has been taken out in the “Off High” column, which has replaced the prior -8% to -10% limits.
3. Trend Tracking Indexes (TTIs)
Our TTIs dropped and followed the theme of the broad market.
This is how we closed 01/10/2022:
Domestic TTI: +4.68% above its M/A (prior close +5.79%)—Buy signal effective 07/22/2020.
International TTI: +4.41% above its M/A (prior close 5.08%)—Buy signal effective 07/22/2020.
Disclosure: I am obliged to inform you that I, as well as my advisory clients, own some of the ETFs listed in the above table. Furthermore, they do not represent a specific investment recommendation for you, they merely show which ETFs from the universe I track are falling within the specified guidelines.
All linked charts above are courtesy of Bloomberg via ZeroHedge.
Contact Ulli