
- Moving the markets
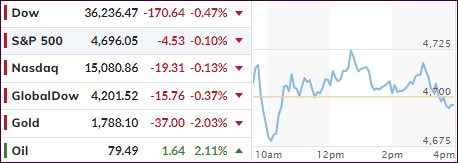
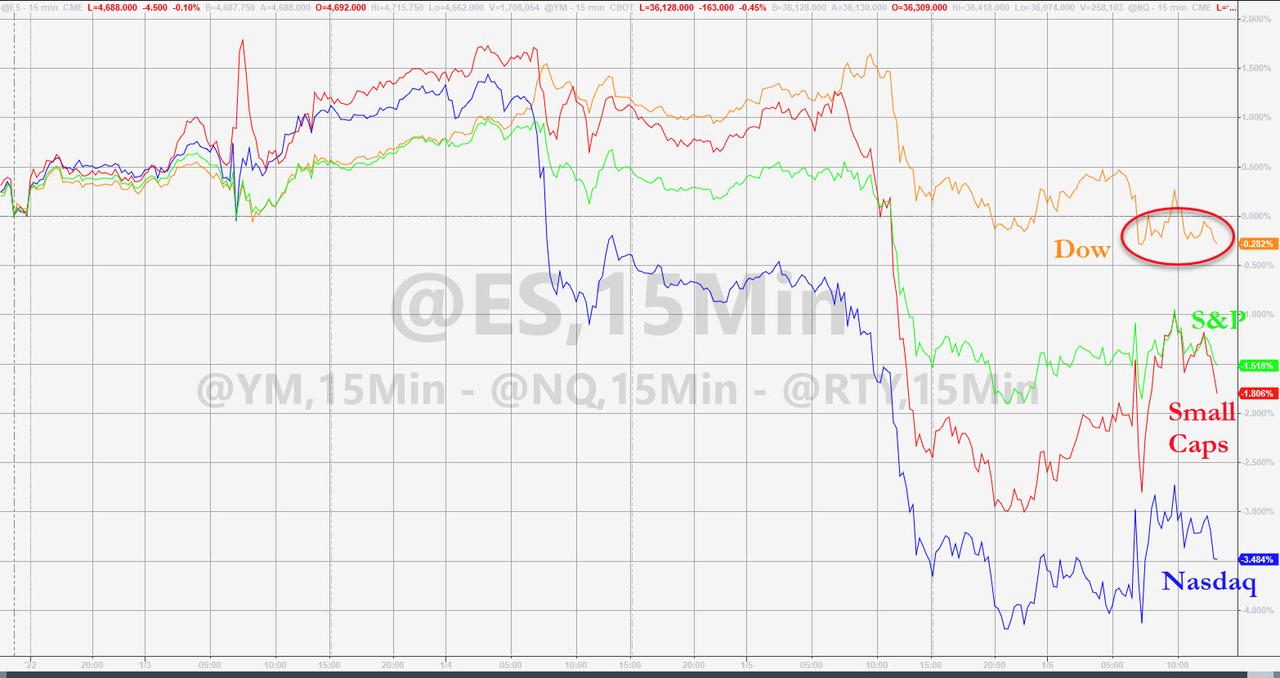
Another up and down day supported the meme that bulls and bears are engaged in a tug-of-war with the latter so far coming out on top. However, today, the forces were more evenly matched, as the major indexes surrendered only a fraction with the Dow faring the worst.
The tech sector was in scramble mode with some of their darlings continuing to slide, which made traders realize that tech will not always be the winner every trading day in 2022, thereby causing the overweight allocations to be adjusted.
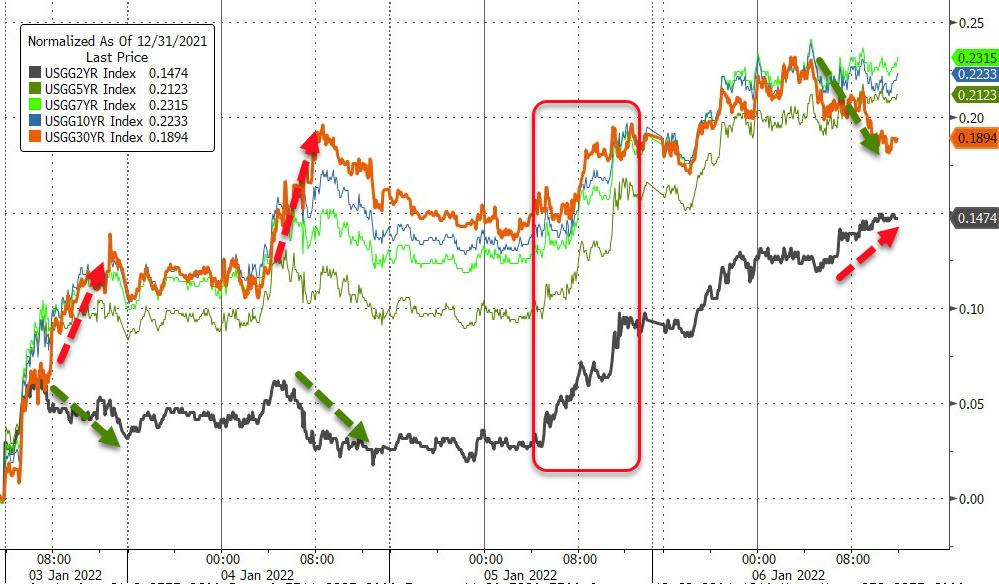
The main irritant behind today’s scramble remains the hard to accept fact that the Fed will remove its economic stimulus more quickly than hoped for, which has contributed to the wild swings of the recent days. Odds are now 86% that we will see 3.5 rate-hikes by the end of 2022.
As a result, bond yields continued their climb higher with the 10-year touching the 1.75% level before pulling back to the 1.72% area. For reference, the 10-year ended 2021 at 1.51%. The main beneficiary of this ramp has been the banking industry with the financial ETF XLF adding +1.5% for the session.
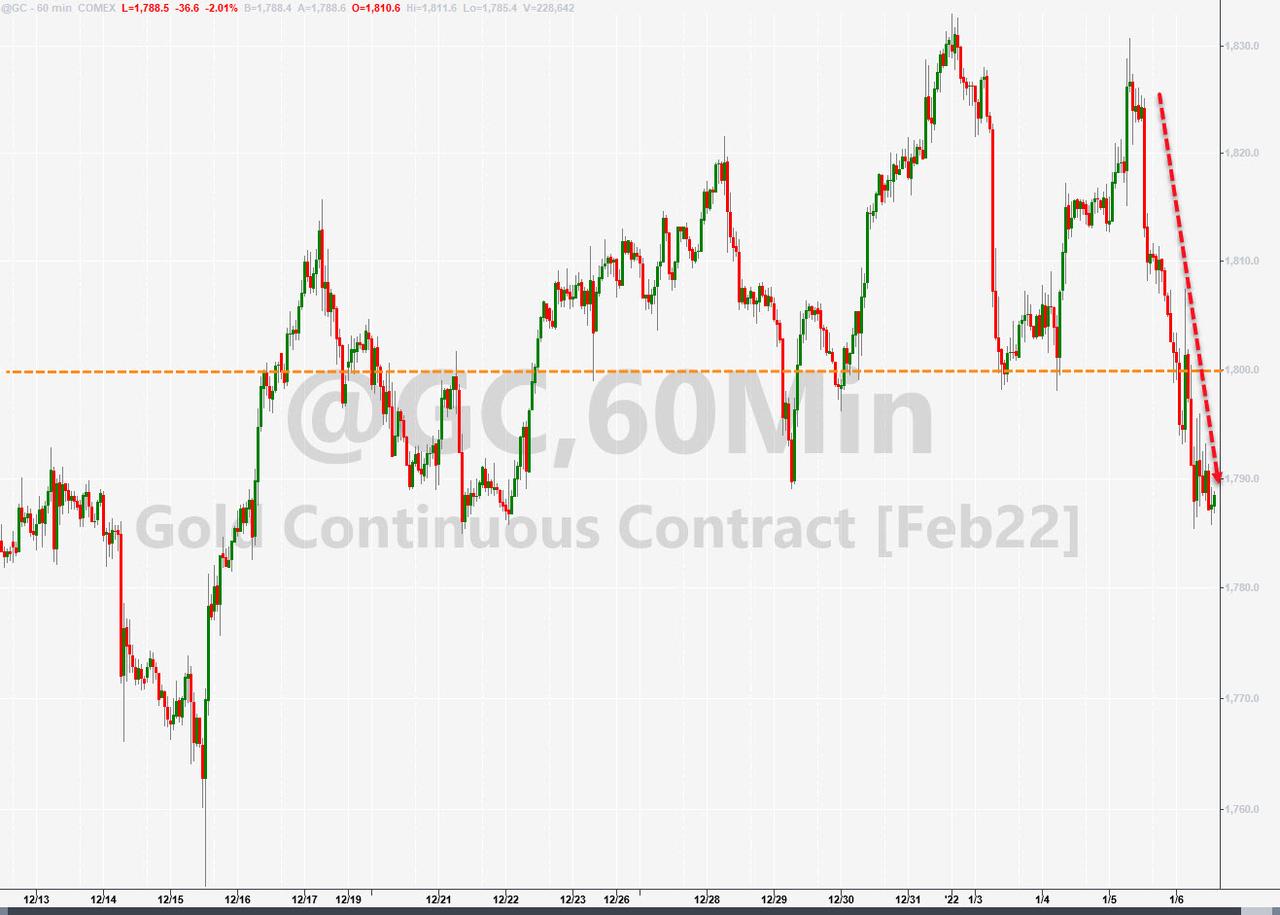
The US Dollar chopped around as well and ended slightly in the green, but gold was the dud of the day after getting hammered and losing its $1,800 level again. The precious metal gave back -2.04%.
Can tomorrow’s jobs report give an assist to the bulls?
2. ETFs in the Spotlight
In case you missed the announcement and description of this section, you can read it here again.
It features some of the 10 broadly diversified domestic and sector ETFs from my HighVolume list as posted every Saturday. Furthermore, they are screened for the lowest MaxDD% number meaning they have been showing better resistance to temporary sell offs than all others over the past year.
The below table simply demonstrates the magnitude with which these ETFs are fluctuating above or below their respective individual trend lines (%+/-M/A). A break below, represented by a negative number, shows weakness, while a break above, represented by a positive percentage, shows strength.
For hundreds of ETF choices, be sure to reference Thursday’s StatSheet.
For this current domestic “Buy” cycle, here’s how some of our candidates have fared:
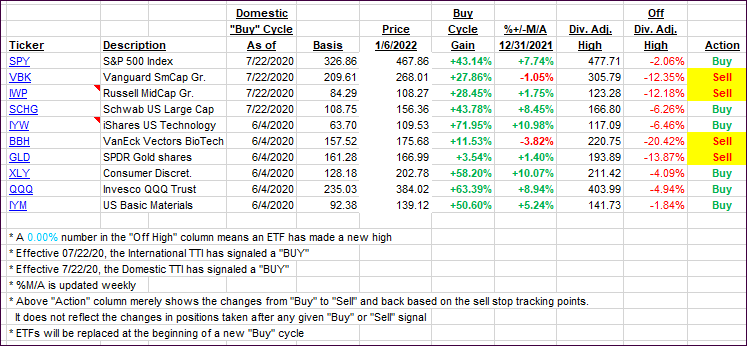
Click image to enlarge.
Again, the %+/-M/A column above shows the position of the various ETFs in relation to their respective long-term trend lines, while the trailing sell stops are being tracked in the “Off High” column. The “Action” column will signal a “Sell” once the -12% point has been taken out in the “Off High” column, which has replaced the prior -8% to -10% limits.
3. Trend Tracking Indexes (TTIs)
Our TTIs went opposite ways. The Domestic one bucked the bearish trend by gaining a tad, while the International one remained in sync with bearish forces.
This is how we closed 01/06/2022:
Domestic TTI: +5.96% above its M/A (prior close +5.72%)—Buy signal effective 07/22/2020.
International TTI: +4.30% above its M/A (prior close 4.56%)—Buy signal effective 07/22/2020.
Disclosure: I am obliged to inform you that I, as well as my advisory clients, own some of the ETFs listed in the above table. Furthermore, they do not represent a specific investment recommendation for you, they merely show which ETFs from the universe I track are falling within the specified guidelines.
All linked charts above are courtesy of Bloomberg via ZeroHedge.
Contact Ulli