Weekly StatSheet For The ETF Tracker Newsletter – Updated Through 11/17/2022

Ulli ETF StatSheet Contact

ETF Data updated through Thursday, November 17, 2022
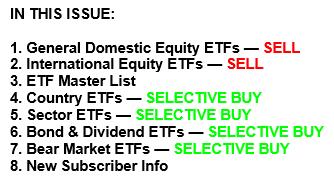
Methodology/Use of this StatSheet:

1. From the universe of over 1,800 ETFs, I have selected only those with a trading volume of over $5 million per day (HV ETFs), so that liquidity and a small bid/ask spread are assured.

2. Trend Tracking Indexes (TTIs)

Buy or Sell decisions for Domestic and International ETFs (section 1 and 2), are made based on the respective TTI and its position either above or below its long-term M/A (Moving Average). A crossing of the trend line from below accompanied by some staying power above constitutes a “Buy” signal. Conversely, a clear break below the line constitutes a “Sell” signal. Additionally, I use a 12% trailing stop loss on all positions in these categories to control downside risk.

3. All other investment arenas do not have a TTI and should be traded based on the position of the individual ETF relative to its own respective trend line (%M/A). That’s why those signals are referred to as a “Selective Buy.” In other words, if an ETF crosses its own trendline to the upside, a “Buy” signal is generated. Here too, I recommend trailing sell stop of 12%, or less, depending on your risk tolerance.

If you are unfamiliar with some of the terminology, please see Glossary of Terms and new subscriber information in section 9.     

1. DOMESTIC EQUITY ETFs: SELL — since 02/24/2022

Click on chart to enlarge

Our main directional indicator, the Domestic Trend Tracking Index (TTI-green line in the above chart) has broken back above its long-term trend line (red) by a scant +0.20% but remains in “SELL” mode—for the time being.  

Read More
Struggling For Direction

Ulli Market Commentary Contact

[Chart courtesy of MarketWatch.com]

  1. Moving the markets

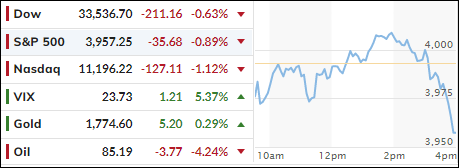
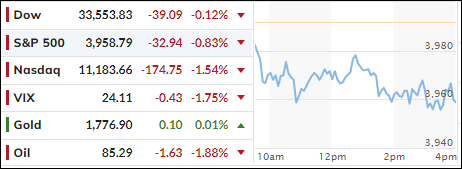
Weakness prevailed right from the get-go, when retail stocks were dragged lower due to Target reporting a decline in sales causing their stock price to dive some 13%. Shoppers are struggling with high inflation ahead of the biggest shopping season of the year.

On the other hand, US Retail Sales soared 1.3% MoM in October, which seems to indicate that consumers are willing to spend, yet Target’s report points towards slower consumption. Go figure…

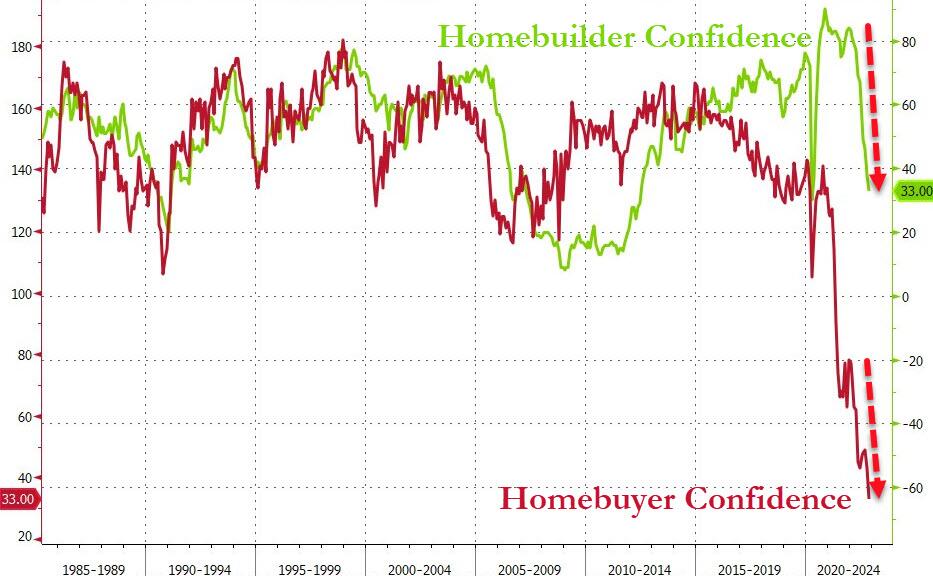
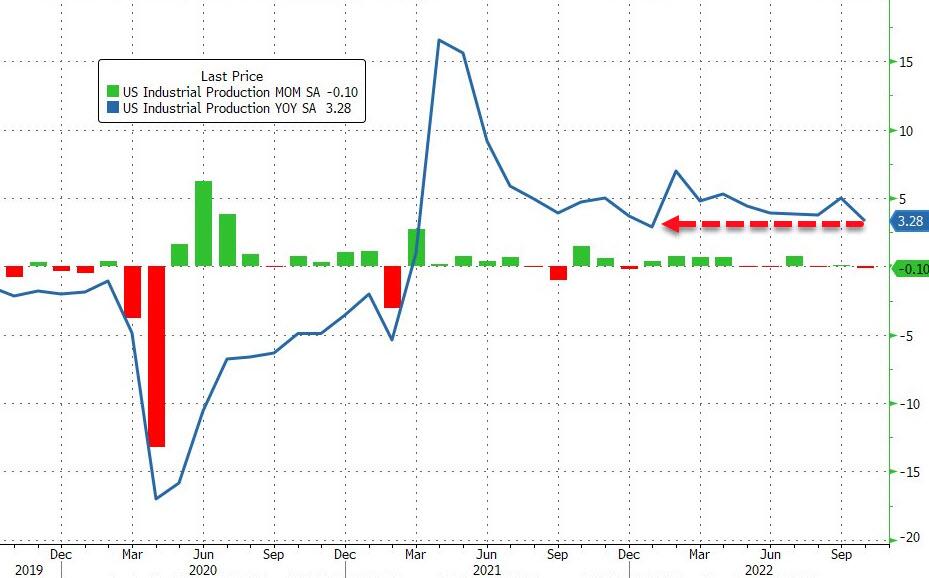
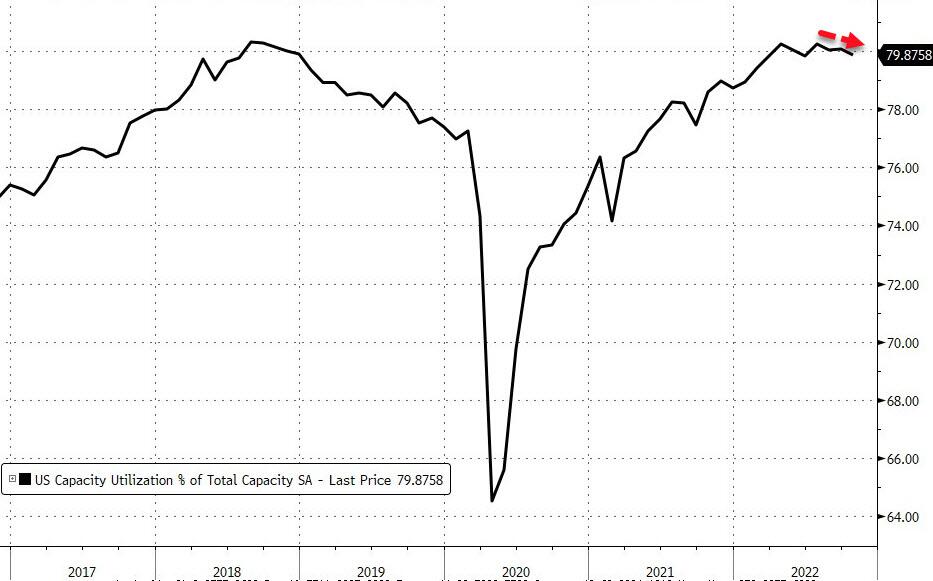
Other economic data painted an ugly picture with US Homebuilder Confidence collapsing in October and Homebuyer Confidence simply biting the dust, as ZeroHedge explained. To add more pain to a shrinking economy, we learned that US Industrial Production unexpectedly contracted last month, while Capacity Utilization slowed.

None of the above will potentially support bullish market sentiment, once this quarter ends, but for the time being more upside momentum is a possibility during this seasonally strong period of the year.

Today, it was the Fed’s Mary Daly singing these hawkish tunes:

  • Somewhere between 4.75 and 5.25 seems a reasonable place to think about as we go into the next meeting. And so that does put it in the line of sight that we would get to a point where we would raise and hold.
  • Pausing is off the table right now, it’s not even part of the discussion. Right now, the discussion is, rightly, in slowing the pace.

Daly also warned the ‘peak inflationistas’:

  • One month of data does not a victory make.

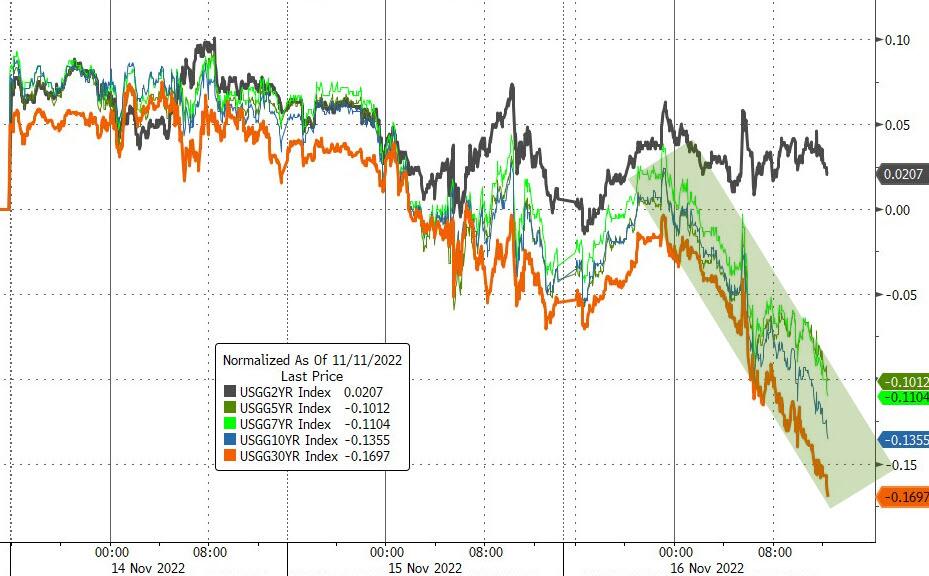
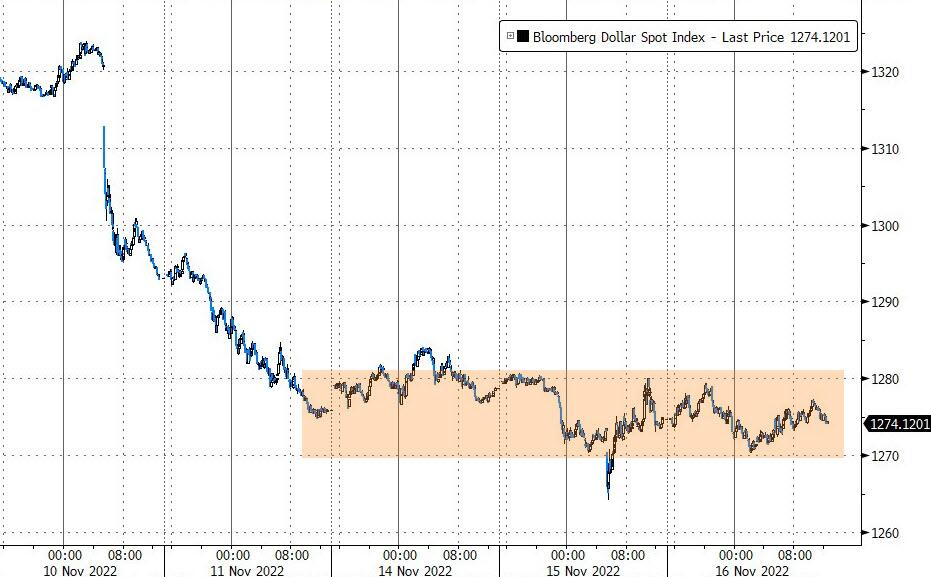
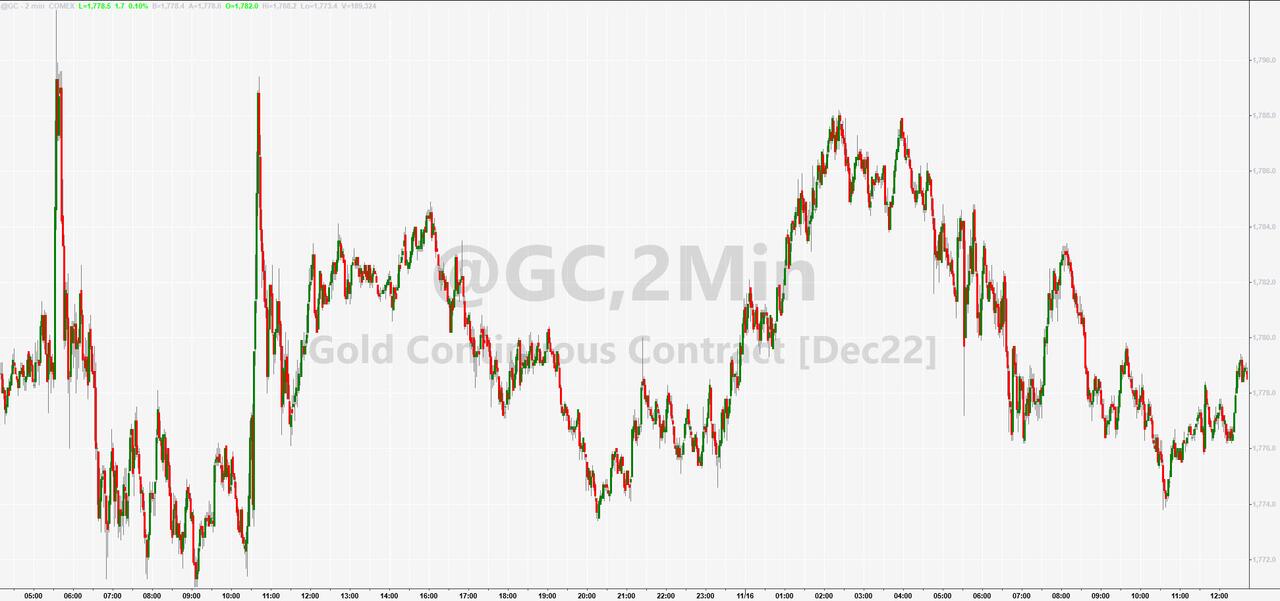
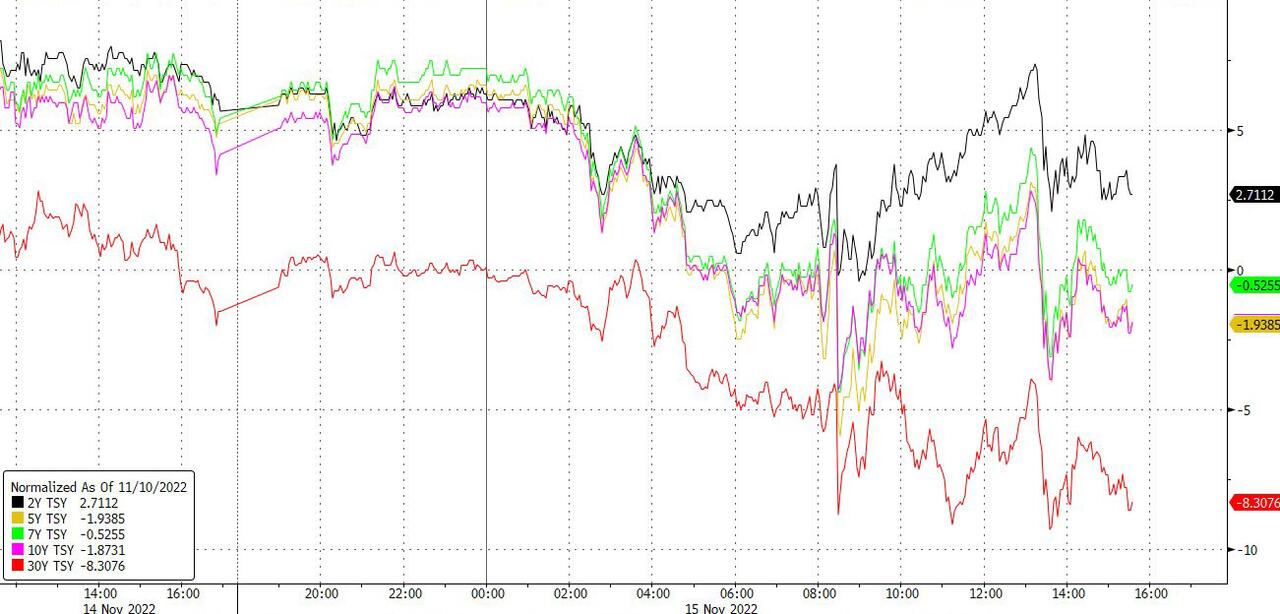
With the exception of the 2-year, bond yields fell and pulled the 10-year down by 8bps to end the day at 3.695%. The US Dollar was flat and so was gold, which is strongly correlated to it, i.e., if the dollar drops, gold rallies and vice versa.

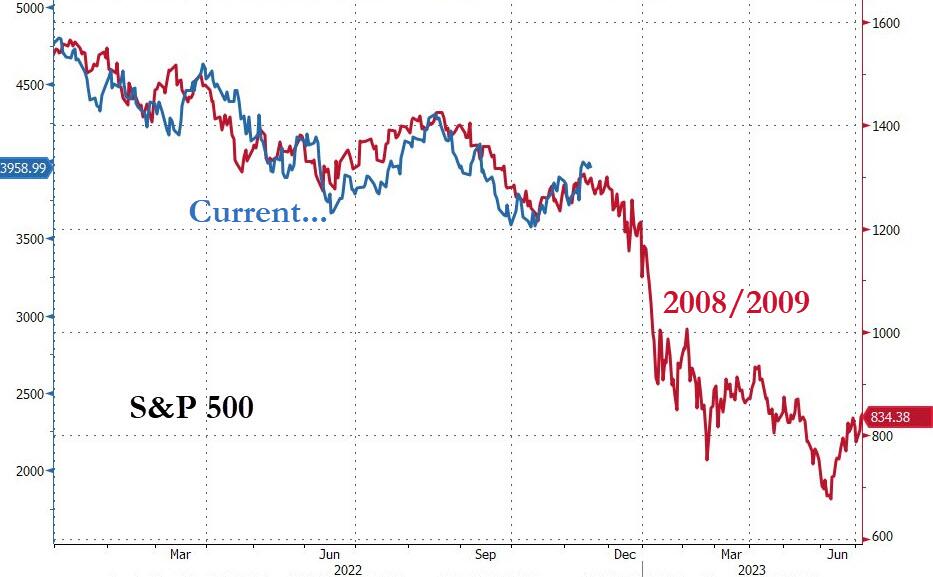
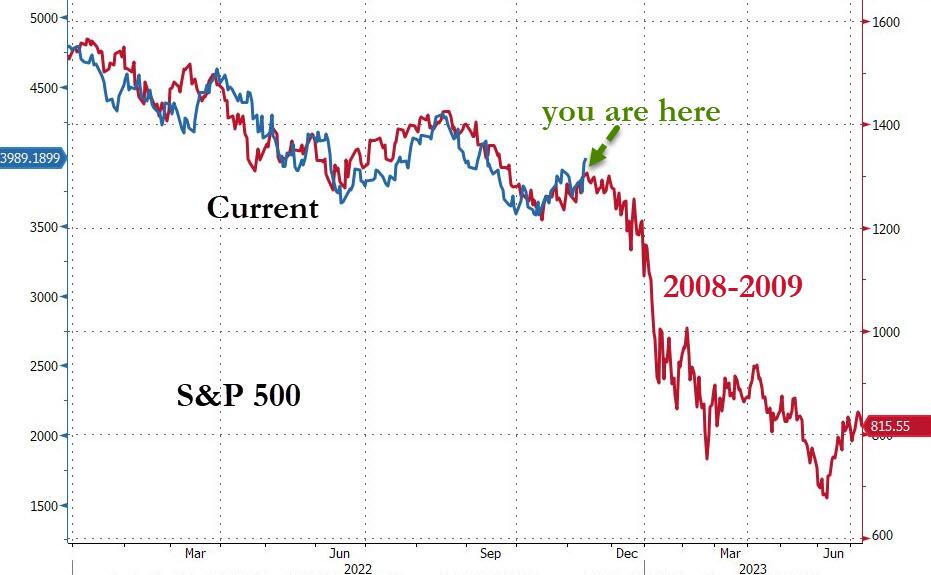
To review where we are in historical context, here is the latest update of the 2008/2009 analog.  

Read More

A “Welcoming” PPI Report Supports Equities

Ulli Market Commentary Contact

[Chart courtesy of MarketWatch.com]

  1. Moving the markets

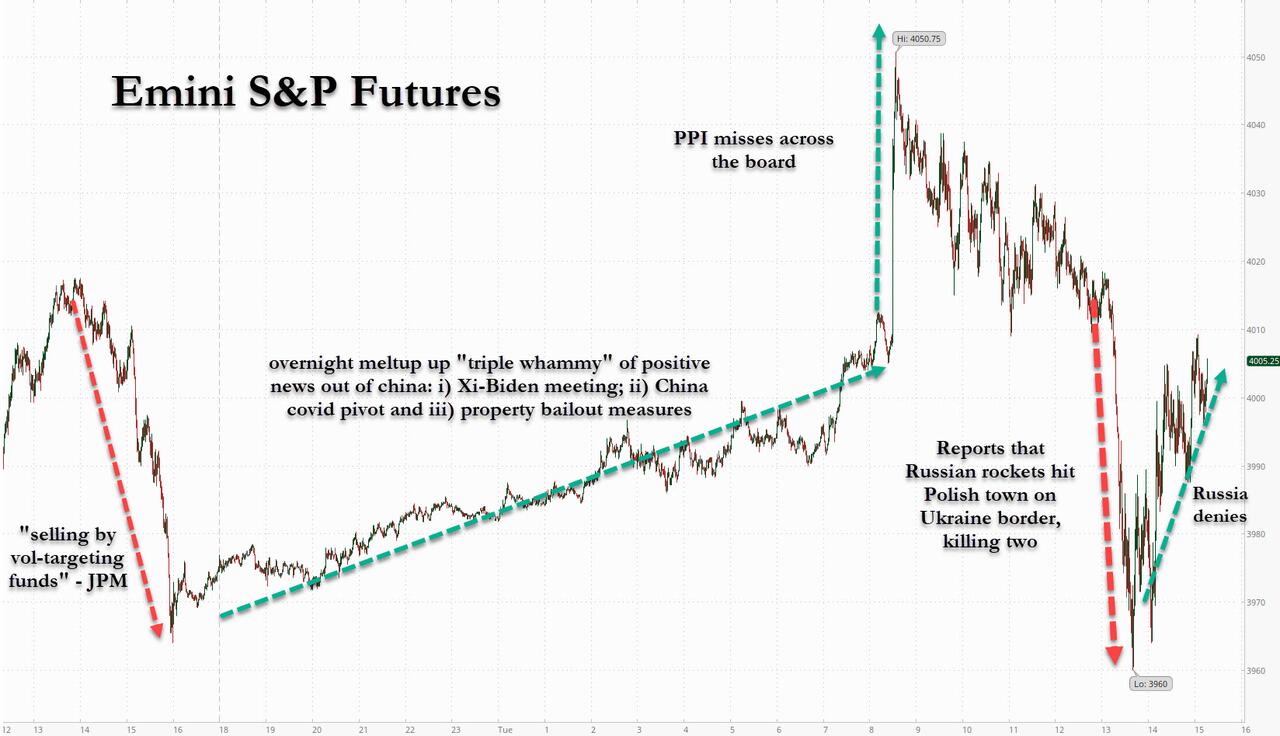
Today’s Producer Price Index (PPI) came in better than expected with CNBC highlighting the data as follows:

  • The producer price index rose 0.2% in October, below the 0.4% estimate.
  • A significant contributor to the slowdown in wholesale inflation was a 0.1% decline in services, the first outright decline in that measure since November 2020.
  • On a year-over-year basis, PPI rose 8% compared to an 8.4% increase in September.

Still, an “only” 8% YoY increase is hardly anything to get excited about, but algos and traders are living in their own world, in which it’s a foregone conclusion that we have seen peak interest rates and peak inflation, both of which are now believed to be on a downward trajectory.

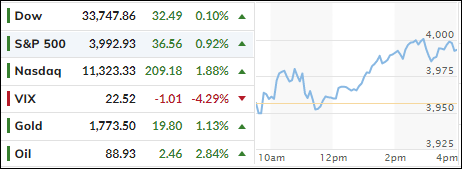
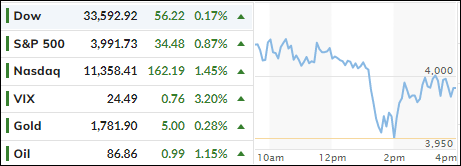
As a result, the data were seen as a positive with the markets scoring a green close despite a sharp mid-day sell off, which pulled the major indexes off their morning highs with the rollercoaster ride continuing.

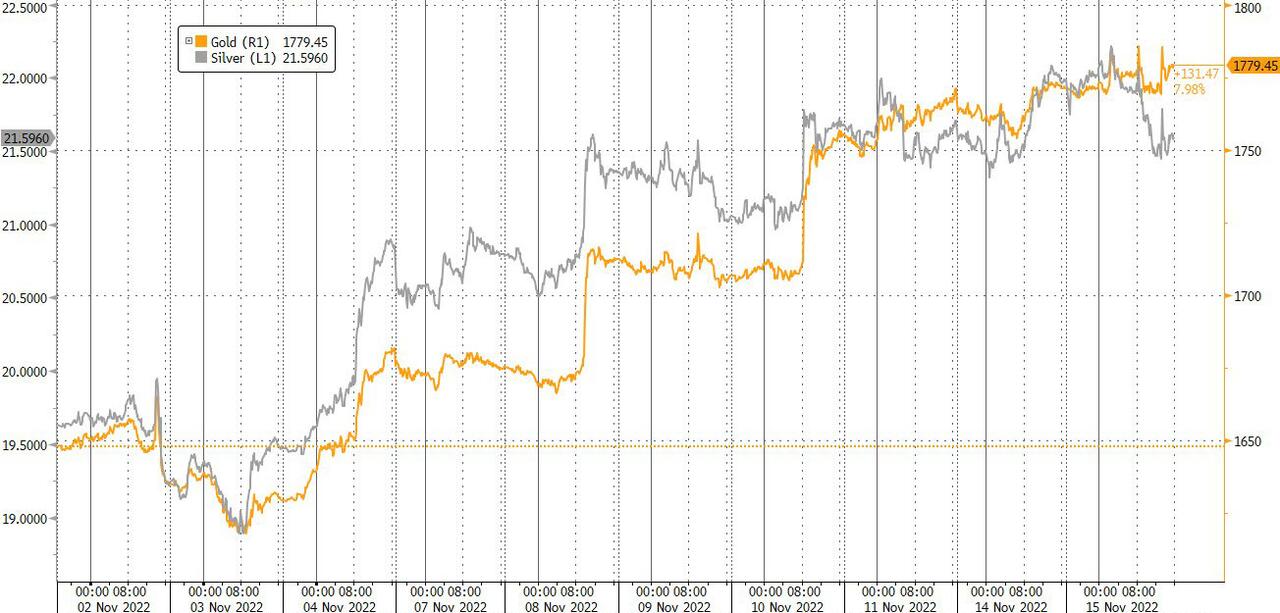
Bond yields meandered throughout the session with the 10-year losing 9bps to close at 3.77%, well below its much-fought over 4% level. The US Dollar continued its slide thereby supporting gold, which advanced again and is now within striking distance of regaining its $1,800 level.

Our main directional indicator, the Domestic Trend Tracking Index (TTI) has now remained above its long-term trend line for the 4th straight day. However, there has not been much follow through to the upside, so the TTI is only a modest sell-off away from breaking back below its dividing line between bullish and bearish territory.

I like to see more staying power and upside momentum before issuing a new “Buy” signal for that arena.

Read More

Taking A Breather

Ulli Market Commentary Contact

[Chart courtesy of MarketWatch.com]

  1. Moving the markets

After last week’s Ramp-A-Thon, equities needed a breather. Even though the major indexes held up well throughout the session by bouncing around their respective unchanged lines, momentum waned during the last hour and south we went.

Given the advances of the past five trading days, a pause was in order, and that’s exactly what developed this afternoon. The question now remains if traders’ sentiment is bullish enough to build on recent gains to sustain upward momentum—even at a slower pace— during this seasonally strongest period of the year before the reality of fragile earnings sets in come 2023.

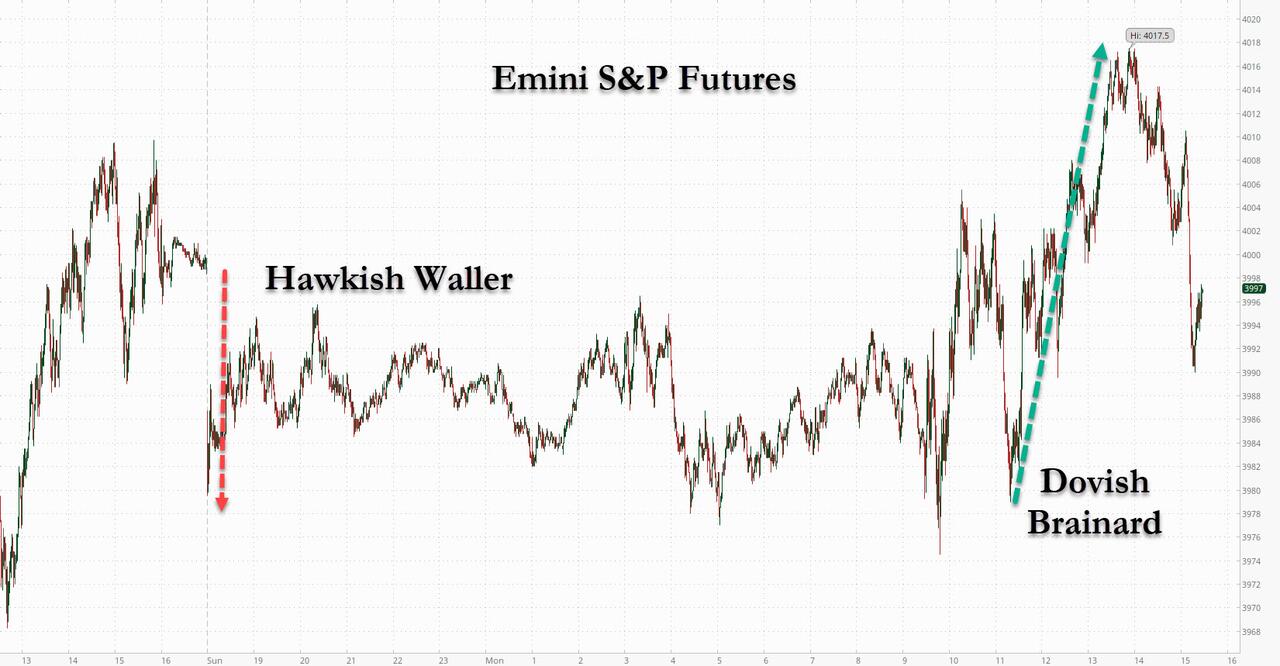
Two dovish and hawkish messages by a couple of Fed mouth pieces cancelled each other out but caused some whipsaws during the session with the S&P being unable to hang on to its $4k level.

Bond yields went sideways, the US Dollar was flat, but gold managed to score a +0.33% gain and kept inching closer to its $1,800 level.

The S&P is now 3.03% away from breaching its widely watched 200-day M/A, a key resistance level which, if broken to the upside, could give technical traders encouragement that the rally will continue, as third quarter earnings season moves into its 9th inning.

Read More

ETFs On The Cutline – Updated Through 11/11/2022

Ulli ETFs on the Cutline Contact

Below, please find the latest High-Volume ETF Cutline report, which shows how far above or below their respective long-term trend lines (39-week SMA) my currently tracked ETFs are positioned.

This report covers the HV ETF Master List from Thursday’s StatSheet and includes 312 High Volume ETFs, defined as those with an average daily volume of more than $5 million, of which currently 127 (last week 44) are hovering in bullish territory. The yellow line separates those ETFs that are positioned above their trend line (%M/A) from those that have dropped below it.

Take a look:                                                                   

The HV ETF Master Cutline Report

In case you are not familiar with some of the terminology used in the reports, please read the Glossary of Terms. If you missed the original post about the Cutline approach, you can read it here.

ETF Tracker Newsletter For November 11, 2022

Ulli ETF Tracker Contact

ETF Tracker StatSheet          

You can view the latest version here.

S&P 500 SCORES ITS BEST WEEK SINCE JUNE

[Chart courtesy of MarketWatch.com]

  1. Moving the markets

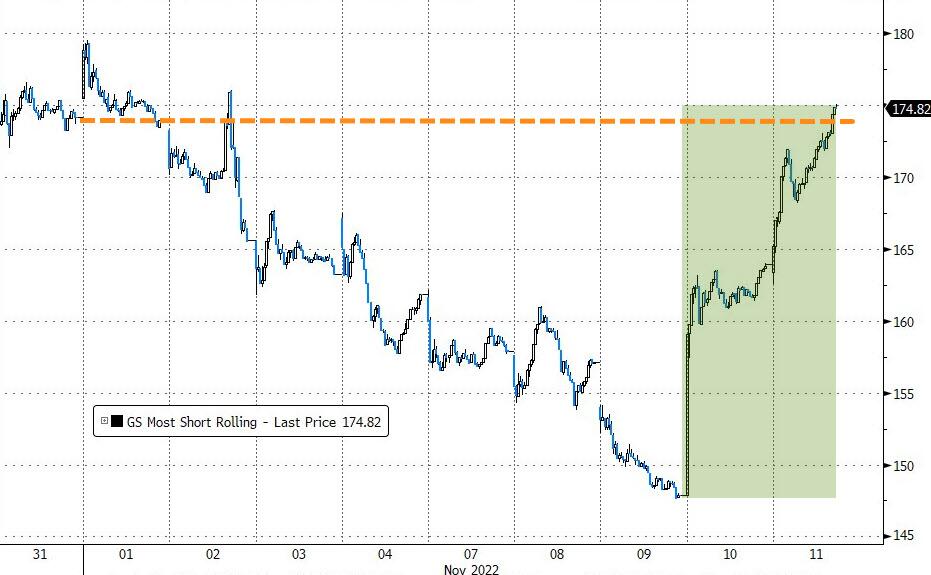
After yesterday’s euphoric reaction to the better-than-expected CPI report, bullish momentum prevailed throughout the session, despite the bond market being closed on this Veteran’s Day. But the short squeeze was alive and well and contributed to another positive ending.

Again, hopes that the Fed would be slowing its interest rate hikes, and therefore supporting equities, was the main driver for the S&P scoring its best week since the June rebound. However, that one ended in a bearish disaster only two months later when the index’s 200-day M/A turned out to be the reversal point to new yearly lows.

This scenario seems to be repeating itself, as the S&P 500 is only 2.16% away from a second attempt to break through that resistance level. If it’s successful, I could see more upside potential. However, if the 200-day M/A turns out to be another impenetrable overhead ceiling, this feel-good CPI rebound may bite the dust.

The future for a sustainable rally in equities lies with the Fed and its intentions not only how high they might hike but also for how long. Despite Fed head Powell and its various mouthpieces spewing nothing but hawkish comments, the Wall Street crowd remains convinced that a pause or a pivot is on deck, hence the frontrunning efforts.

Today, it was Boston Fed President Susan Collins, who uttered these words:

  • I think that as we have raised rates that the risk of over tightening has increased.
  • I do think we’re going to need to raise rates further.
  • A smaller, more “deliberate” rate increase should not be confused for a sign that the Fed is backing down from the task of curbing price pressures.

To me, that does not sound like a Fed that is about to pivot…

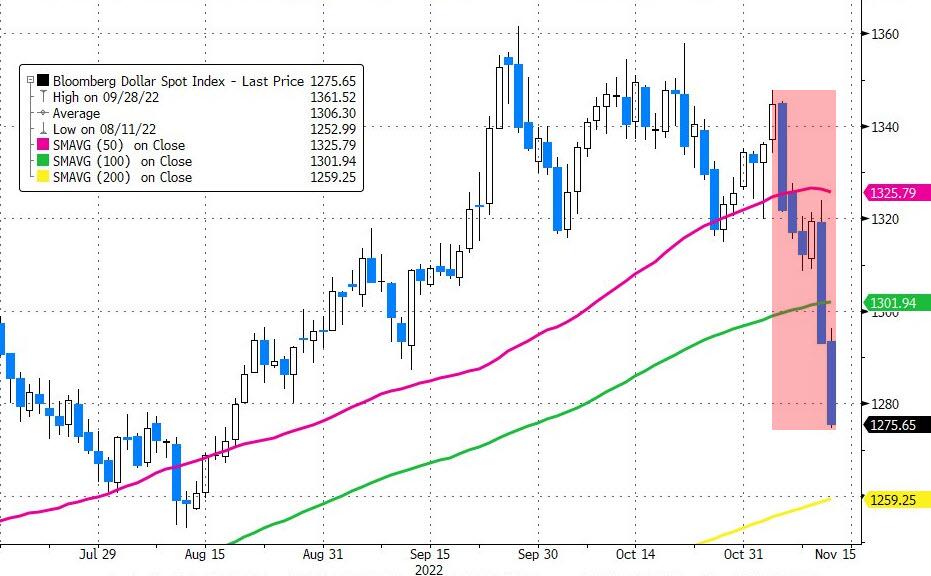
The US Dollar spanking continued, as ZeroHedge reported, with the world’s reserve currency down 5 of the last 6 days. It has lost 5% against its fiat peers and has broken its 50- and 100-day M/As on its way to 3-month lows.

Gold was the beneficiary and closed at $1,770, its highest in 3 months while scoring its best week since March 2020.

According to this analog, we are still in a bear market rally, although my Domestic Trend Tracking Index (TTI-section 3) has crossed its trend line into bullish territory. We should see more clarity next week—in one way or another.

Read More