Rebounding From A Crisis

Ulli Market Commentary Contact

[Chart courtesy of MarketWatch.com]

  1. Moving the markets

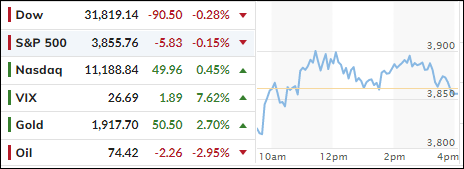
Traders were relieved that risk of contagion to other banks appears to have been contained, at least for the time being. I think there is more to come, since additional cockroaches are likely to be hidden and will eventually surface.

The major indexes rallied, dumped, and rebounded to score a green close with the Dow snapping a five-day losing streak. As I pointed out yesterday, the Fed and its cohorts pulled the emergency brake by promising to backstop ALL depositors in the two failed banks.

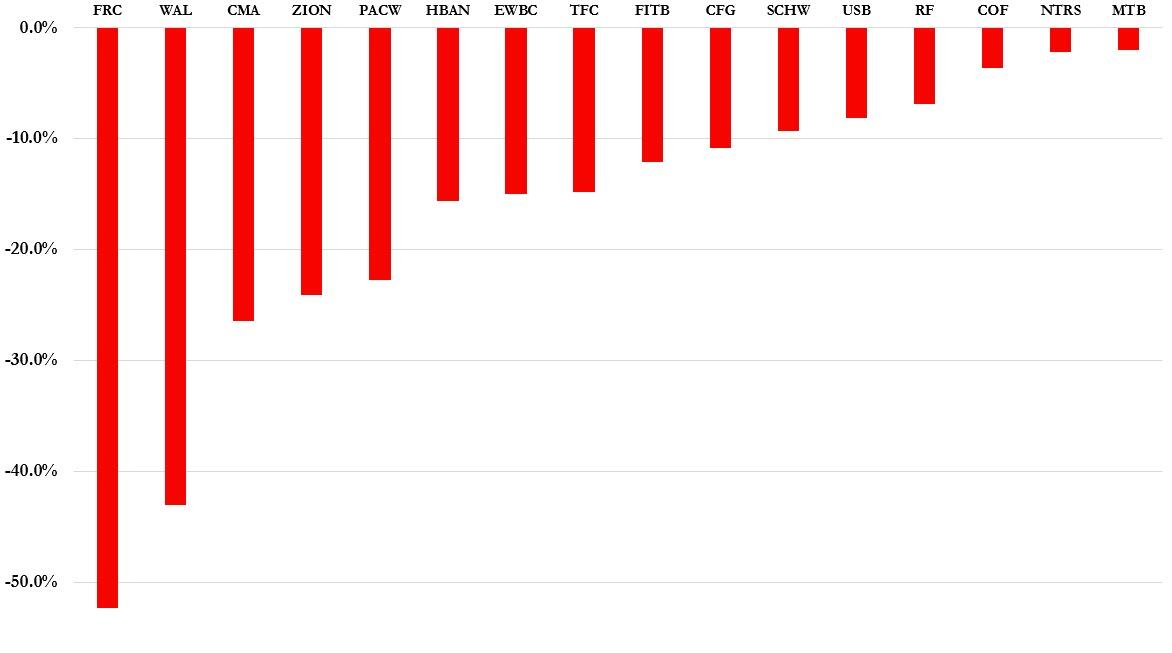
As a result, small banks soared after many of them losing some 50% during yesterday’s chaotic session. On the other hand, depositors withdrew their funds from those institutions as fast as they could and inundated large banks, which are considered to be of the “too large to fail” category.

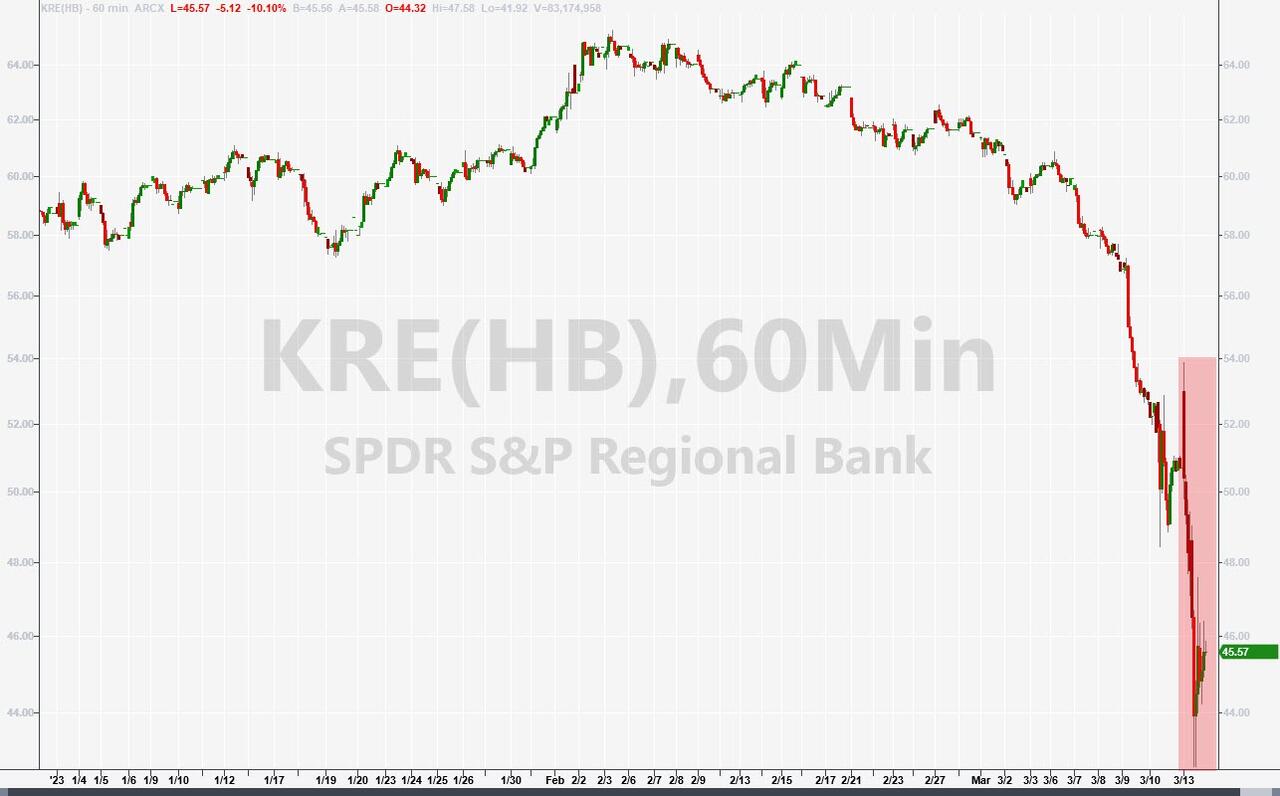
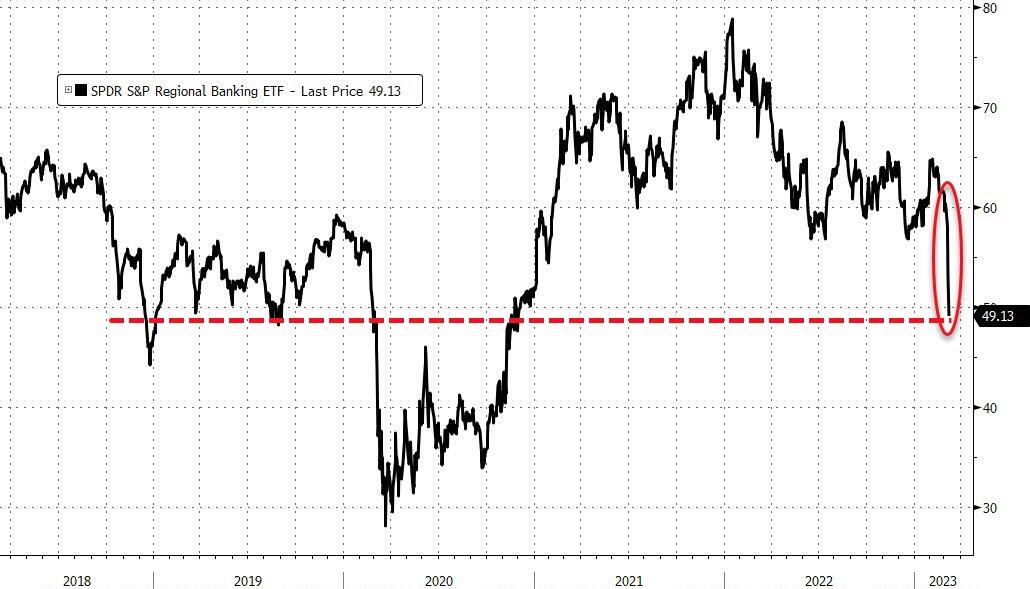
In other words, small banks are losing deposits quickly, which ultimately may have the same effect as we’ve seen with the now defunct SVB. Still, the regional banking index KRE rebounded 2% after having dropped 12% yesterday.

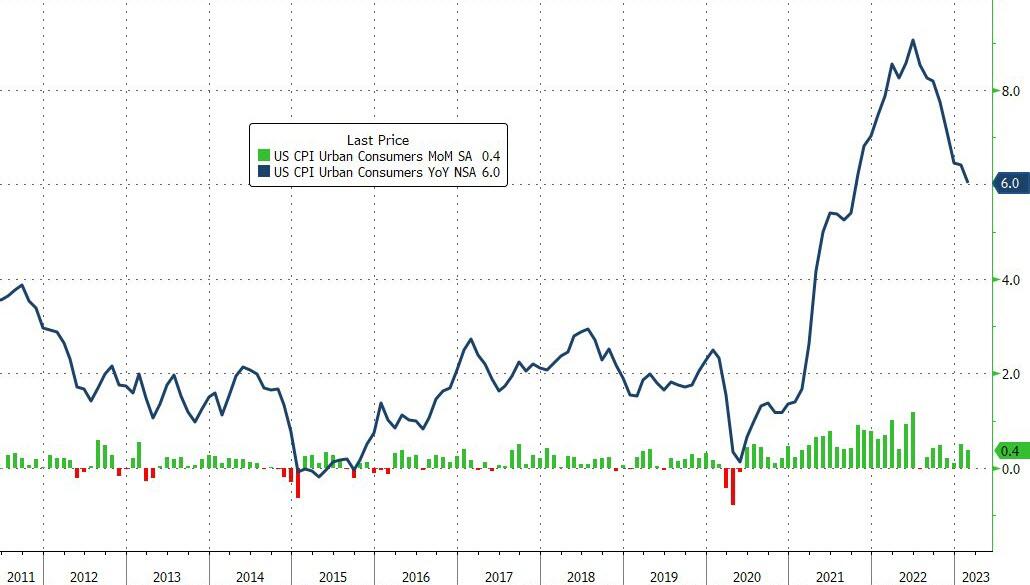
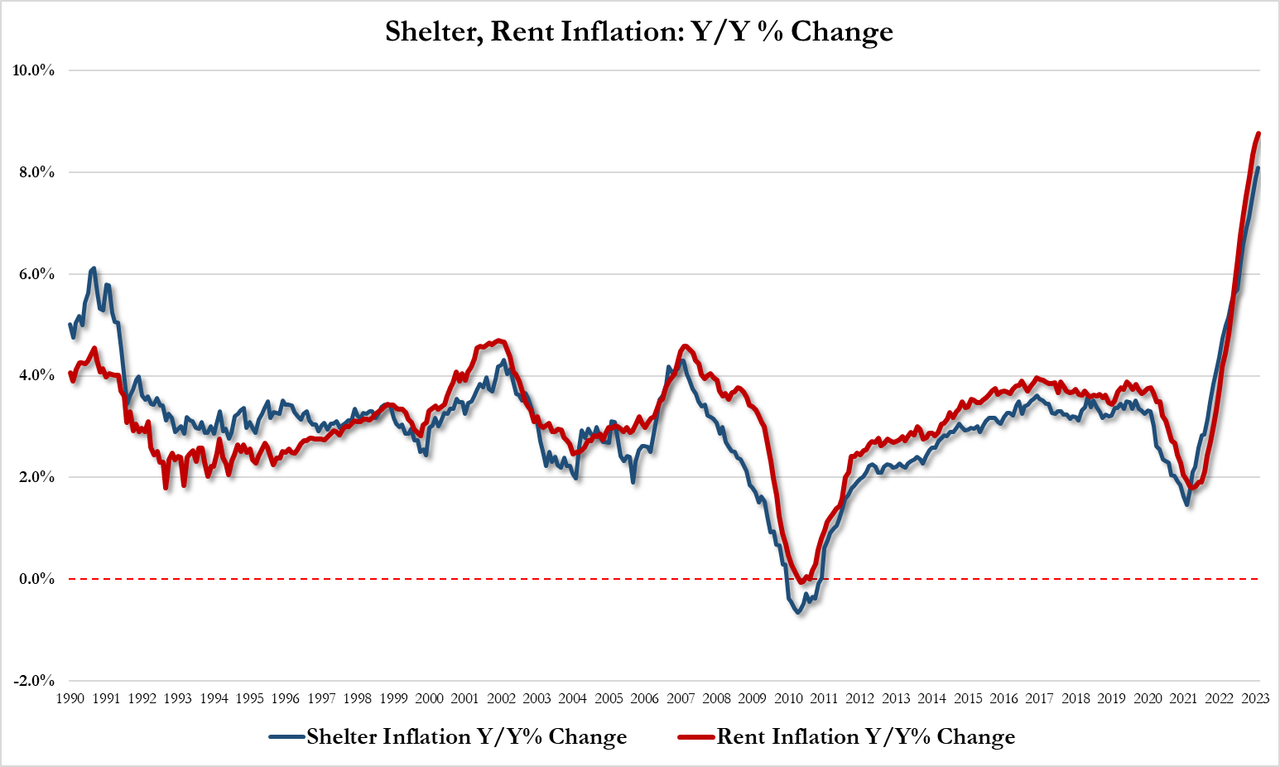
What used to be one of the most eagerly expected numbers, namely the CPI, almost moved to the backburner in view of the banking crisis. The headline CPI came in as expected (+0.4% MoM, +6.0% YoY), which is the lowest YoY reading since September 2021. The only worsening numbers were those of Shelter and Rent inflation, which printed +8.10% YoY and +8.76% YoY respectively, both of which were the highest on record.

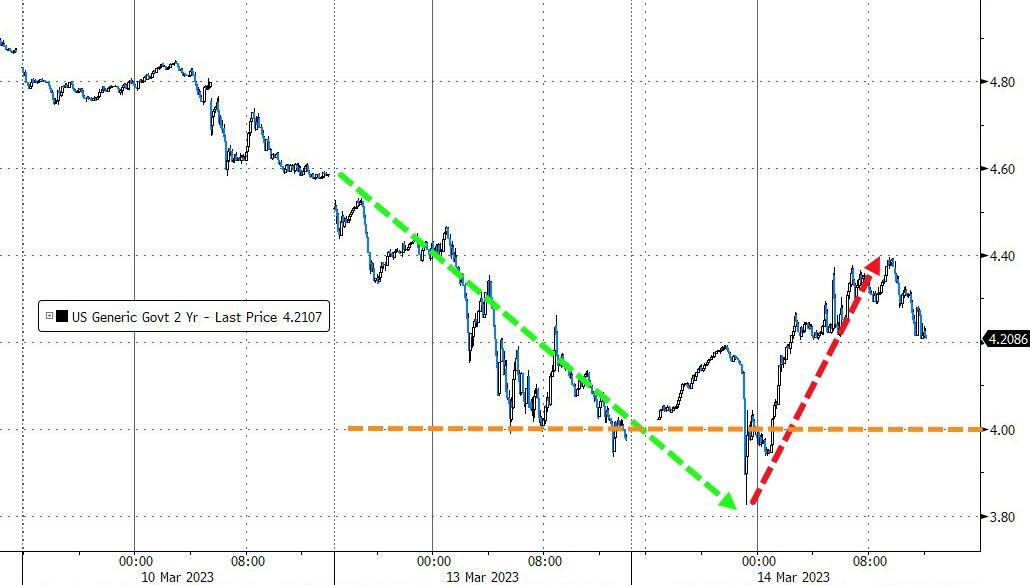
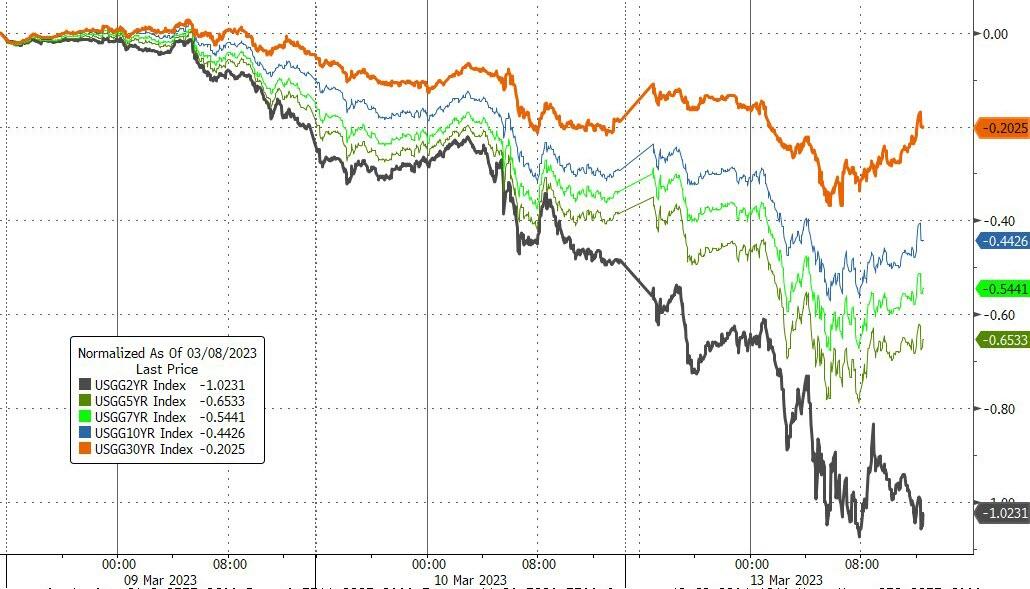
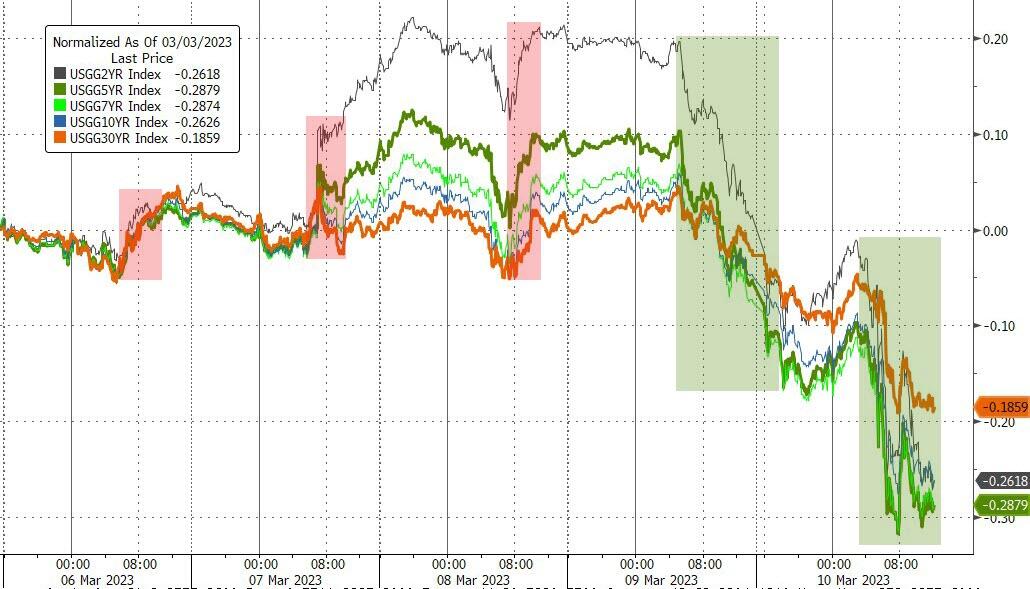
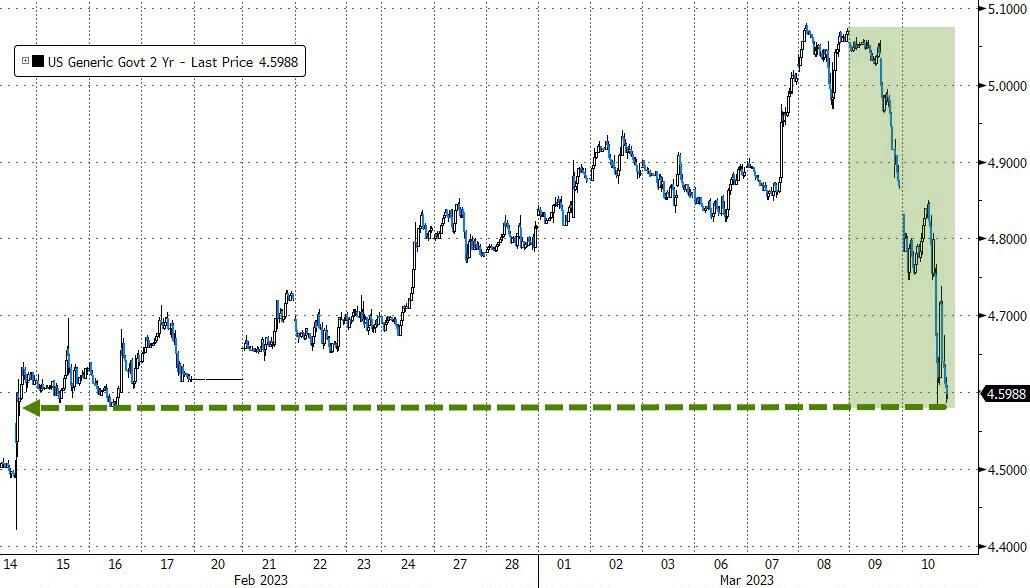
Bond yields snapped back today, with the 2-year making the most noise. After collapsing 60bps yesterday, the yield popped some 40bps ending the session at 4.2%.

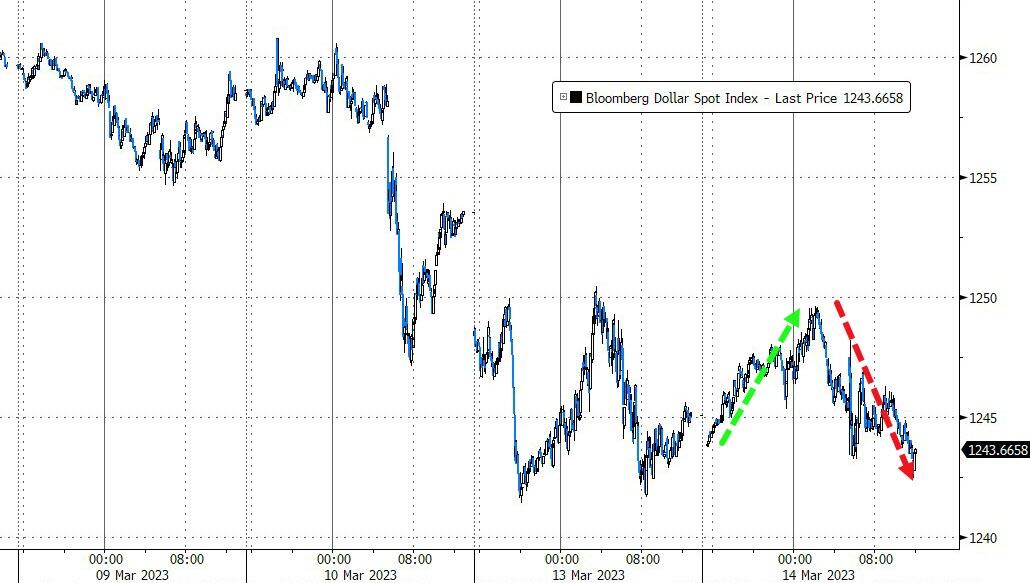
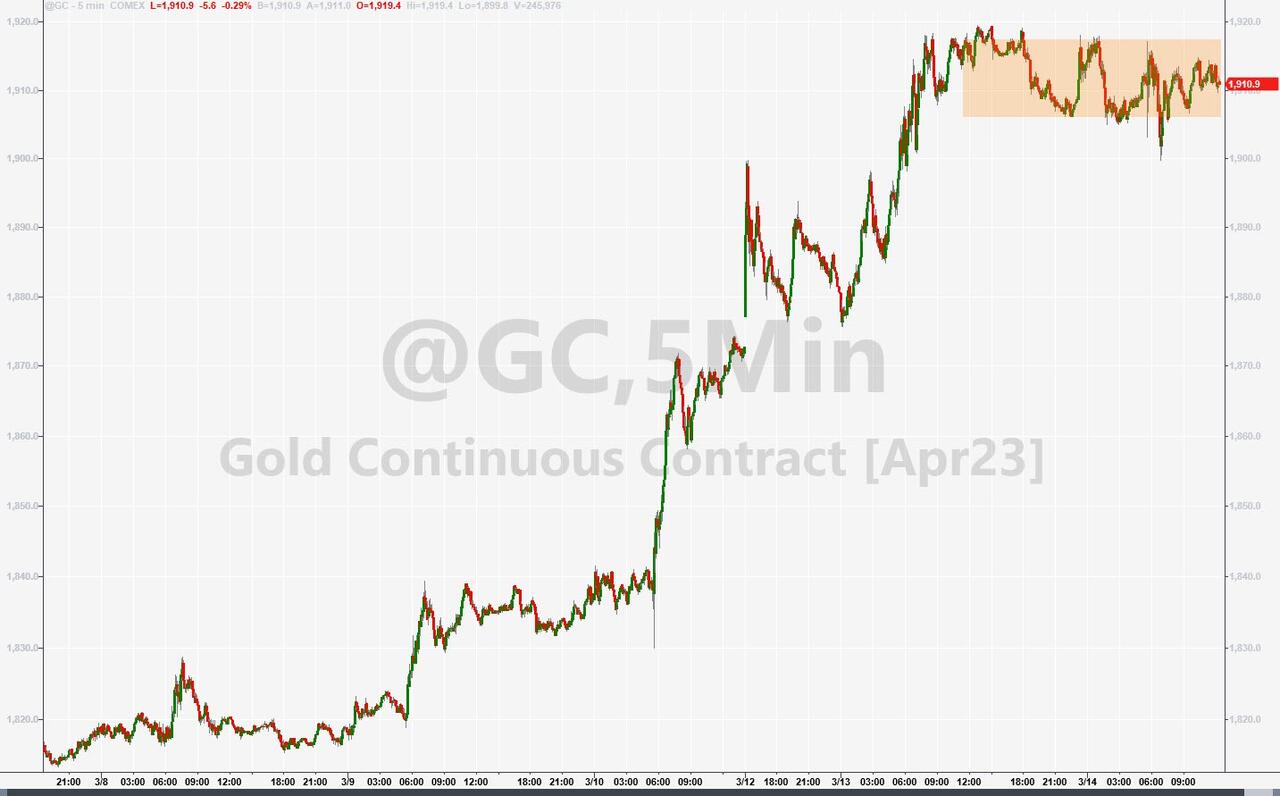
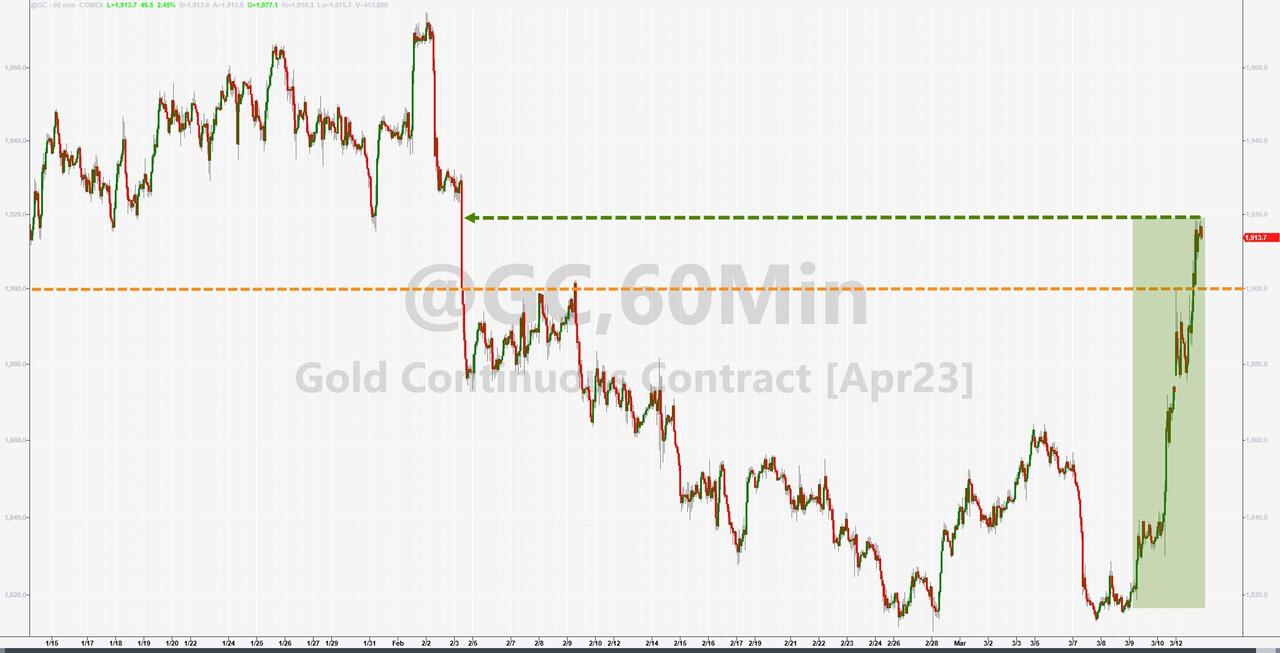
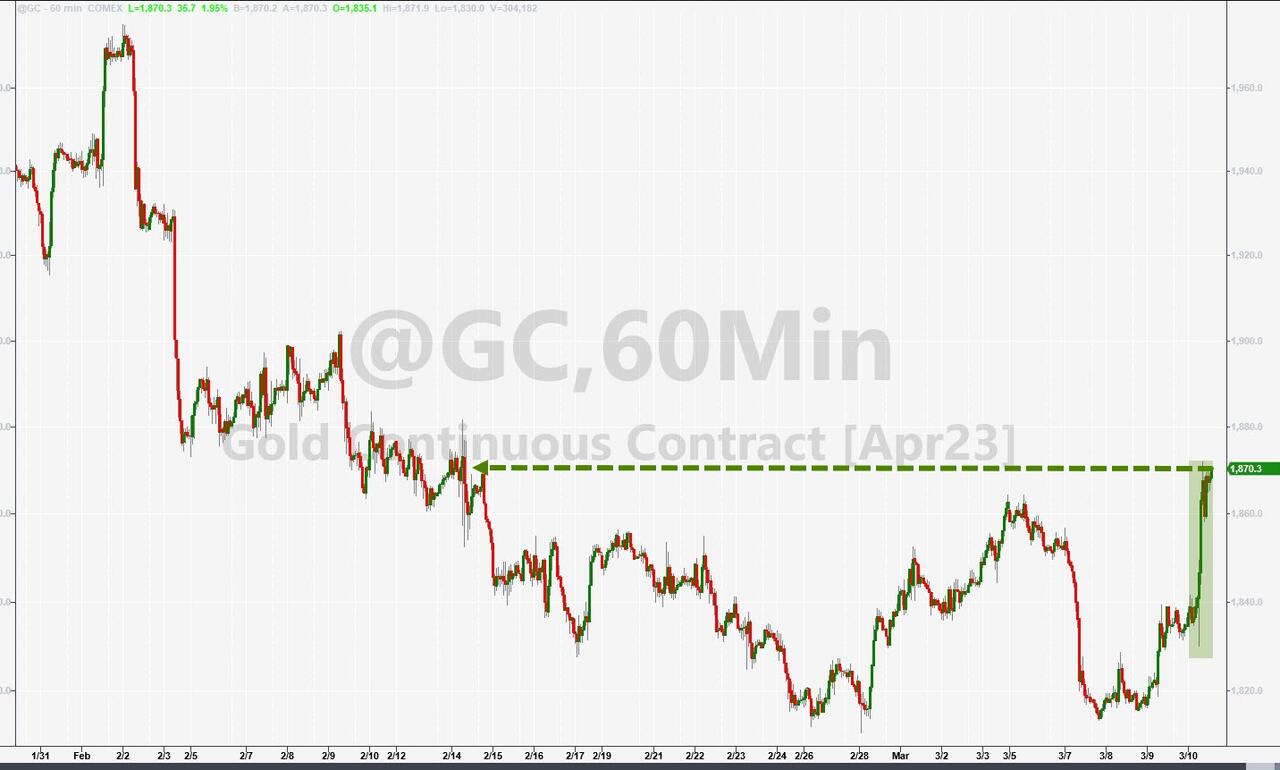
The US Dollar rode the rollercoaster and closed at the unchanged level. Gold took a breather after its recent Ramp-A-Thon, chopped aimlessly but held on to its $1,900 level.

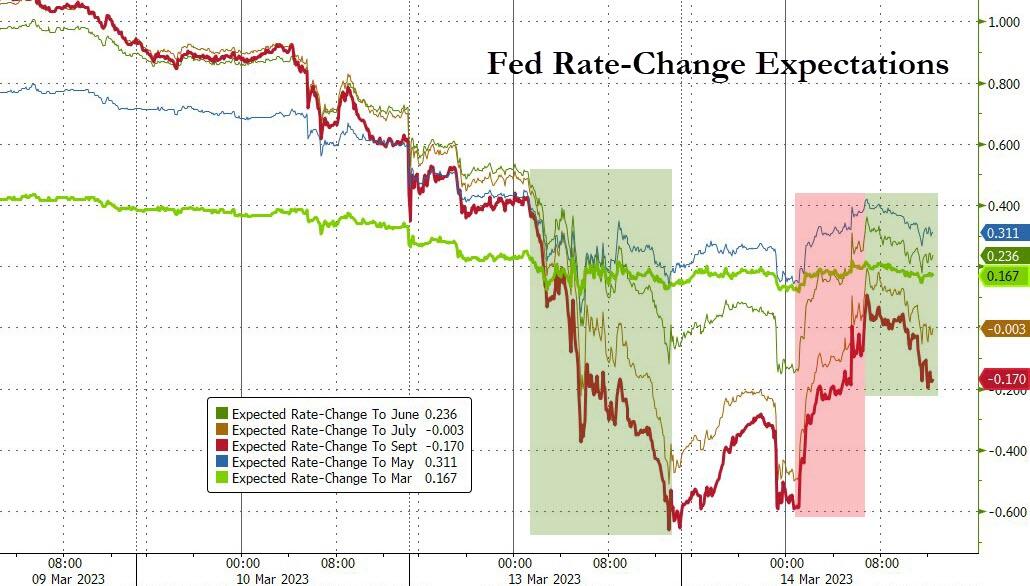
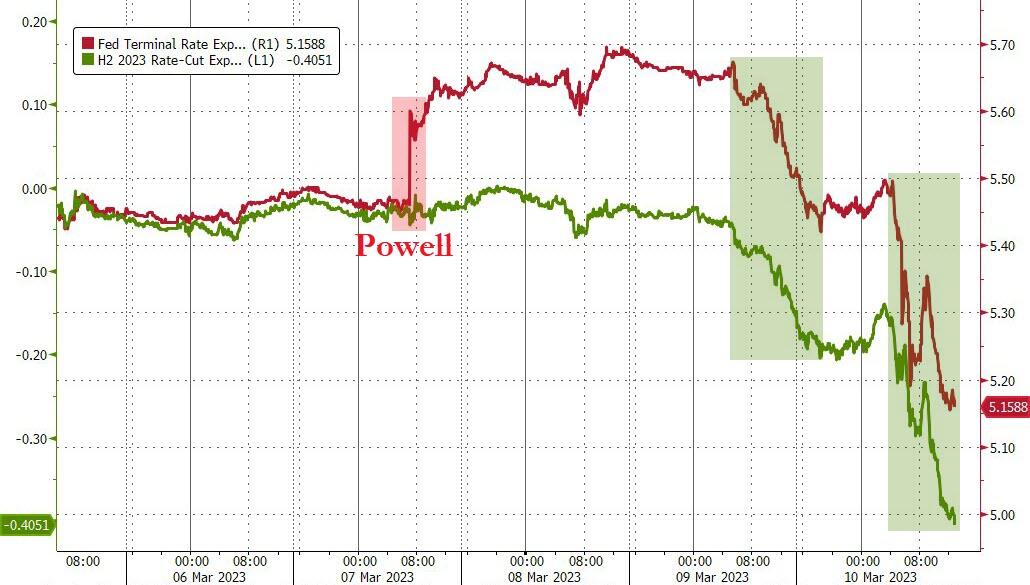
The Fed’s rate trajectory expectations swung wildly, as ZeroHedge pointed out, which means uncertainty about the Fed’s next move reigns supreme. Consensus calls for a 25bps hike when they meet next week.

If they don’t hike, and instead pause, traders will see this as an indication that the Fed has blinked or folded, and a new bull market will likely be on deck.   

Read More
A Bailout In Progress

Ulli Market Commentary Contact

[Chart courtesy of MarketWatch.com]

  1. Moving the markets

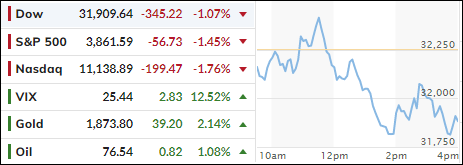
Apparently, Fed head Powell, Treasury Secretary Yellen and the head of the FDIC must have been in panic mode, as they combined forces by announcing (on Sunday) a plan that would backstop ALL depositors in the failed Silicon Valley Bank, while concurrently making additional funding available for other banks. Regional banks are not looking too good given their current losses, as well as the status of their regional bank index KRE.

The joint statement also assured depositors that they would have access to their money as of today. This action was the equivalent of pulling the cord for the backup parachute, as the domino effect of citizens withdrawing their funds would have accelerated with lightning speed.  

As a result, bond yields plunged and equity indexes, while up solidly in overnight trading, seesawed and ended the session close to their respective unchanged lines. This emergency action does not mean this crisis has been resolved, no, it has been merely halted, as the Fed is trying to ascertain, if other banks are experiencing a similar liquidity shortage (spoiler alert: yes, there are many more cockroaches).

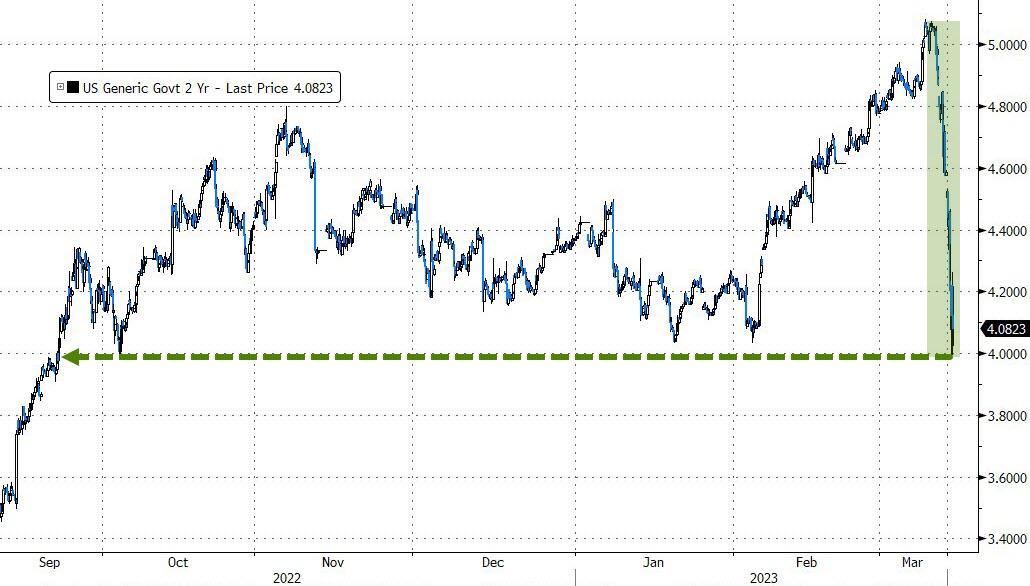
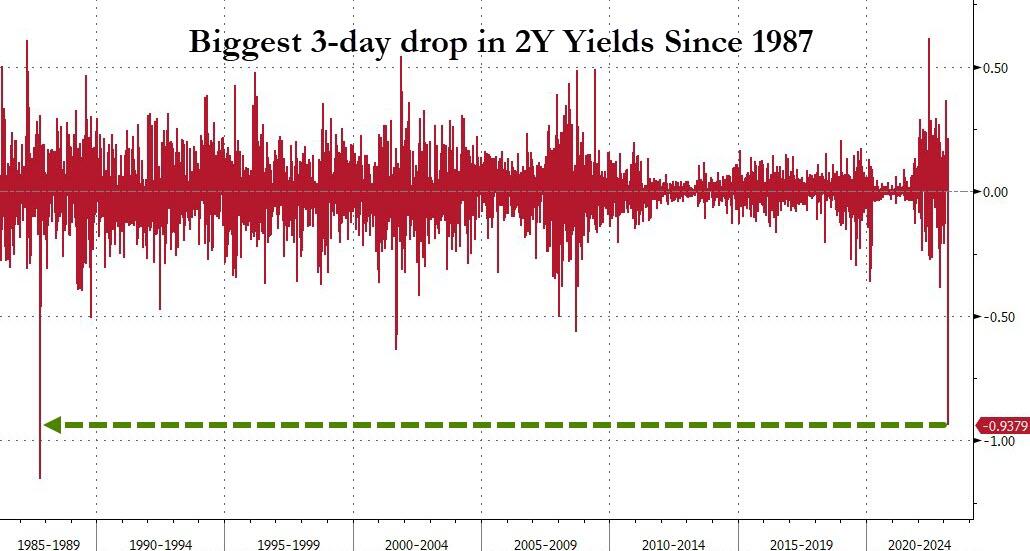
ZeroHedge highlighted that the 2-year yield plunged almost 100bps in the last three days to below 4%, which was its lowest since September 2022. This three-day drop in yield has been the biggest since “Black Monday” in 1987. Hmm…

Looking at the big picture, this event could very well mean the end of the Fed’s aggressive stance on interest rates, as rate hike expectations dropped sharply. The question remains now: “will they hike 0.25% at their next meeting, or will they pause?” For sure, the 0.5% hike option just died over the weekend.

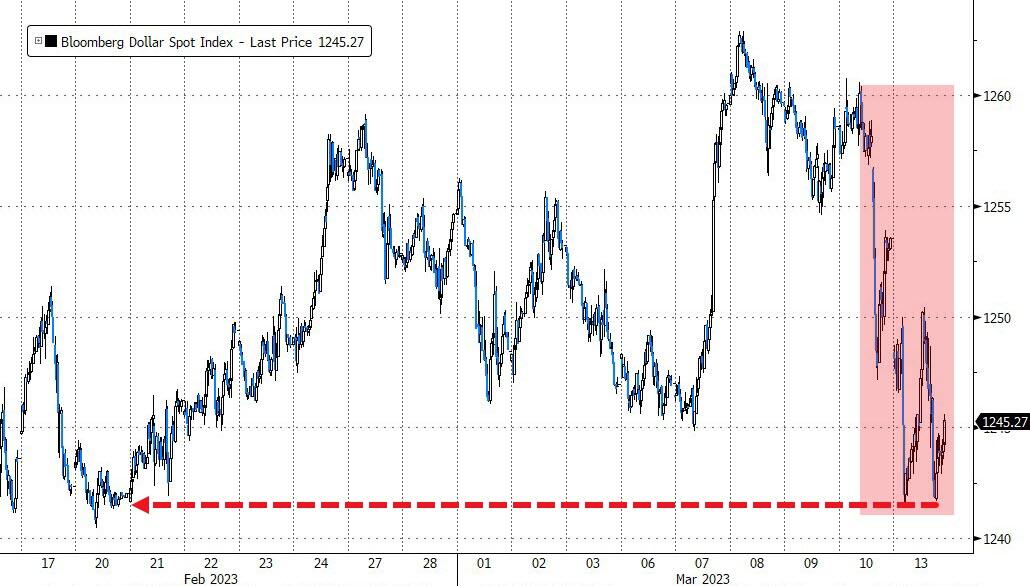
The US Dollar declined to three-week lows and, as you might expect in times of stress and uncertainty, Gold spiked above $1,900, a move of +2.66% for the day.

The fireworks are far from being over with the CPI, US retails sales, PPI, and housing data all on deck and waiting to make their mark on the markets.

Read More
ETFs On The Cutline – Updated Through 03/10/2023

Ulli ETFs on the Cutline Contact

Below, please find the latest High-Volume ETF Cutline report, which shows how far above or below their respective long-term trend lines (39-week SMA) my currently tracked ETFs are positioned.

This report covers the HV ETF Master List from Thursday’s StatSheet and includes 312 High Volume ETFs, defined as those with an average daily volume of more than $5 million, of which currently 93 (last report: 213) are hovering in bullish territory. The yellow line separates those ETFs that are positioned above their trend line (%M/A) from those that have dropped below it.

Take a look:                                                                   

The HV ETF Master Cutline Report

In case you are not familiar with some of the terminology used in the reports, please read the Glossary of Terms. If you missed the original post about the Cutline approach, you can read it here.      

ETF Tracker Newsletter For March 10, 2023

Ulli ETF Tracker Contact

ETF Tracker StatSheet          

You can view the latest version here.

CHAOS IN THE MARKETS

[Chart courtesy of MarketWatch.com]

  1. Moving the markets

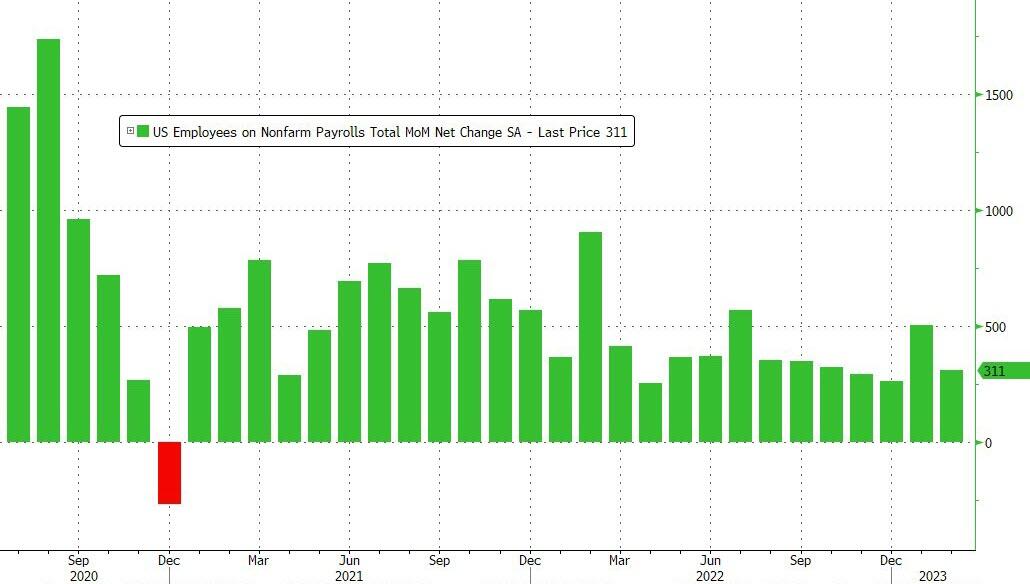
February payrolls came in hotter than expected, which put the markets under pressure after the opening bell rang. 311k jobs were created, well above the consensus of 225k and higher than the hoped-for whisper number of 250k.

Offsetting the idea that good economic news is bad news for the markets was the fact that wage gains were smaller than anticipated, which created hope that the Fed might rethink its aggressive stance on rate hikes. At least that’s what the markets now expect with the terminal rate tumbling 40bps today.

However, the payroll report was quickly pushed to the back burner, as far more pressing events permeated the markets. Yesterday’s troubles at Silicon Valley Bank (SVIB) accelerated, and the FDIC shuttered the bank and appointed a receiver, after depositors had frantically pulled out their money.

ZeroHedge highlighted the events like this:

  • *FDIC: SVB BANK CLOSED BY CALIFORNIA REGULATOR
  • *FDIC: SVB BANK IS FIRST INSURED INSTITUTION TO FAIL THIS YEAR
  • *FDIC CREATES A DEPOSIT INSURANCE NATIONAL BANK OF SANTA CLARA
  • *FDIC: NAMED FEDERAL DEPOSIT INSURANCE FDIC AS RECEIVER
  • *FDIC CREATES A DEPOSIT INSURANCE NATIONAL BANK OF SANTA CLARA
  • *SILICON VALLEY BANK INSURED DEPOSITORS TO HAVE ACCESS MONDAY

The FDIC also noted that SVIB had $175 billion in deposits and pointed out that some $151 billion of those are uninsured. So, if you left our funds in there, you are out of luck and will likely receive zero. Ouch!

The question on traders’ minds is “who’s next?” After all, there is never only one cockroach in a house…

Regional banks tumbled with the banking ETF dropping more 18% this week, while some bank stocks were repeated halted during Friday’s session.

Bond yields dropped sharply, when the flight out of risk assets to the alleged safety of bonds accelerated. Midday, the 2year yield had plunged an amazing 50bps from yesterday’s close, which was the biggest 2-day drop since September 2008.

To no surprise, the biggest winner of the day was Gold, as the precious metal gained 2.14% for the day.

In the end, this was the worst week for stocks in 2023 with the major indexes surrendering over 4%, while SmallCaps took top billing by collapsing 9%.

Read More

Weekly StatSheet For The ETF Tracker Newsletter – Updated Through 03/09/2023

Ulli ETF StatSheet Contact

ETF Data updated through Thursday, March 9, 2023

Methodology/Use of this StatSheet:

1. From the universe of over 1,800 ETFs, I have selected only those with a trading volume of over $5 million per day (HV ETFs), so that liquidity and a small bid/ask spread are assured.

2. Trend Tracking Indexes (TTIs)

Buy or Sell decisions for Domestic and International ETFs (section 1 and 2), are made based on the respective TTI and its position either above or below its long-term M/A (Moving Average). A crossing of the trend line from below accompanied by some staying power above constitutes a “Buy” signal. Conversely, a clear break below the line constitutes a “Sell” signal. Additionally, I use a 12% trailing stop loss on all positions in these categories to control downside risk.

3. All other investment arenas do not have a TTI and should be traded based on the position of the individual ETF relative to its own respective trend line (%M/A). That’s why those signals are referred to as a “Selective Buy.” In other words, if an ETF crosses its own trendline to the upside, a “Buy” signal is generated. Here too, I recommend trailing sell stop of 12%, or less, depending on your risk tolerance.

If you are unfamiliar with some of the terminology, please see Glossary of Terms and new subscriber information in section 9.     

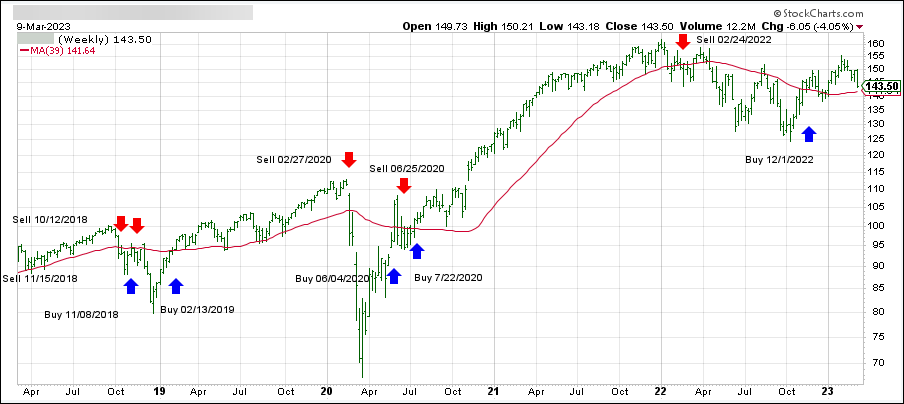
1. DOMESTIC EQUITY ETFs: BUY — since 12/01/2022

Click on chart to enlarge

Our main directional indicator, the Domestic Trend Tracking Index (TTI-green line in the above chart) has reclaimed its long-term trend line (red) by +1.40% and remains in “Buy” mode for the time being.

Read More
Getting Hammered

Ulli Uncategorized Contact

[Chart courtesy of MarketWatch.com]

  1. Moving the markets

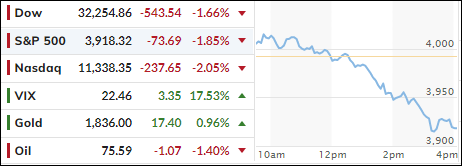
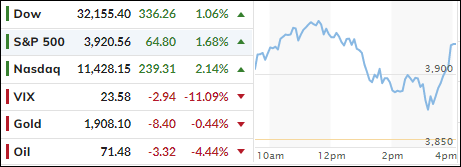
After a brief sprint above their respective unchanged lines, the major indexes reversed and hit the skids, with the Dow dumping over 500 points for the second time this week, as traders braced for tomorrow’s payroll report.

Remember that good news is bad news, which means a better-than-expected payroll print directly translates into the Fed pursuing their hawkish monetary policy, and that will result in lower equity prices.

Jobless claims for the week rose more than expected, a sign that the Labor market may be slowing, but yesterday’s ADP payroll report and JOLTS data painted a picture of economic strength. Some traders expect that this tie could be broken with tomorrow’s payroll numbers.

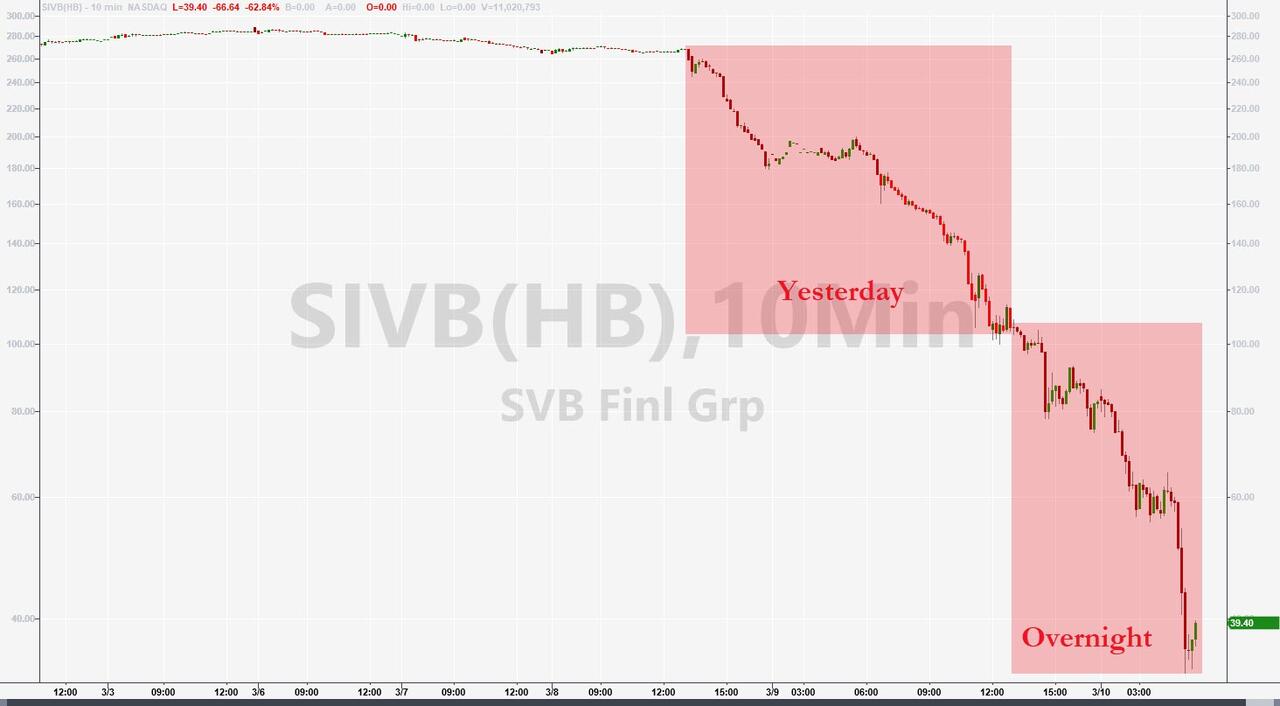
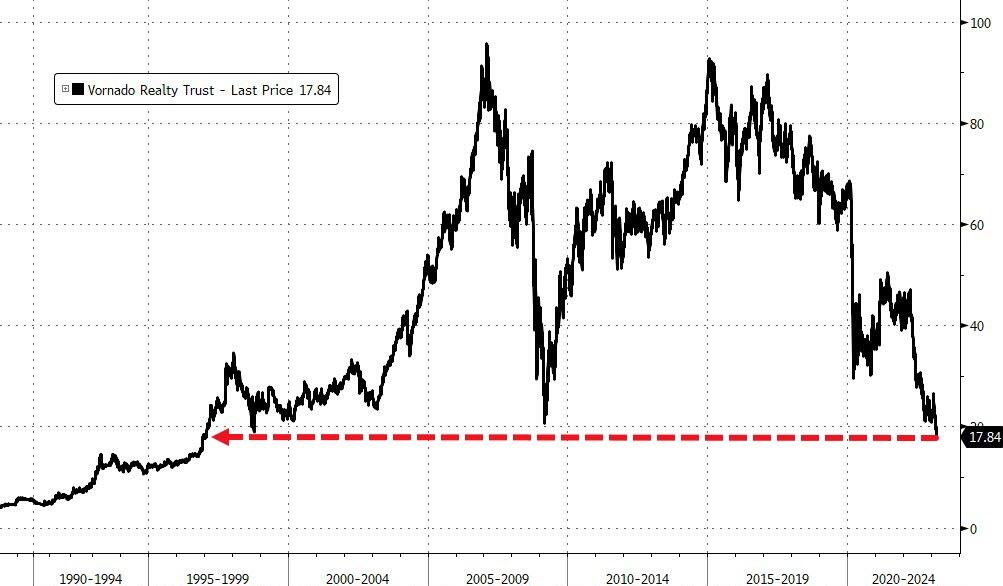
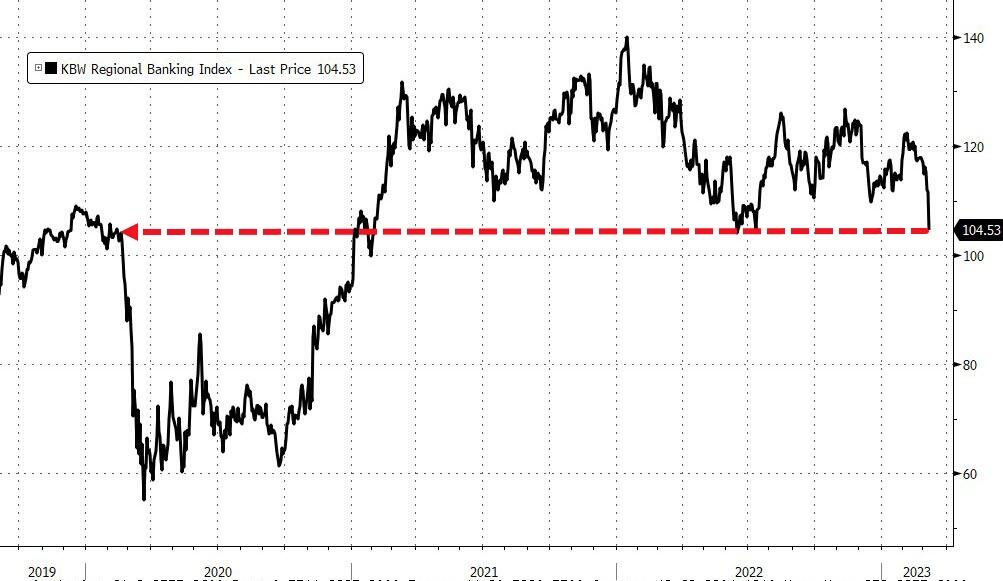
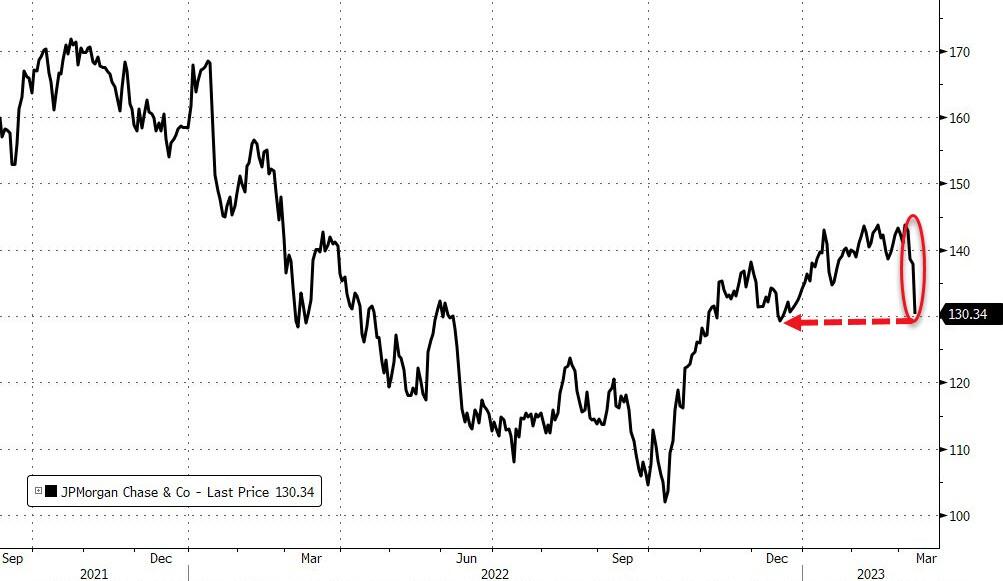
Negative bank headlines spooked the markets with KBW banking index plunging over 7% to a level last seen early 2021, as the Silicone Valley financial group SIVB collapsed around 60%. JP Morgan also got taken to barn and spanked over 5%, while realty trust Vornado, which already had been in a downswing, touched its lowest point since 1996.

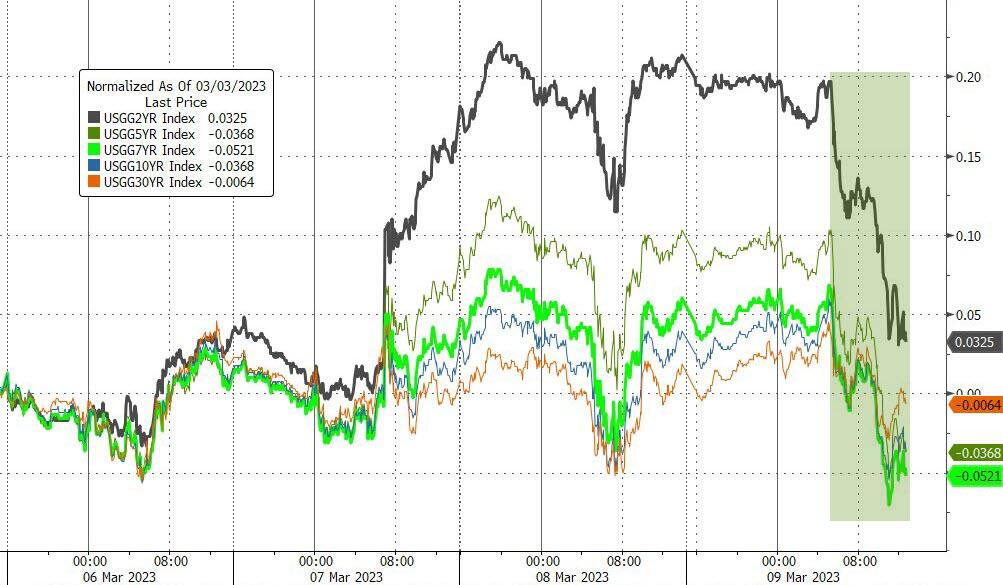
Bond yields retreated, as the 10-year again pierced the 4% level yet slipped later in the session to close at 3.91%.

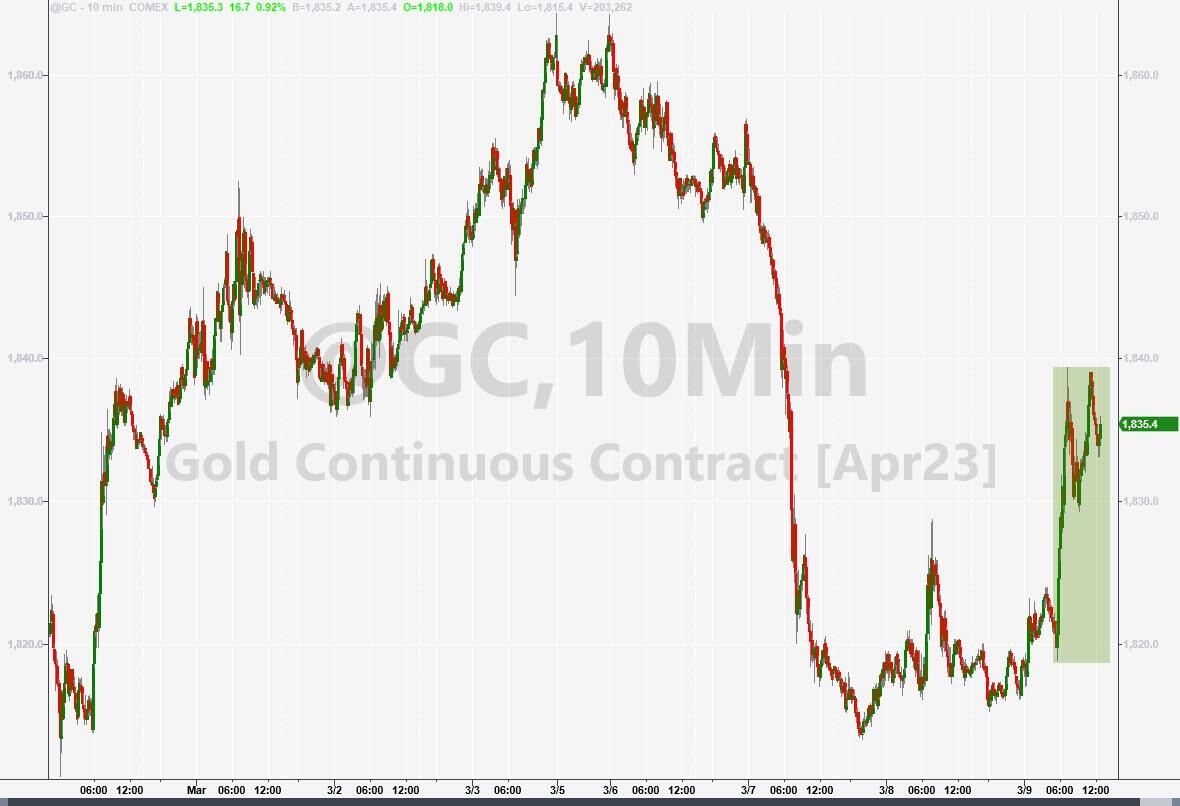
Despite the chaotic moves in the market, the US Dollar dipped, which allowed Gold to stage a nice rebound of almost 1%, with bank stresses being a main contributor to the precious metals’ bullishness.

Of course, all the above could reverse with lightning speed in an instant tomorrow, should the payroll report be a disaster, which would send equities on an ascending trajectory. Remember that bad economic news is good news for the markets.

Read More