
- Moving the markets
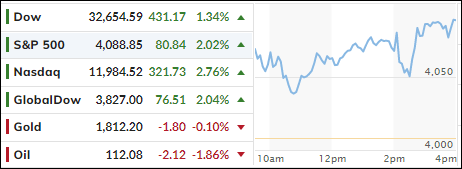
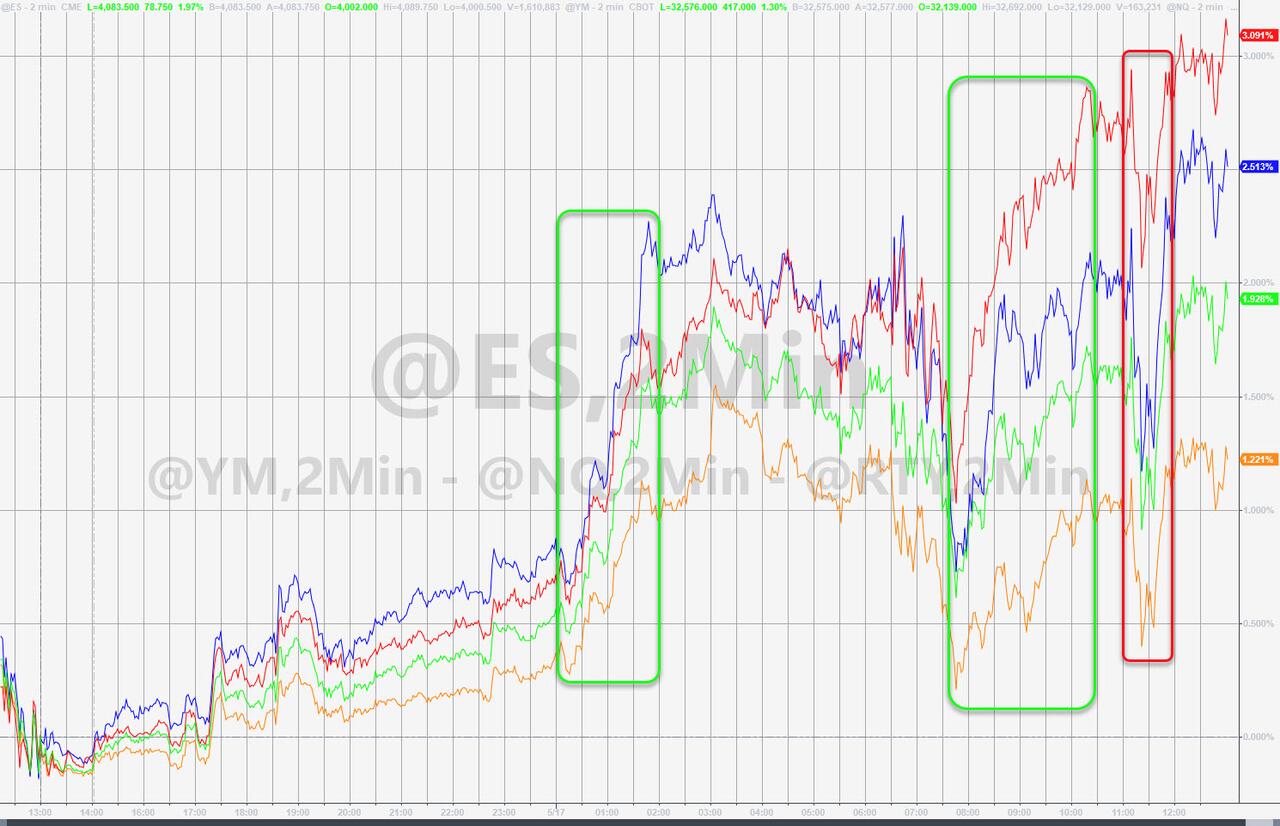
Finally, an early advance, despite some mid-day pullbacks, continued its bullish trend, and the major indexes closed solidly in the green. Of course, the question remains whether upward momentum can be sustained in view of mounting concerns that the economy will tip into a recession later this year.
Contributing to this rebound may have been Fed chair Powell’s remarks, which offered nothing new, as Bloomberg reported:
- POWELL: WON’T HESITATE TO RAISE RATES ABOVE NEUTRAL IF NEEDED
- POWELL: WAR IN UKRAINE LOOKS LONGER-LASTING THAN FIRST EXPECTED
- POWELL: IT’S GOING TO BE CHALLENGING TASK TO TAME INFLATION
- POWELL: THERE COULD BE SOME PAIN INVOLVED
And that is what could have dip buyers encouraged to step back in, as “nothing new” was interpreted as “he could have said something worse.” While the markets pulled back initially, the hopeful meme that Powell will fold sooner rather than later, and thereby salvage equities again, like in 2018, kept the bounce alive.
If that hope is smashed, and he turns out to be serious about getting inflation back under control, all bets are off. Powell left himself wide open to interpretation with these comments:
“If things come in better than we expect, then we’re prepared to do less, if they come in worse than when we expect, then we’re prepared to do more.”
“So, the question whether we can execute a soft landing or not, it may actually depend on factors that we don’t control.”
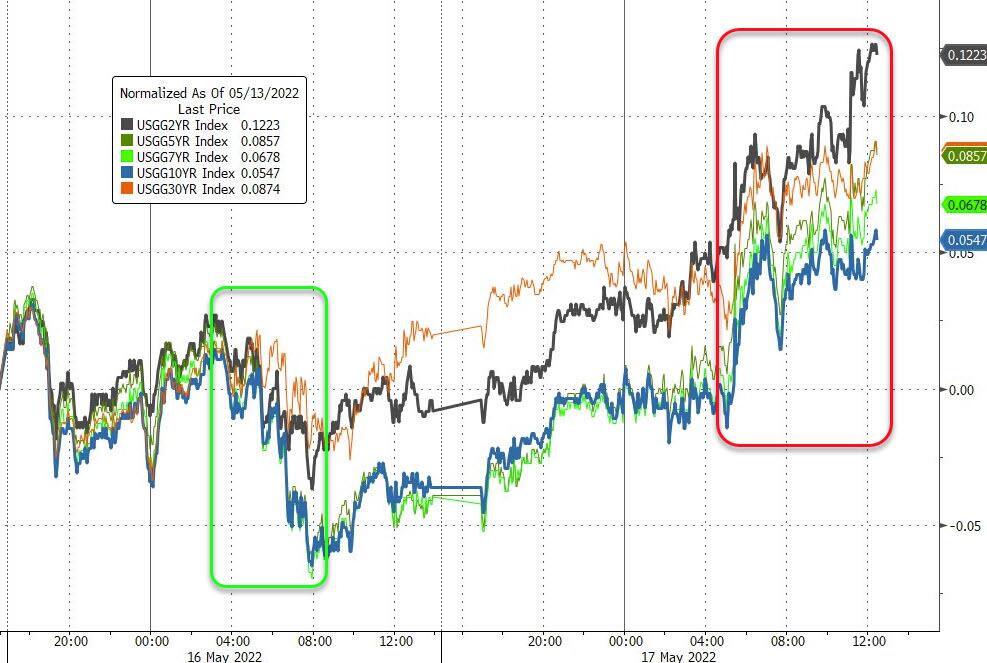
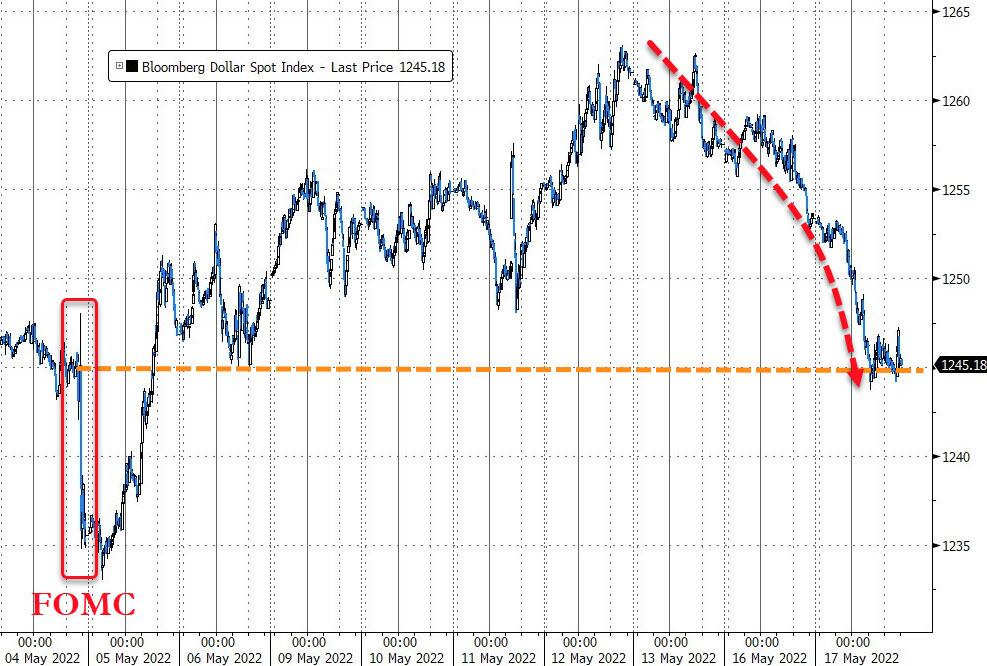
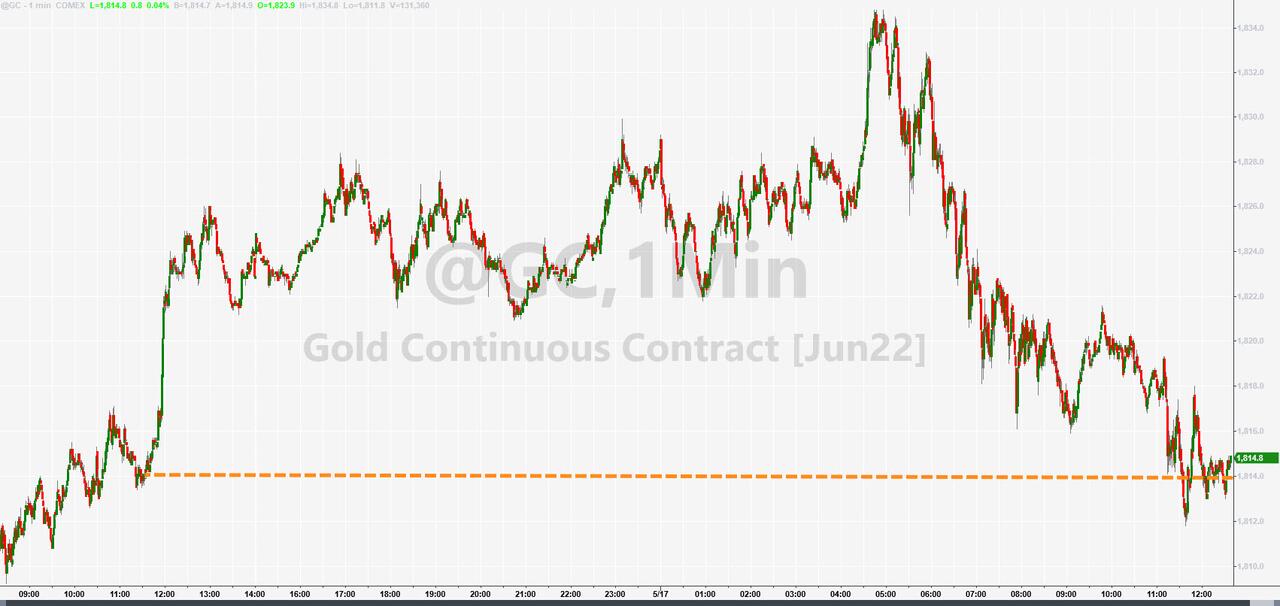
Bond yields surged with the 10-year adding 11 basis points but stopped short of the 3% level to close at 2.992%. The US Dollar continued its 3-day slide, wholesale gasoline was heading towards the $5 level, Gold round tripped and ended unchanged.
Uncertainty reigns, and this bounce could continue into Friday’s options expirations or die on the vine tomorrow. Right now, we remain entrenched on the bearish side of the trend line.
2. ETFs in the Spotlight
In case you missed the announcement and description of this section, you can read it here again.
It features some of the 10 broadly diversified domestic and sector ETFs from my HighVolume list as posted every Saturday. Furthermore, they are screened for the lowest MaxDD% number meaning they have been showing better resistance to temporary sell offs than all others over the past year.
The below table simply demonstrates the magnitude with which these ETFs are fluctuating above or below their respective individual trend lines (%+/-M/A). A break below, represented by a negative number, shows weakness, while a break above, represented by a positive percentage, shows strength.
For hundreds of ETF choices, be sure to reference Thursday’s StatSheet.
For this closed-out domestic “Buy” cycle (2/24/2022), here’s how some of our candidates have fared:
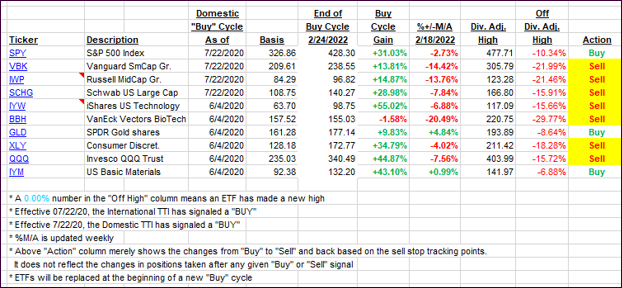
Click image to enlarge.
Again, the %+/-M/A column above shows the position of the various ETFs in relation to their respective long-term trend lines, while the trailing sell stops are being tracked in the “Off High” column. The “Action” column will signal a “Sell” once the -12% point has been taken out in the “Off High” column, which has replaced the prior -8% to -10% limits.
3. Trend Tracking Indexes (TTIs)
Our TTI’s rallied sharply but remain bear market territory.
This is how we closed 05/17/2022:
Domestic TTI: -5.01% below its M/A (prior close -6.98%)—Sell signal effective 02/24/2022.
International TTI: -5.47% below its M/A (prior close -7.25%)—Sell signal effective 03/08/2022.
Disclosure: I am obliged to inform you that I, as well as my advisory clients, own some of the ETFs listed in the above table. Furthermore, they do not represent a specific investment recommendation for you, they merely show which ETFs from the universe I track are falling within the specified guidelines.
All linked charts above are courtesy of Bloomberg via ZeroHedge.
Contact Ulli