
- Moving the markets
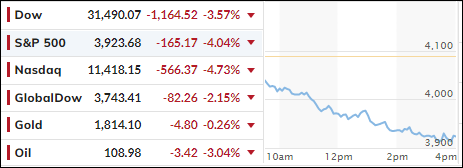
Despite yesterday’s bullish euphoria, reality set in today and informed those, who had not gotten the message yet, that we are indeed in bear market territory, in which hopeful bounces tend to die quickly.
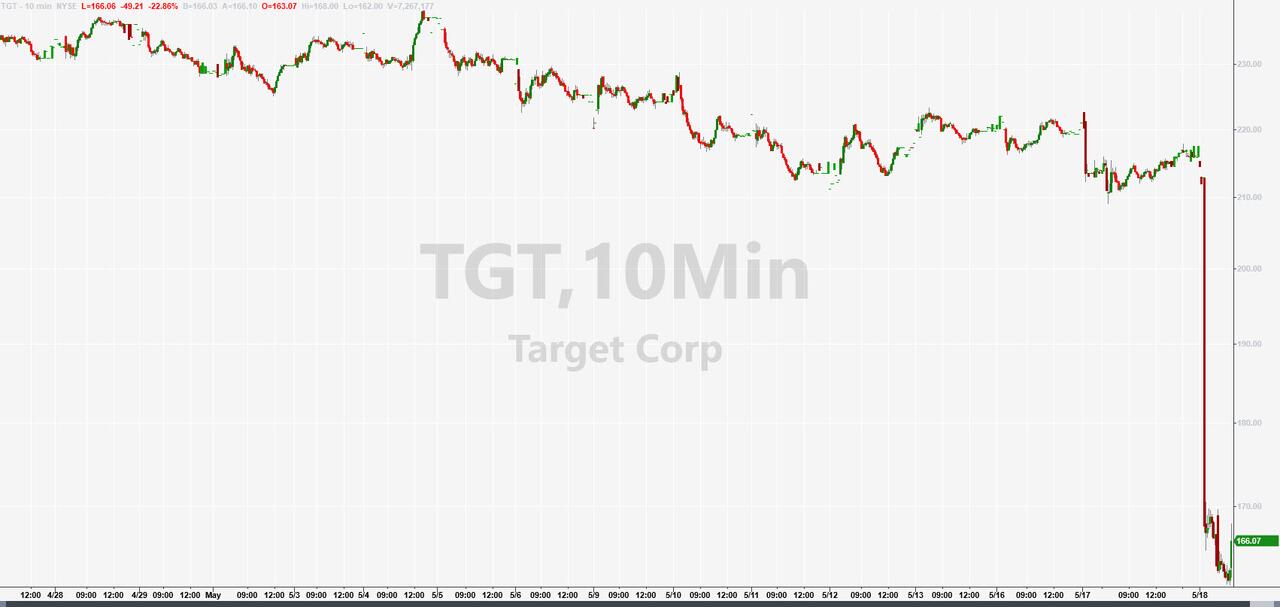
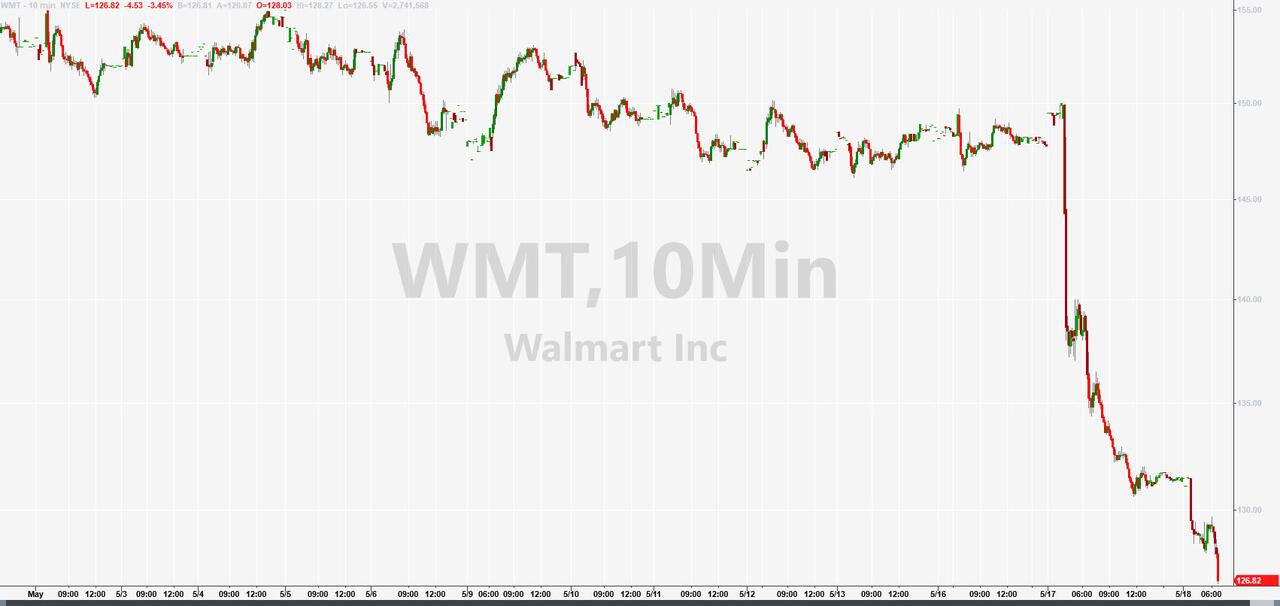
Today’s action would be better described as a “puke fest,” with every asset class, except gold, being spanked with utter abandon. Pushing things in the wrong direction at the opening was retailer Target’s earnings and announcement about the damage inflation can do to profit margins due to higher fuel and compensation costs. The stock plunged some 25% with the fallout effect spreading to Walmart as well, which dropped 7%.
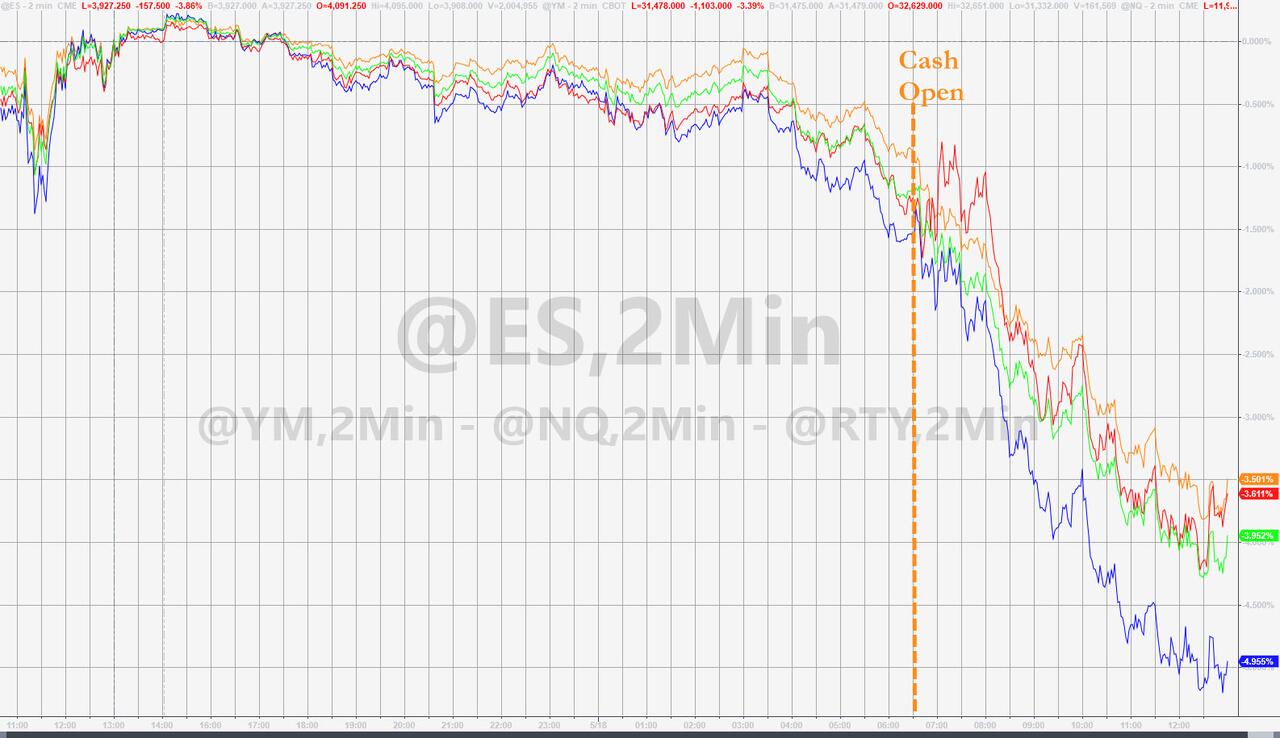
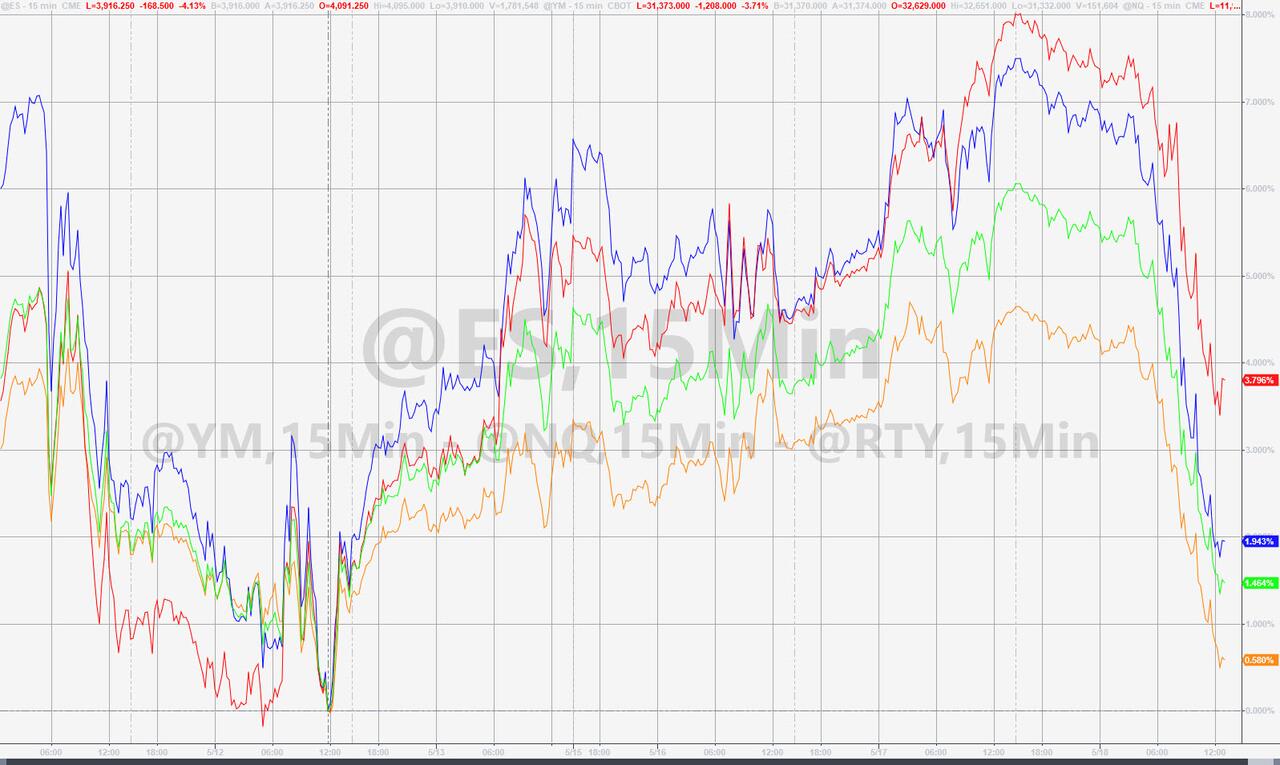
Trader’s pondering the theme “who’s next?” decided that dumping everything in sight was the best cause of action, as relentless selling picked up speed handing equities their worst day of the year.
Not helping markets at all was big-time investor and bubble market identifier extraordinaire, Jeremey Grantham, with this comment:
“The other day, we were down about 19.9% on the S&P 500 and about 27% on the Nasdaq. I would say at a minimum, we are likely to do twice that, if we are unlucky, which is quite possible, we would do three legs like that, and it might take a couple of years as it did in the 2000s.”
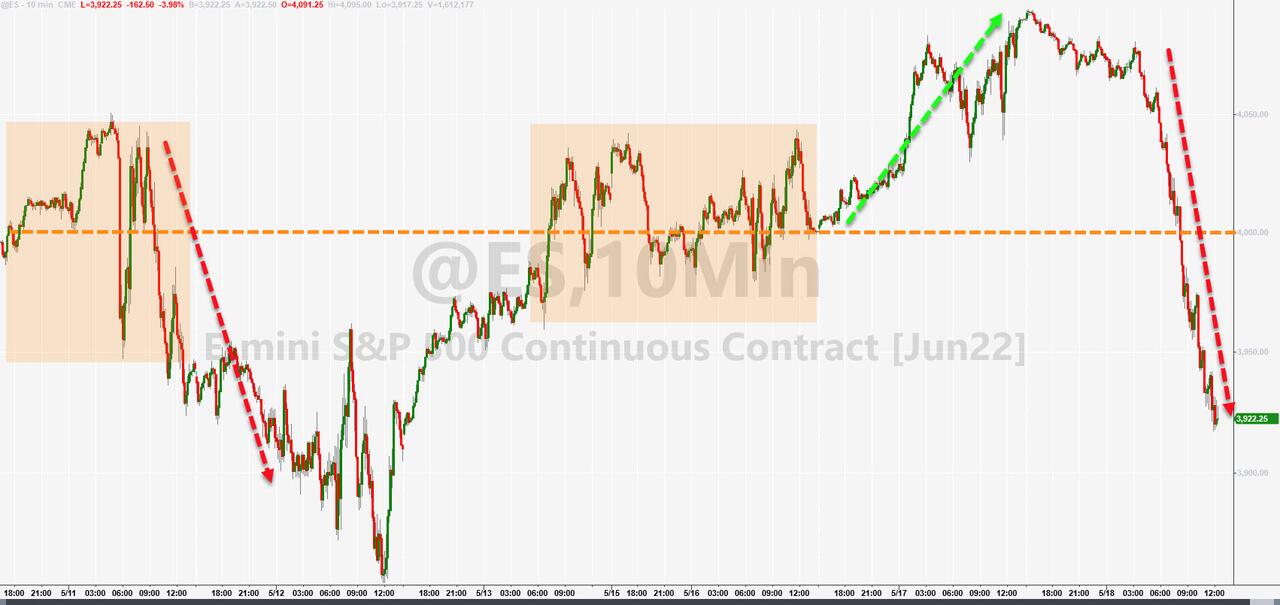
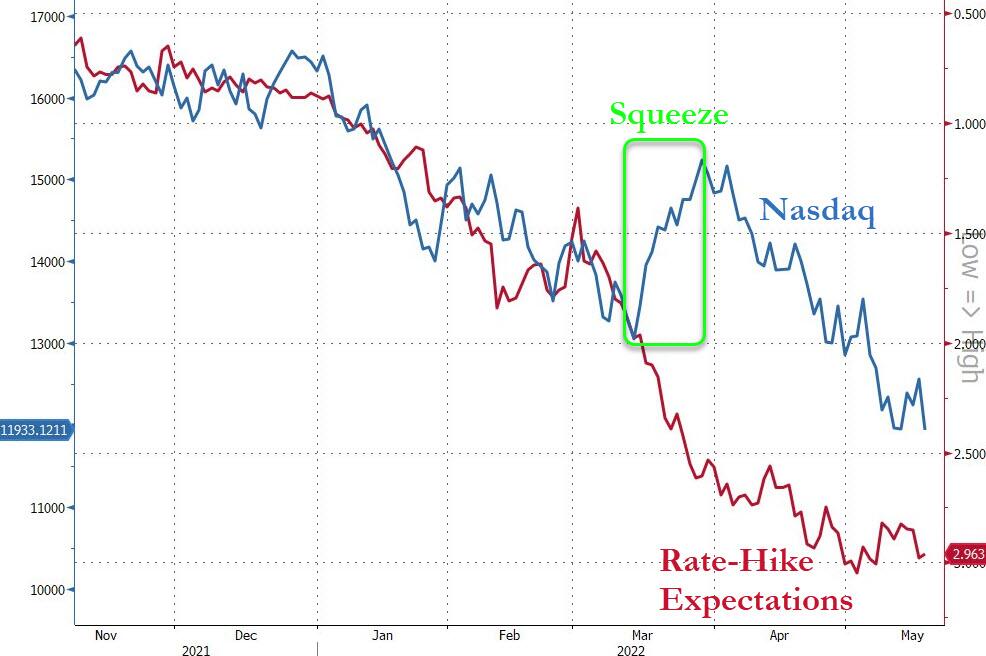
As Zero Hedge pointed out, stocks have now almost unwound all of the dead-cat bounce from last week, while the S&P 500 lost its 4k level once again. It’s also questionable whether the remaining rate hikes have been priced in, with Bloomberg referencing them in this chart. In other words, there may be more downside to come.
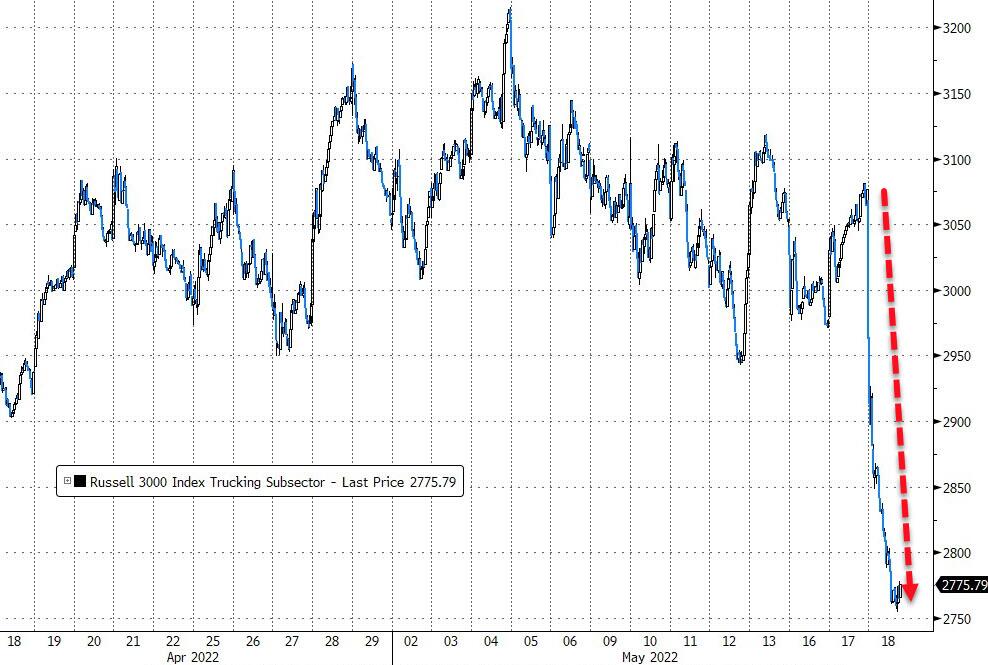
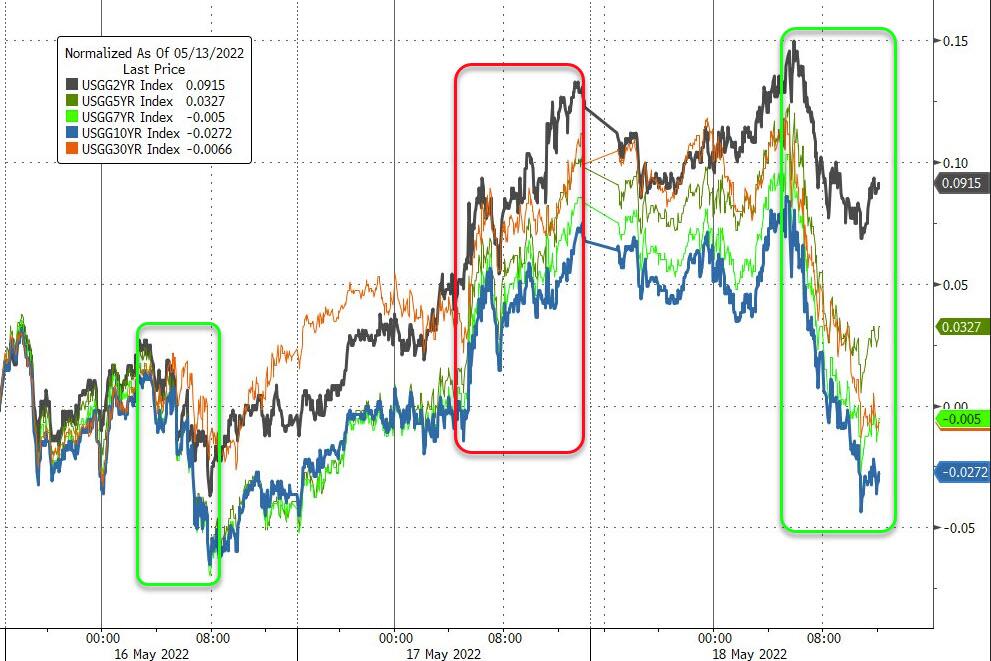
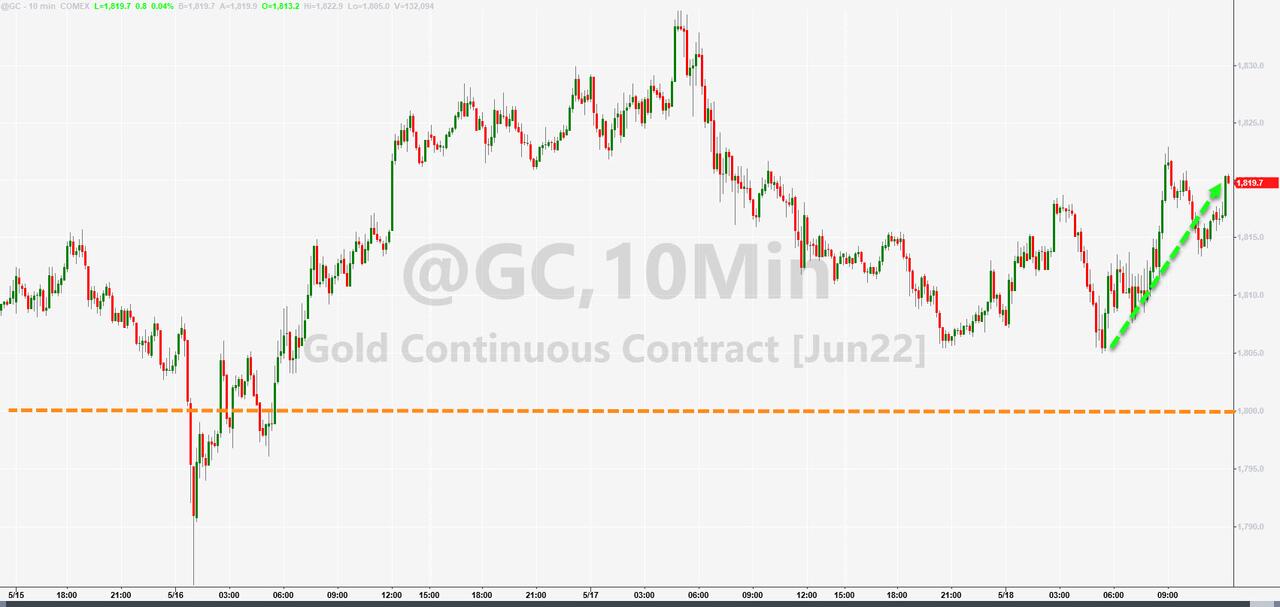
As was no surprise, Trucking stocks were hammered, bond yields retreated with the 10-year touching its 3% level but closing below 2.9%. Gold held up well during the debacle and scored some modest gains.
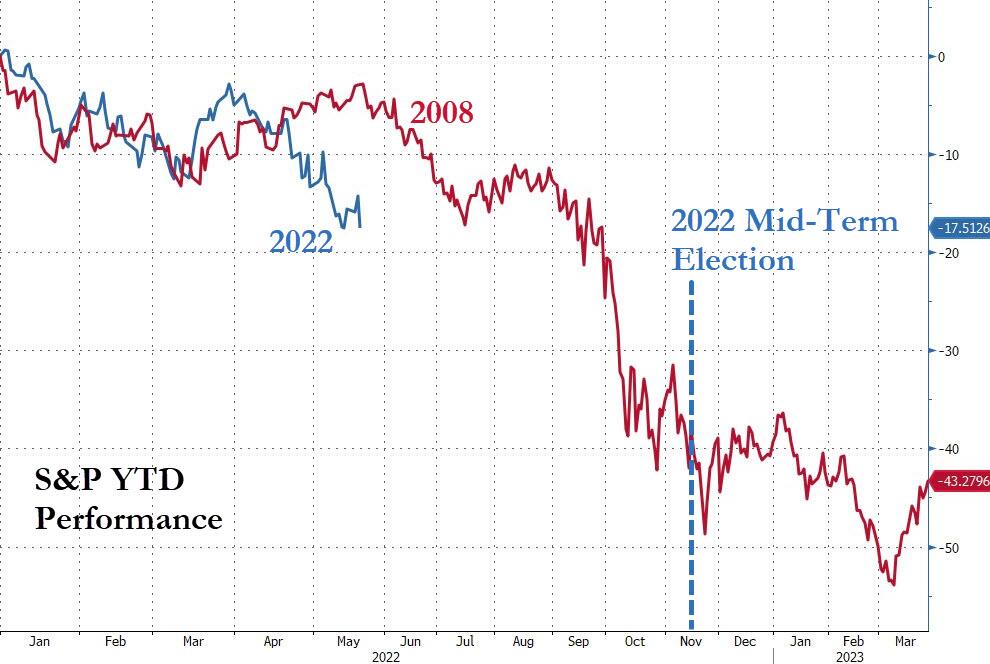
Looking at the big picture, could we see history repeating itself?
2. ETFs in the Spotlight
In case you missed the announcement and description of this section, you can read it here again.
It features some of the 10 broadly diversified domestic and sector ETFs from my HighVolume list as posted every Saturday. Furthermore, they are screened for the lowest MaxDD% number meaning they have been showing better resistance to temporary sell offs than all others over the past year.
The below table simply demonstrates the magnitude with which these ETFs are fluctuating above or below their respective individual trend lines (%+/-M/A). A break below, represented by a negative number, shows weakness, while a break above, represented by a positive percentage, shows strength.
For hundreds of ETF choices, be sure to reference Thursday’s StatSheet.
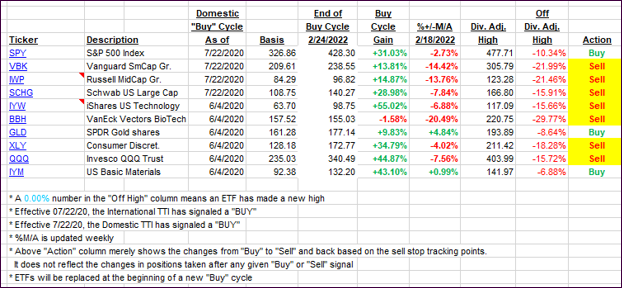
For this closed-out domestic “Buy” cycle (2/24/2022), here’s how some of our candidates have fared:
Click image to enlarge.
Again, the %+/-M/A column above shows the position of the various ETFs in relation to their respective long-term trend lines, while the trailing sell stops are being tracked in the “Off High” column. The “Action” column will signal a “Sell” once the -12% point has been taken out in the “Off High” column, which has replaced the prior -8% to -10% limits.
3. Trend Tracking Indexes (TTIs)
Our TTI’s dropped like a rock and are firmly embedded on the bearish side of their respective trend lines.
This is how we closed 05/18/2022:
Domestic TTI: -8.58% below its M/A (prior close -5.01%)—Sell signal effective 02/24/2022.
International TTI: -7.53% below its M/A (prior close -5.47%)—Sell signal effective 03/08/2022.
Disclosure: I am obliged to inform you that I, as well as my advisory clients, own some of the ETFs listed in the above table. Furthermore, they do not represent a specific investment recommendation for you, they merely show which ETFs from the universe I track are falling within the specified guidelines.
All linked charts above are courtesy of Bloomberg via ZeroHedge.
Contact Ulli