Hawkish Fed: No News Is Good News

Ulli Market Commentary Contact

[Chart courtesy of MarketWatch.com]

  1. Moving the markets

Nothing mattered today other the release of the Fed minutes. There were no surprises with the policy meeting notes showing that the Central Bank is prepared to raise rates further than anticipated.

This should have been reason enough for a sell off, but that did not happen. A deeper analysis of the minutes displayed some verbiage that possibly perhaps hinted at the Fed taking a pause of its hiking plan later this year.

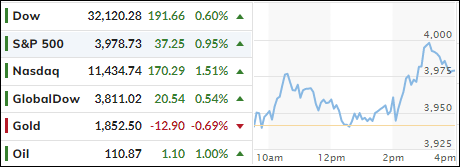
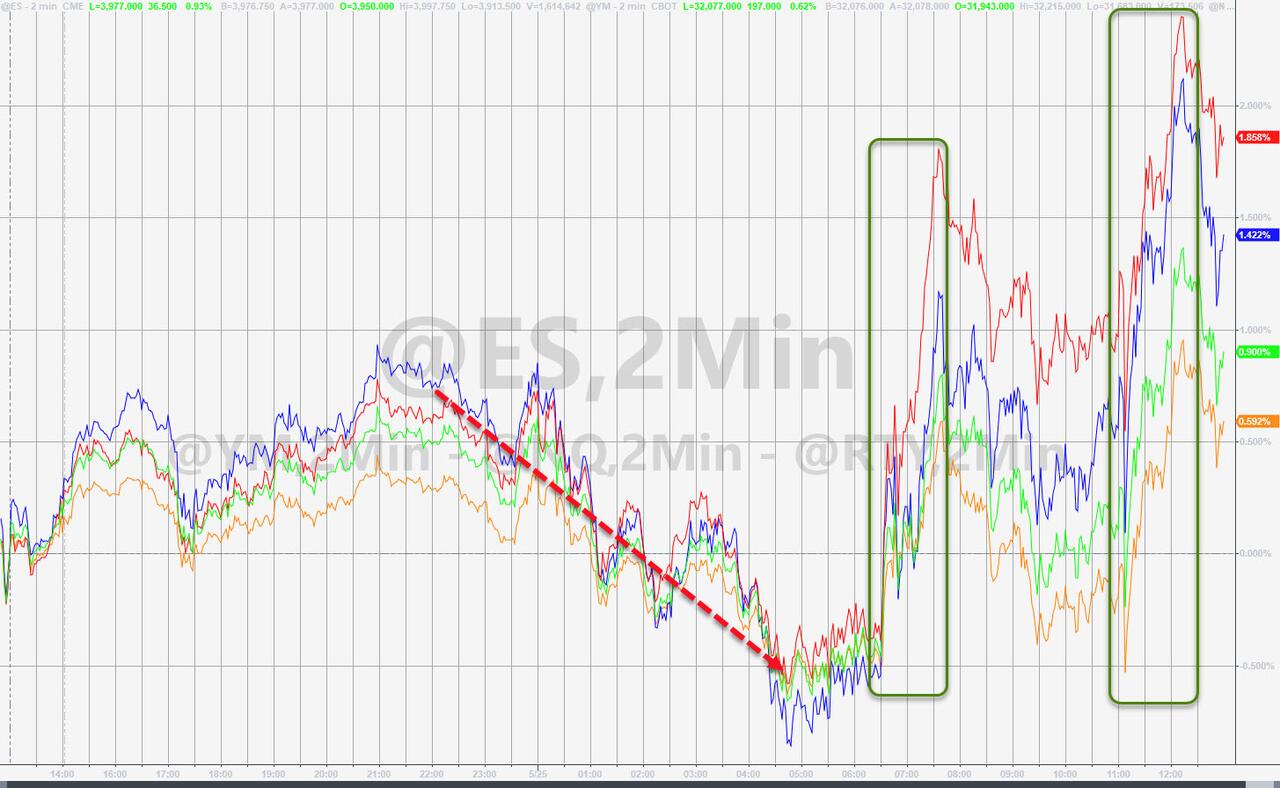
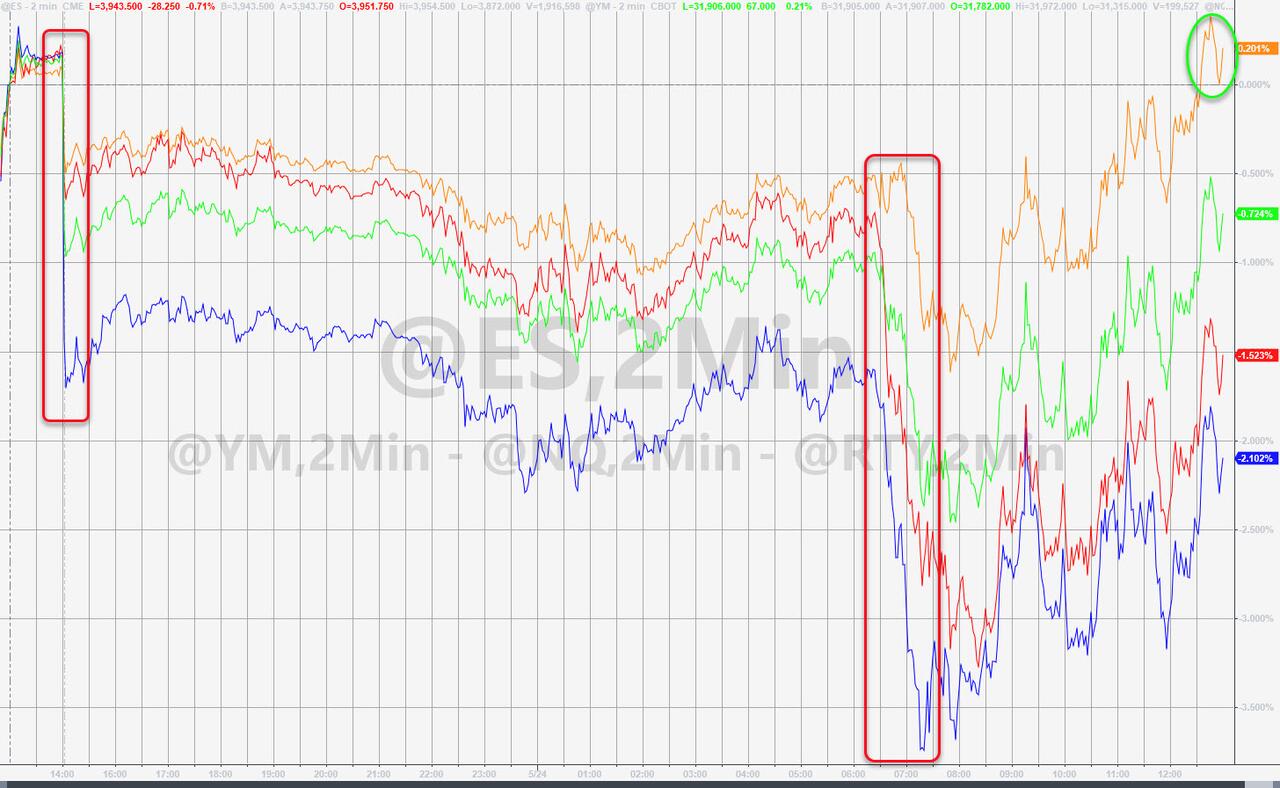
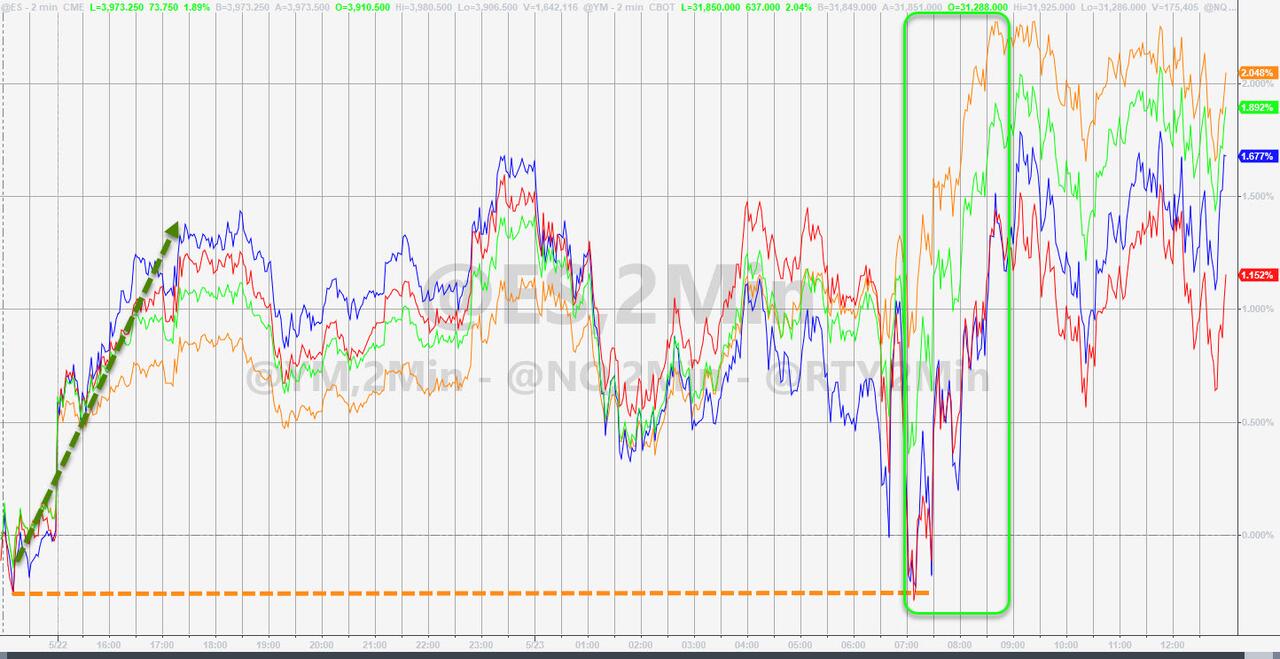
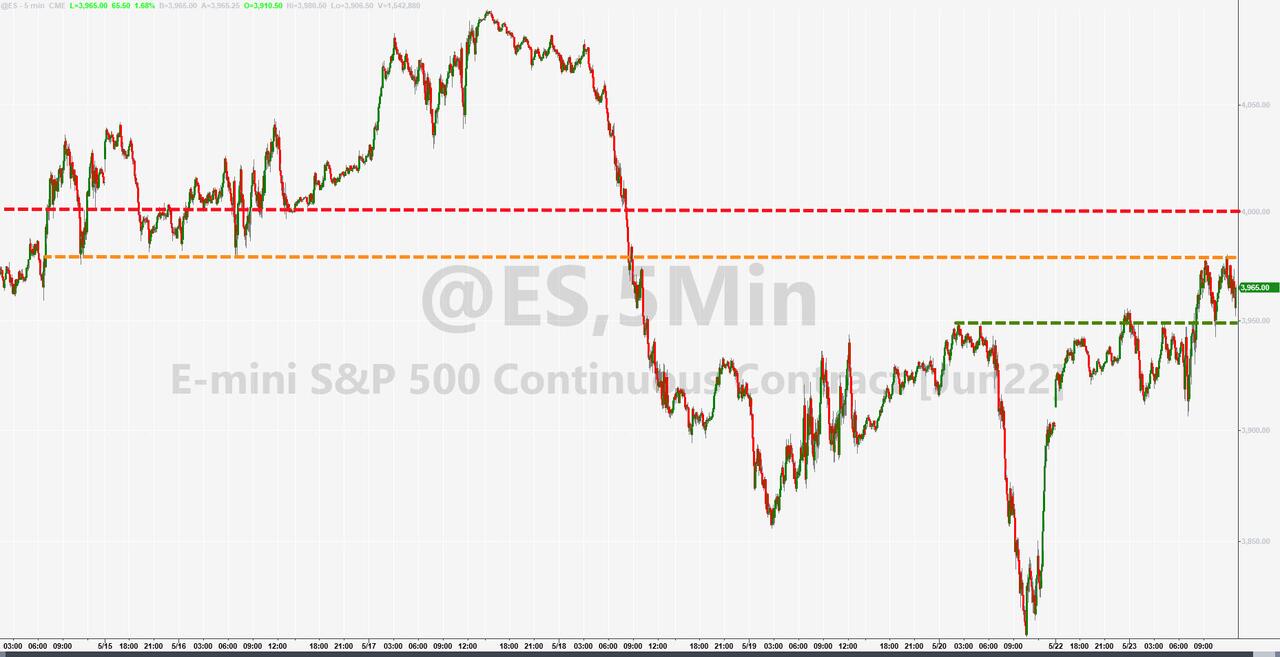
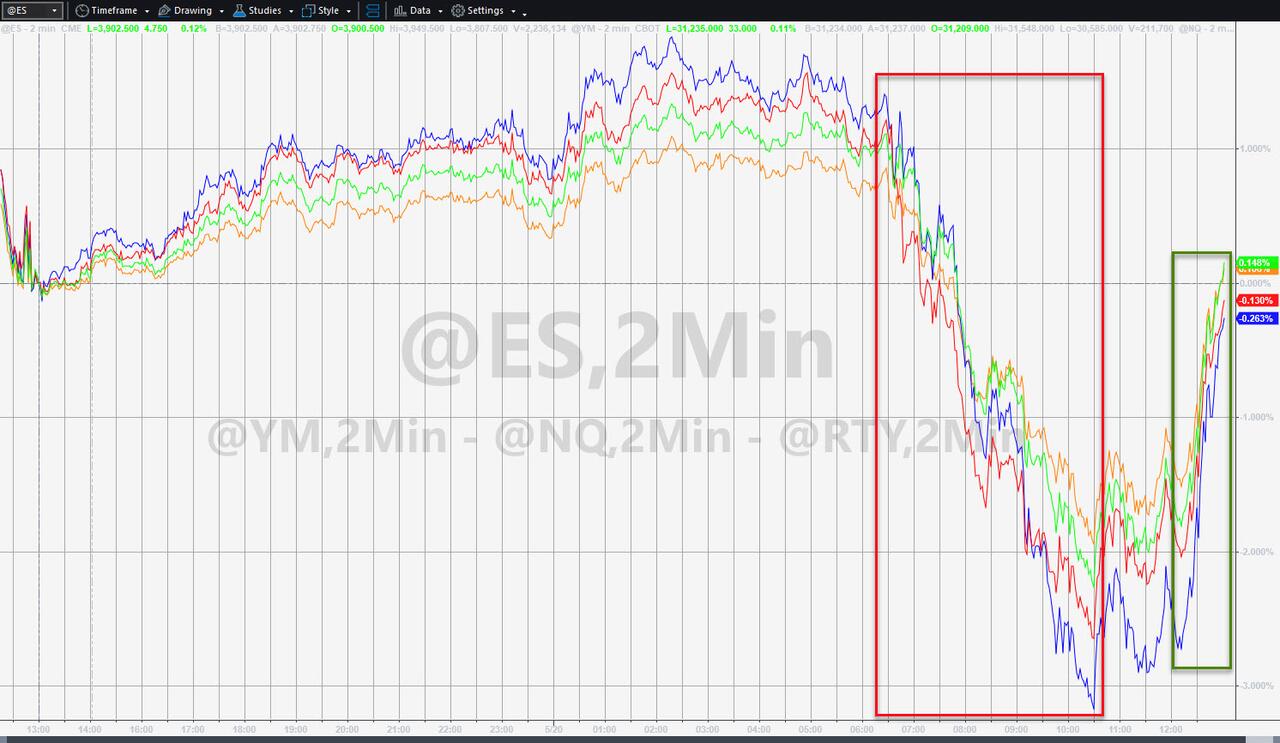
That was enough to get the bullish juices flowing and the ensuing rally propelled the major indexes to intra-day highs, but momentum faded into the close. Still, all indexes managed to gain for the day.

Anxiety in the retail sector eased, as Nordstrom’s and Dick’s Sporting Goods surpassed earnings, with the former even raising its full-year outlook. Both stocks climbed on the news.

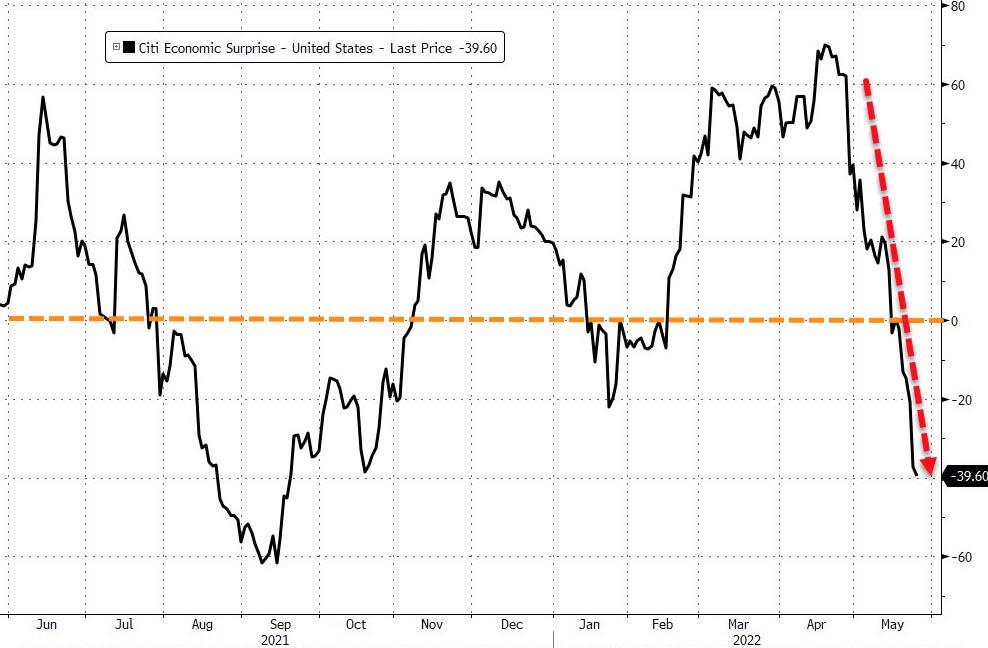
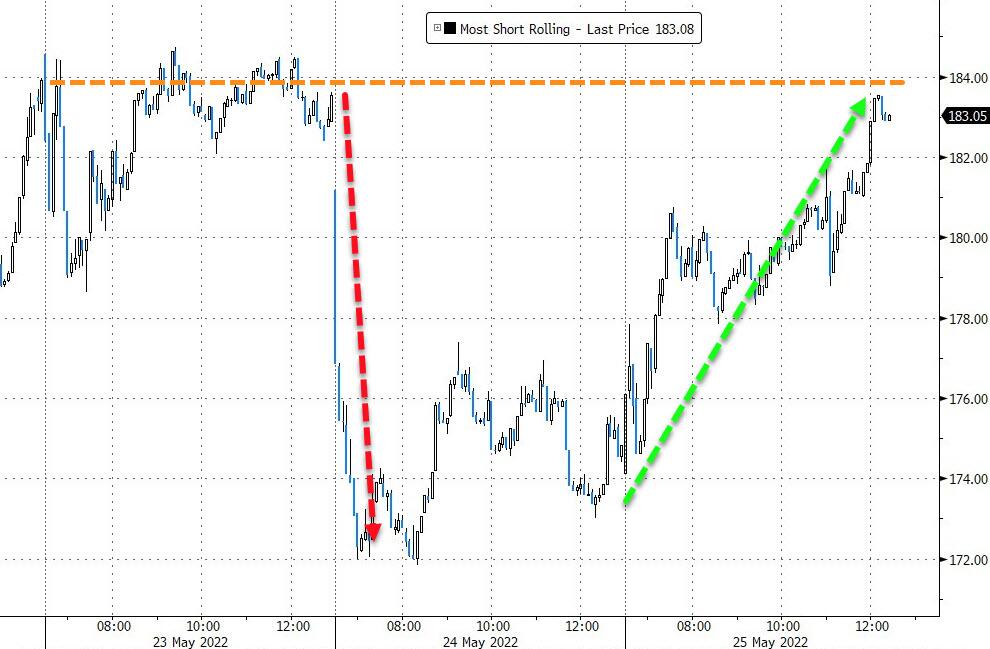
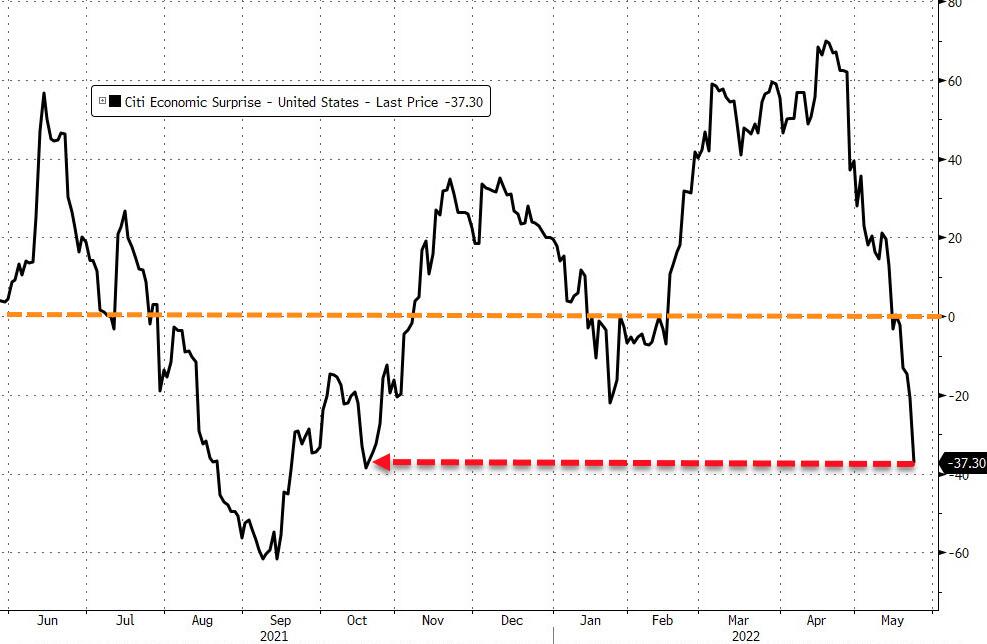
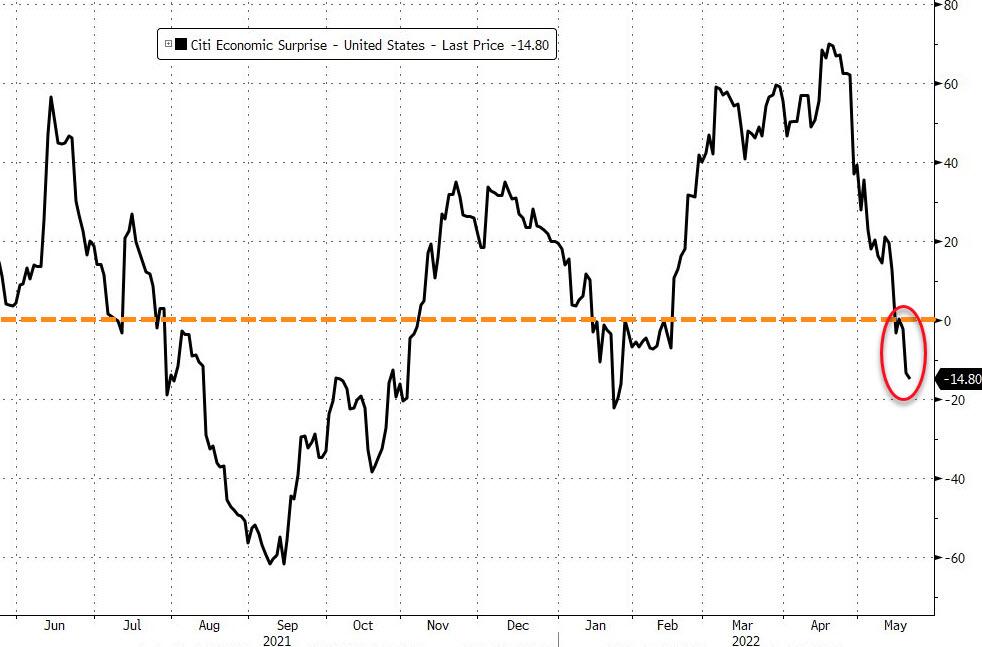
The tech sector saw support due to some good news from Intuit, DocuSign, and Zoom Video. However, Macro Data was dismal with Durable Goods numbers coming in below expectations, but, if you need bullish support, you can always count on a short squeeze, and today was no exception.   

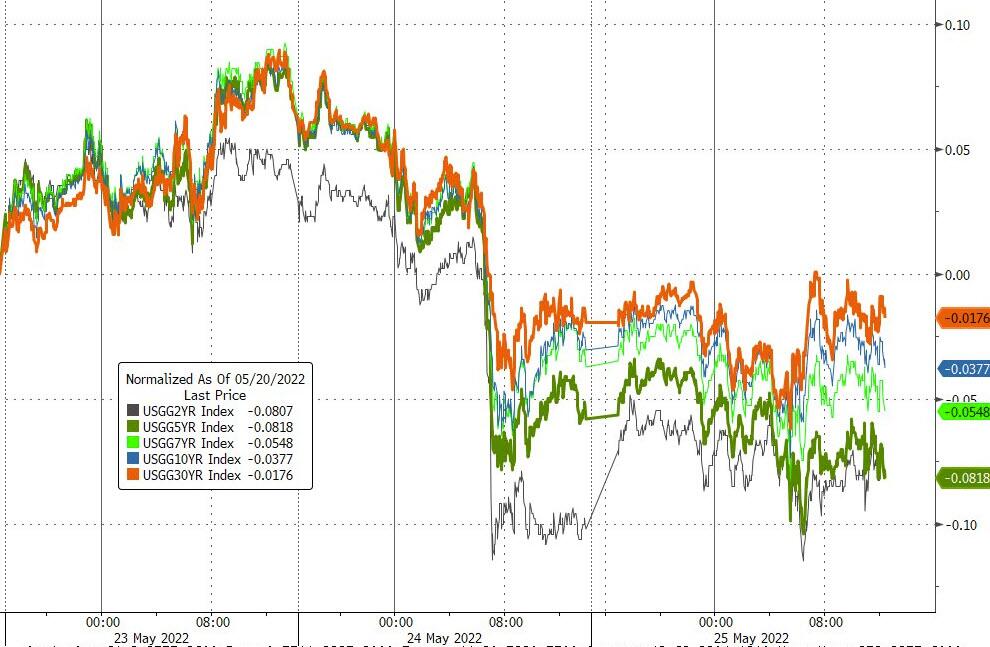
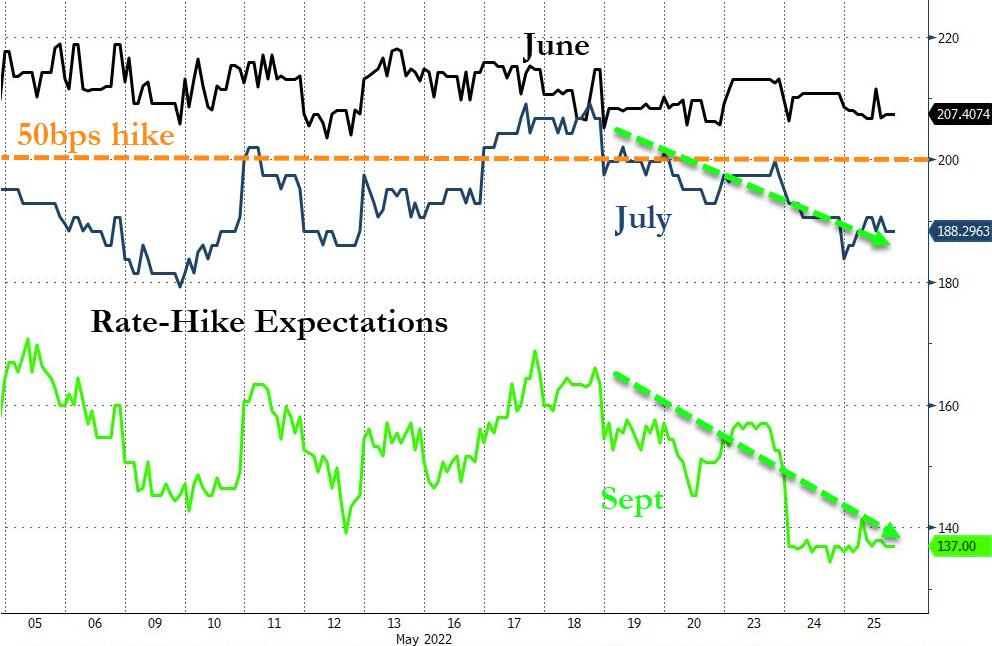
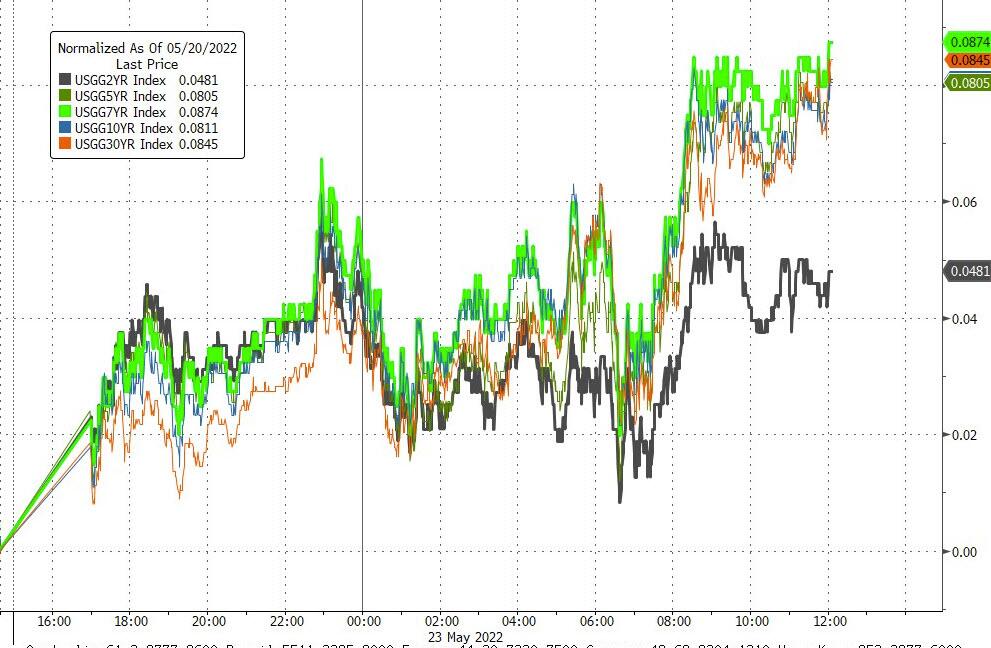
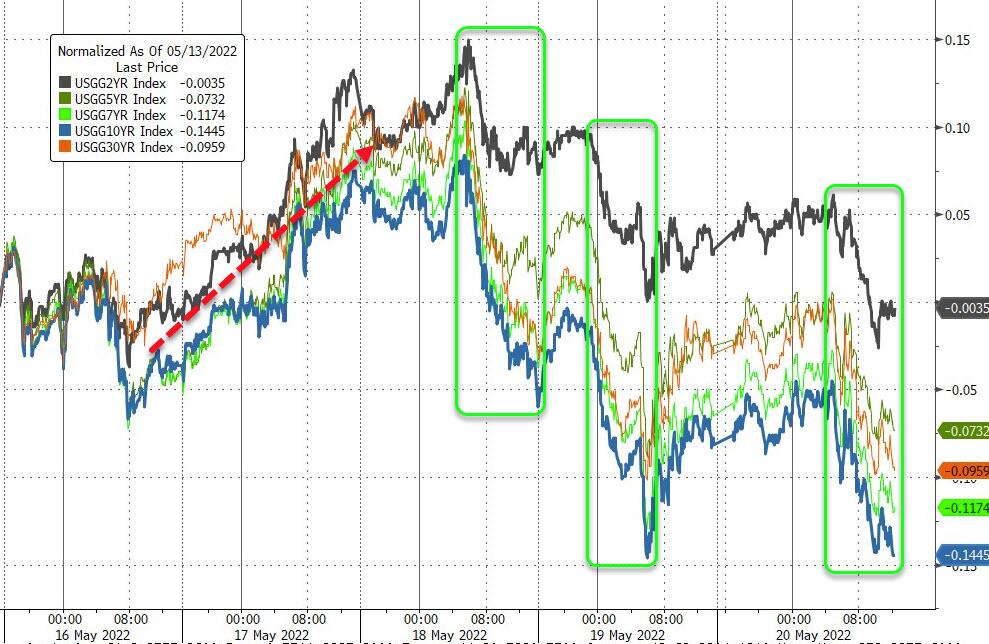
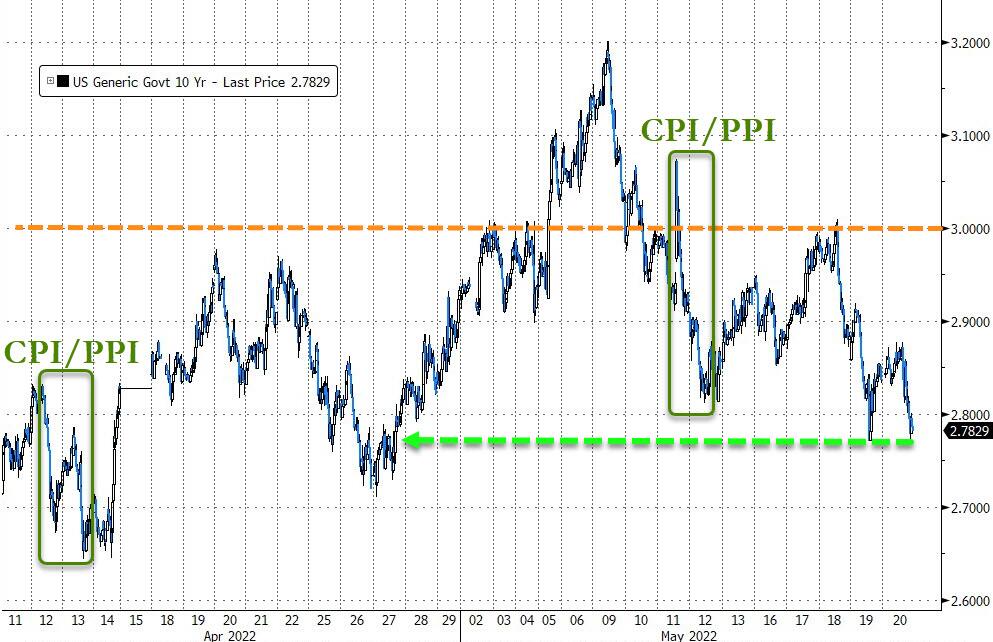
Bond yields slipped again, despite a 50-bps hike in rates for June being now a foregone conclusion. However, as ZeroHedge pointed out, the odds of another 50-bps hike in July are fading modestly and are tumbling for September.

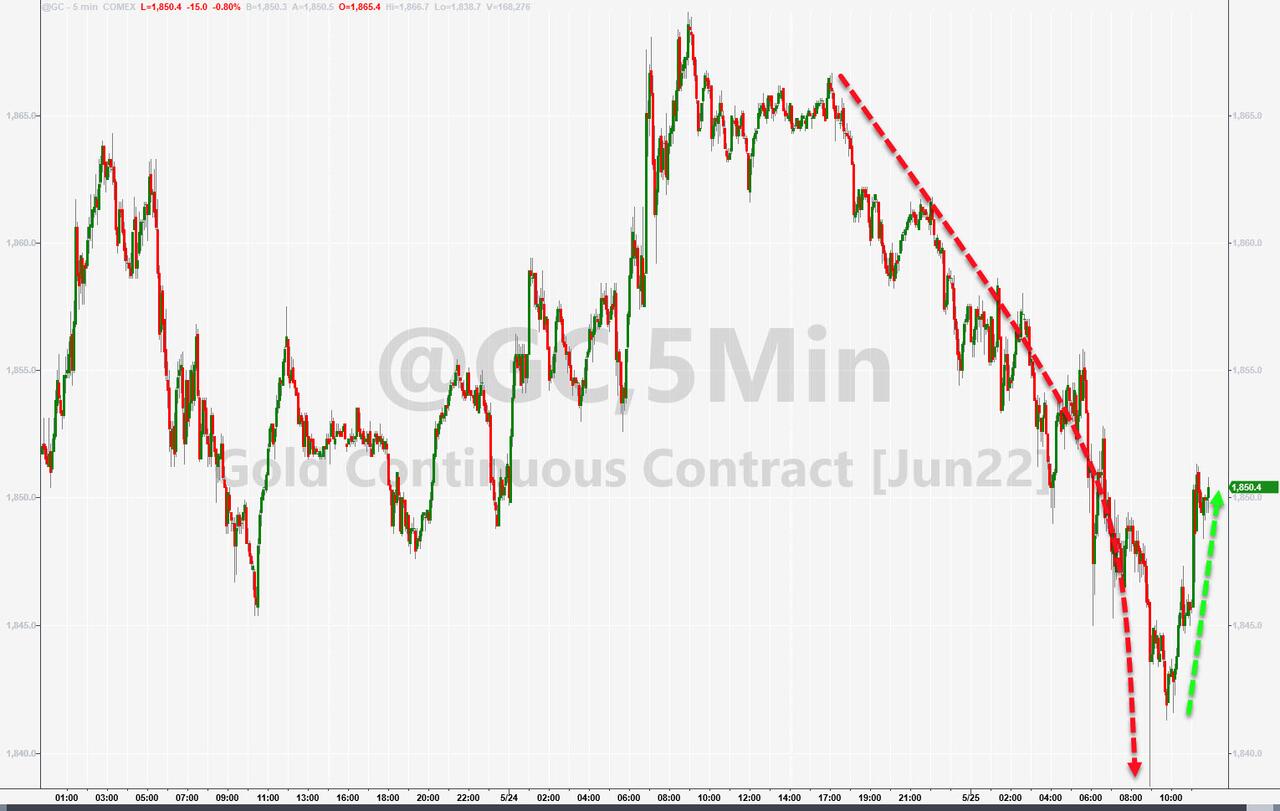
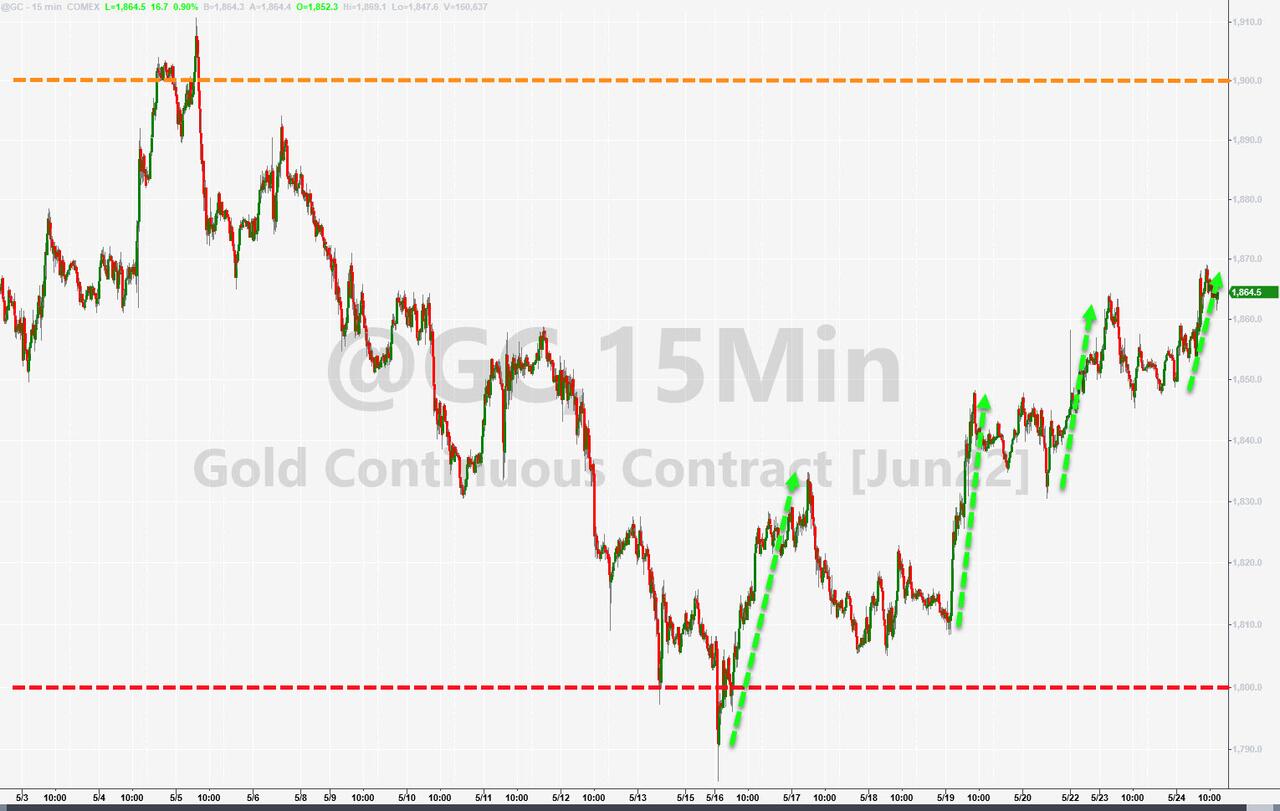
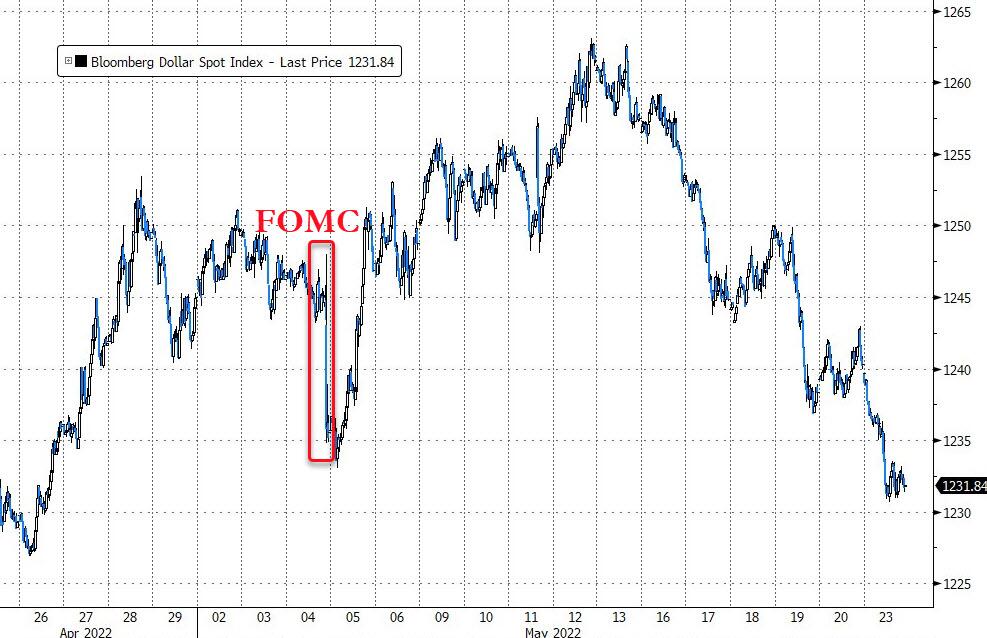
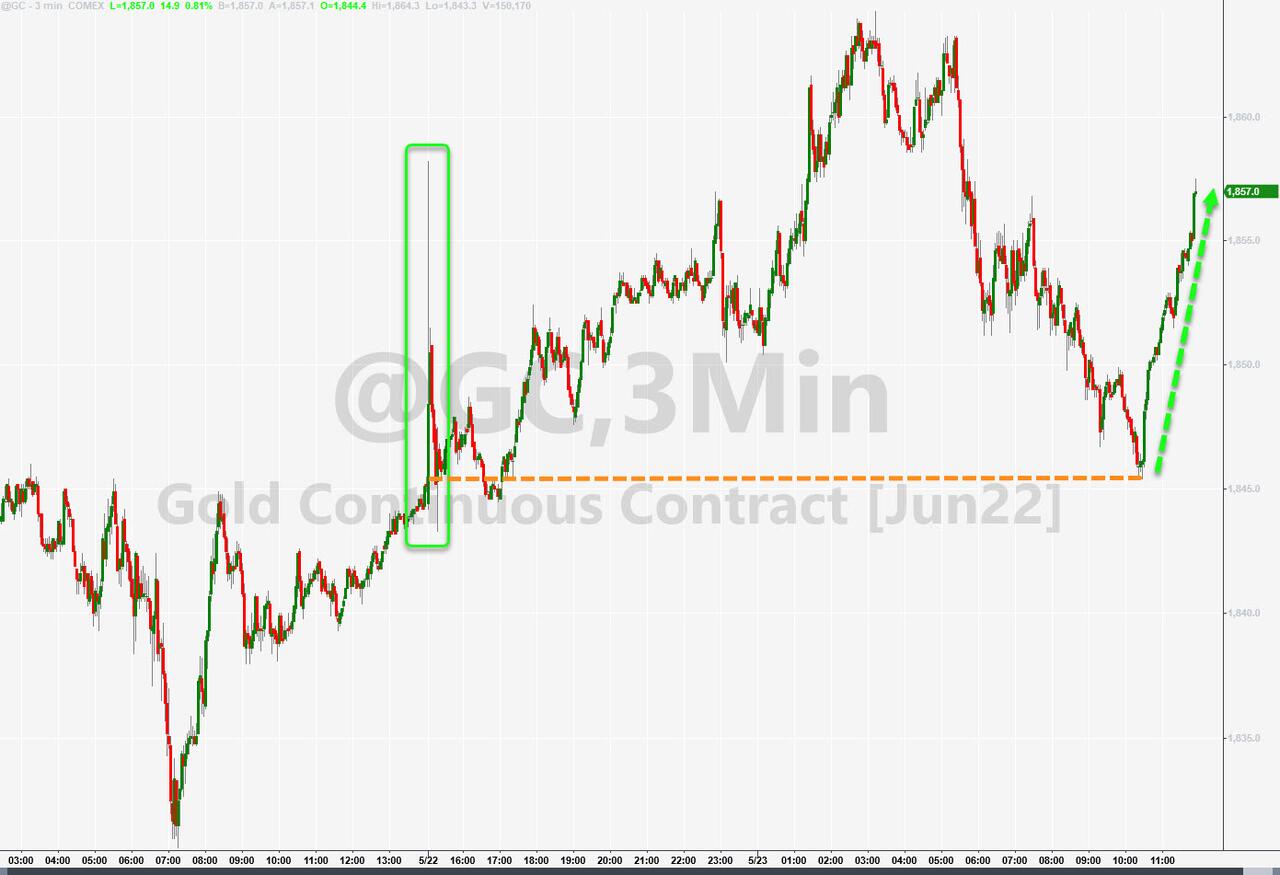
The US Dollar gained a tad but slipped into the close, while gold dipped and ripped but failed to reach its unchanged line.

ZH summed it up like this: Three more 50-bps hikes and then the Fed pauses… indefinitely; its next move a cut as the economic recession emerges from hiding.

Read More

Digging A Hole—And Almost Climbing Out Of It

Ulli Market Commentary Contact

[Chart courtesy of MarketWatch.com]

  1. Moving the markets

One look at the above chart tells the story of the day. With the Dow down over 450 points early in the session, a rebound attempt showed some promise, but it was only the Dow, which ended up at the unchanged line.

Even though the S&P 500 greatly reduced its early losses, the Nasdaq got spanked again and gave back more than it had gained during yesterday’s ramp-a-thon. Contributing to the index’s fall was social media’s SNAP (-41%), which warned that it’s bracing to miss not only earnings and revenue targets but also may slow down hiring.

Billionaire hedge fund guru Bill Ackman offered his view of the current state of Fed policy:

“If the Fed doesn’t do its job, the market will do the Fed’s job, and that is what is happening now. The only way to stop today’s raging inflation is with aggressive monetary tightening or with a collapse in the economy.”

After retail bellwethers Target and Walmart got pounded last week, due increasing labor and transportations costs, today, it was Abercrombie & Fitch’s turn to pick up the baton by announcing that freight and product costs weighed on sales. The punishment was quick, and the stock dropped some 31%.

As ZeroHedge reported, the economy, as measured by the US Macro Surprise Index, crashed into negative territory and to its weakest since October 2021. That caused bond yields to fall with the 10-year dropping to 2.755% thereby giving the much maligned bond holders some reprieve, as the widely held bond ETF TLT rebounded +1.97%. But, that is only a small consolation given that this ETF is still down -21% YTD.

With recessionary expectations on the rise, gold benefited and gained +0.95% on the day, while the US Dollar continued its aimless meandering by falling to its lowest in a month.

Read More

Battling Back

Ulli Market Commentary Contact

[Chart courtesy of MarketWatch.com]

  1. Moving the markets

Finally, the markets were able to build on early gains, with the bulls at last managing to score a winning session. As I posted Friday, I suspected as much due to balanced mutual funds having to go through their monthly rebalancing efforts this week.

This move pulled the S&P 500 out of Friday’s officially reached intra-day bear market, which is defined as a drop of 20% from its latest high. Even the much-spanked Nasdaq ended up in the green with a 1.59% gain. Still, it will be a long, hard road for this index to recapture its recent 26% drop, especially after having seen seven down weeks in a row.

One analyst at Aviva investors captured the current market mood with this spot-on remark:

“Investors are trying to come to grips with what exactly is happening and always try to guess what the outcome is. Investors and the market hate uncertainty, and this is a period where they don’t have any clear indication on what’s going to happen with this push-pull between inflation and the economy.”

Despite today’s valiant effort, the S&P 500 fell short of recapturing its 4k level, as bonds were spanked, with the yield on the 10-year rising over 7 bps to 2.862%. That caused the widely held bond ETF TLT to drop -1.65% on the session, which brought its YTD performance down to -20.03%. Ouch!

The US Dollar continued its slide, and gold rebounded 0.53% to inch closer toward its $1,900 level.   

While today’s bounce gave traders some warm and fuzzy feelings, this bear market is far from being over, but it may take a pause and could very well present us with another head fake.    

Read More

ETFs On The Cutline – Updated Through 05/20/2022

Ulli ETFs on the Cutline Contact

Below, please find the latest High-Volume ETF Cutline report, which shows how far above or below their respective long-term trend lines (39-week SMA) my currently tracked ETFs are positioned.

This report covers the HV ETF Master List from Thursday’s StatSheet and includes 312 High Volume ETFs, defined as those with an average daily volume of more than $5 million, of which currently 45 (last week 47) are hovering in bullish territory. The yellow line separates those ETFs that are positioned above their trend line (%M/A) from those that have dropped below it.

Take a look:                                                                   

The HV ETF Master Cutline Report

In case you are not familiar with some of the terminology used in the reports, please read the Glossary of Terms. If you missed the original post about the Cutline approach, you can read it here.      

ETF Tracker Newsletter For May 20, 2022

Ulli ETF Tracker Contact

ETF Tracker StatSheet          

You can view the latest version here.

AN AFTERNOON BOUNCE SAVES THE DAY BUT NOT THE WEEK

[Chart courtesy of MarketWatch.com]

  1. Moving the markets

The market’s attempt at a comeback, after failing yesterday, was a success today as the Dow and S&P 500 managed to bounce back to their unchanged lines. Nevertheless, the S&P inched into bear market territory, which Wall Street defines as drop of 20% or more from its recent high. For the week, the index dropped more than 3%, the Nasdaq gave back 5%, while the Dow suffered its longest losing streak in 99 years.

Causing some of this week’s upheaval were back-to-back quarterly reports from Target and Walmart indicating that higher fuel costs and reduced consumer demand would hurt their bottom lines.

Both stocks were spanked on the news, as traders figured out that there might not be just 2 cockroaches that will be seeing the inflationary impact on earnings. And, as if on cue, Cisco followed suit and plunged on poor results.

A hint that the economy is slowing was brought to the forefront yesterday when US jobless claims rose 218k for the week, causing a Deutsche Bank strategist to comment:

“In the event we slide into a recession imminently, we see the market selloff going well beyond average, i.e., into the upper half of the historical range and given elevated initial overvaluation, -35% to -40% or S&P 500 3000.”

We could get there in a hurry, if Fed head Powell remains serious when he uttered earlier this week that “there won’t be any hesitation” to bring down inflation.

Bond yields eased during the latter part of this week with the 10-year hitting its lowest level in a month giving a small assist to the crushed bond holders, while Gold had a solid week but failed to reach its $1,900 level.  

Record high and continuously surging gas prices will unfortunately be with us and seem to be gaining upward momentum, as Bloomberg shows in this chart.

Despite all the negativity, there may be an equity bounce in our future due to balanced mutual funds having to do their monthly rebalancing towards the end of May, which should stoke the bullish theme—even though if only temporary.

Read More

Weekly StatSheet For The ETF Tracker Newsletter – Updated Through 05/19/2022

Ulli ETF StatSheet Contact

ETF Data updated through Thursday, May 19, 2022

Methodology/Use of this StatSheet:

1. From the universe of over 1,800 ETFs, I have selected only those with a trading volume of over $5 million per day (HV ETFs), so that liquidity and a small bid/ask spread are assured.

2. Trend Tracking Indexes (TTIs)

Buy or Sell decisions for Domestic and International ETFs (section 1 and 2), are made based on the respective TTI and its position either above or below its long-term M/A (Moving Average). A crossing of the trend line from below accompanied by some staying power above constitutes a “Buy” signal. Conversely, a clear break below the line constitutes a “Sell” signal. Additionally, I use an 12% trailing stop loss on all positions in these categories to control downside risk.

3. All other investment arenas do not have a TTI and should be traded based on the position of the individual ETF relative to its own respective trend line (%M/A). That’s why those signals are referred to as a “Selective Buy.” In other words, if an ETF crosses its own trendline to the upside, a “Buy” signal is generated. Here too, I recommend trailing sell stop of 12%, or less, depending on your risk tolerance.

If you are unfamiliar with some of the terminology, please see Glossary of Terms and new subscriber information in section 9.     

1. DOMESTIC EQUITY ETFs: SELL — since 02/24/2022

Click on chart to enlarge

Our main directional indicator, the Domestic Trend Tracking Index (TTI-green line in the above chart) has broken below its long-term trend line (red) by -8.79% and remains in “SELL” mode.  

Read More