
- Moving the markets
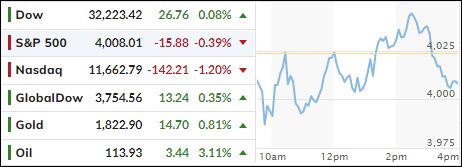
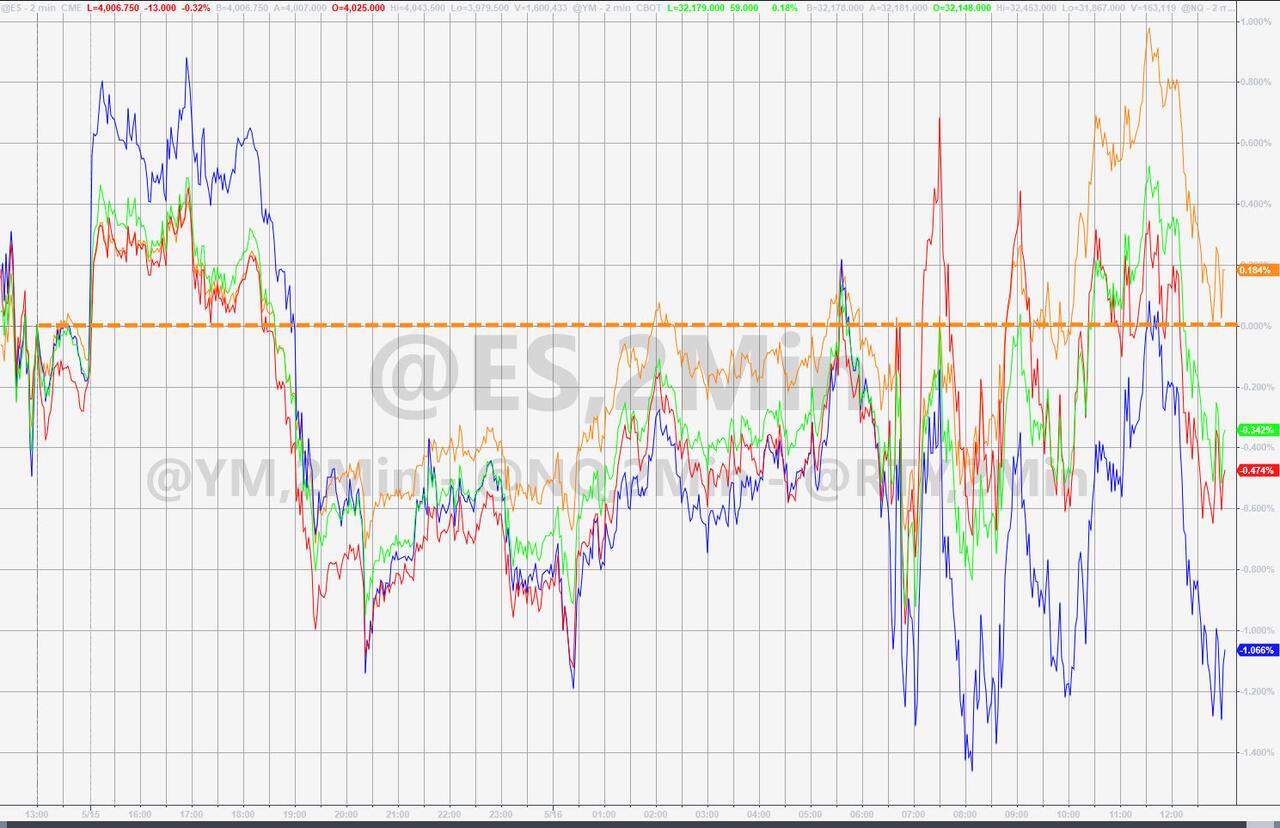
Friday’s rebound of hope found some support mid-session today, but suddenly lost steam and the major indexes headed back into the red except for the Dow, which eked out a small gain. It was another frustrating day for the bulls, with especially the Nasdaq getting hit hard again.
Trading was choppy as concerns of a slowing economy, along with higher interest rates and soaring inflation, have negatively influenced sentiment and appear to be permanent companions—at least for the foreseeable future. To no surprise, this has been a downer for all equity markets as MarketWatch pointed out:
The major averages have fallen well off their record highs. The Dow and S&P 500 are 12.3% and 16.3%, respectively, below all-time highs reached in January. The Nasdaq is squarely in bear market territory, down more than 27% from its November record.
According to ZH, the Empire Fed Manufacturing index bit the dust big time and dragged down the US Macro Surprise Index into the red for the first time since February.
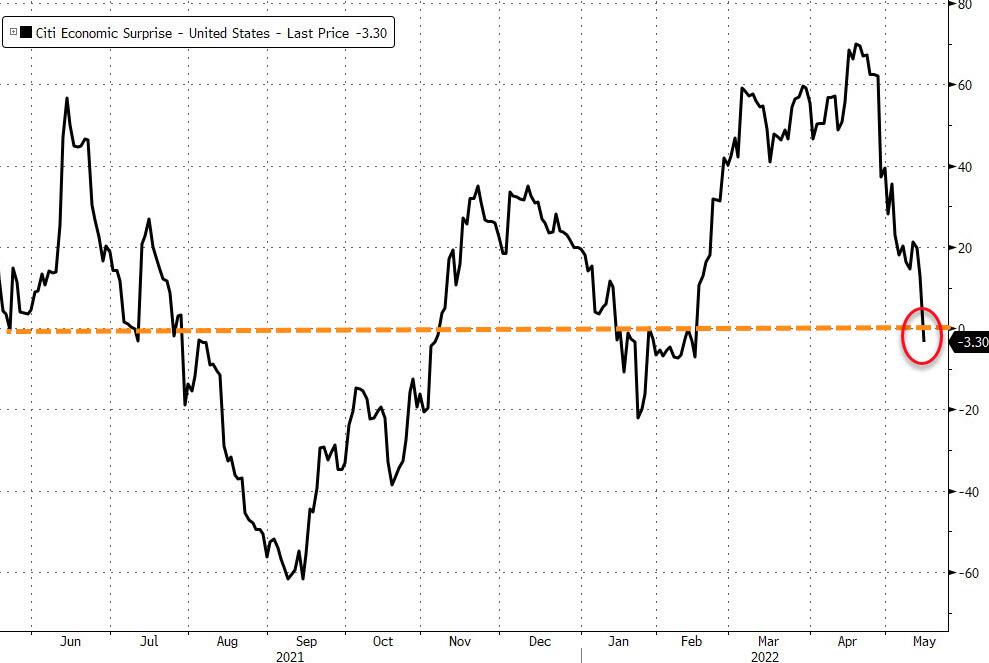
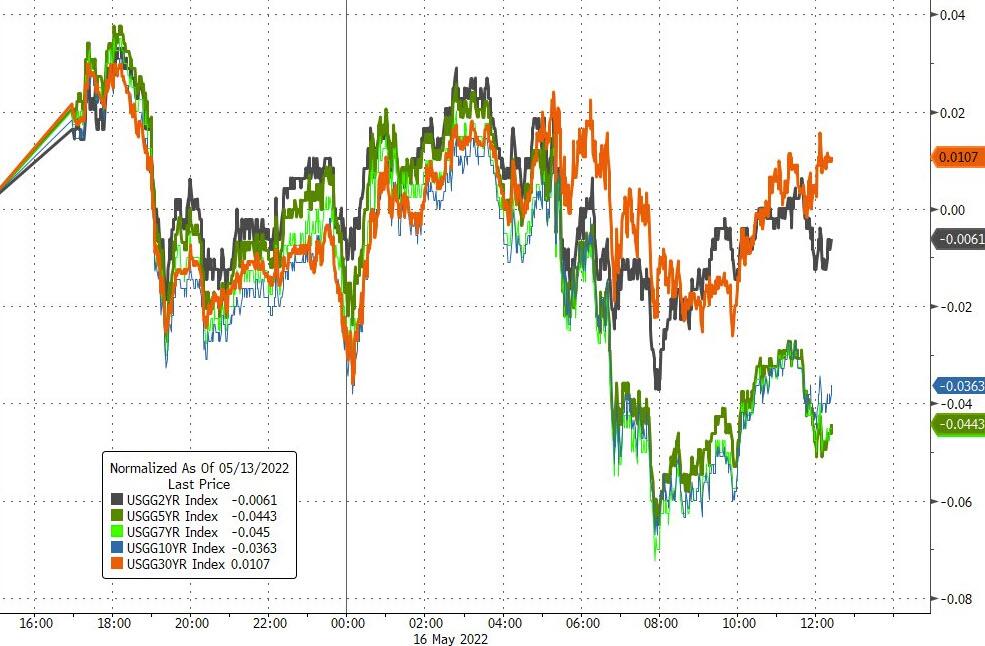
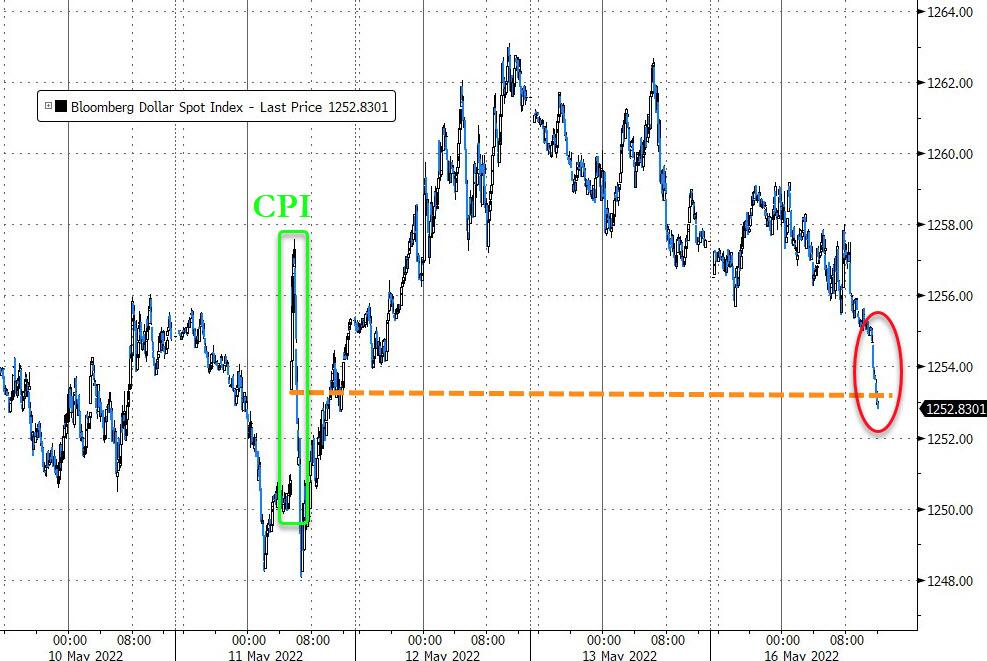
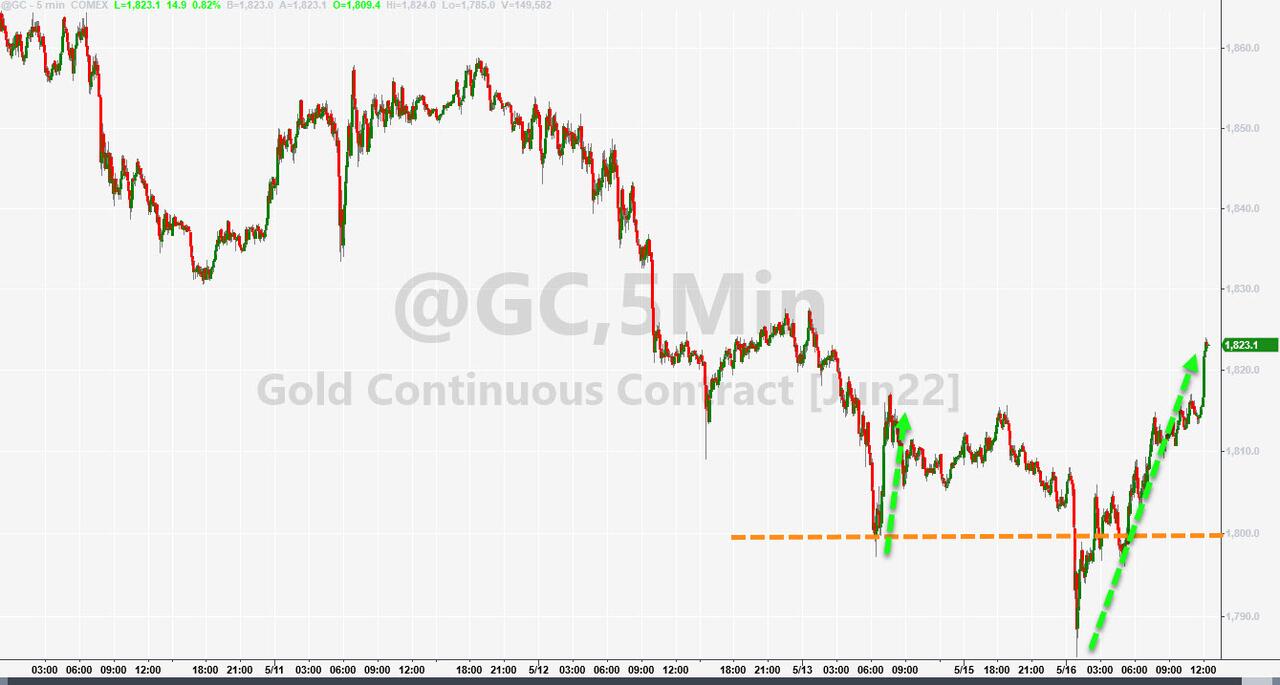
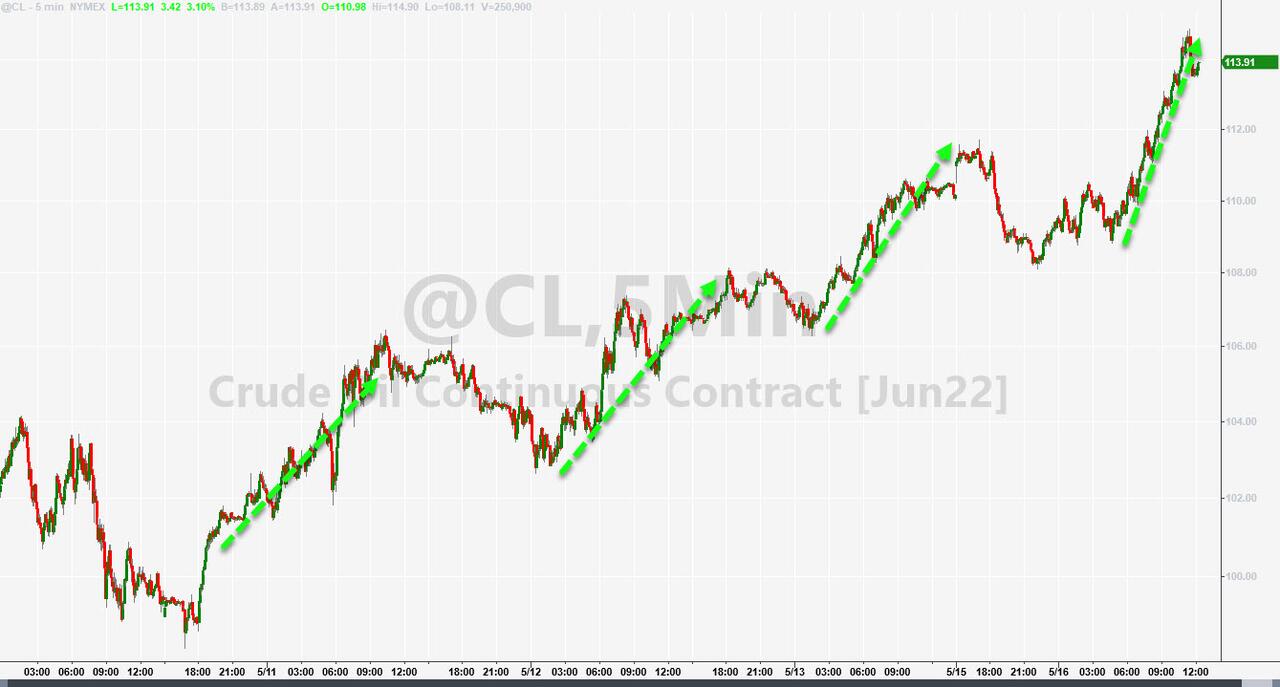
Bonds rallied a bit, as yields retreated, but the moves were tiny and still aided TBF, which rallies with rising yields, to a positive close. The US Dollar tumbled, as gold advanced to recapture its $1,800 level, followed by Crude Oil, which almost touched $115 intraday.
The best performer of the day, as you might have expected in this inflationary environment, were commodities with the DBC ETF scoring a solid +1.64% gain.
2. ETFs in the Spotlight
In case you missed the announcement and description of this section, you can read it here again.
It features some of the 10 broadly diversified domestic and sector ETFs from my HighVolume list as posted every Saturday. Furthermore, they are screened for the lowest MaxDD% number meaning they have been showing better resistance to temporary sell offs than all others over the past year.
The below table simply demonstrates the magnitude with which these ETFs are fluctuating above or below their respective individual trend lines (%+/-M/A). A break below, represented by a negative number, shows weakness, while a break above, represented by a positive percentage, shows strength.
For hundreds of ETF choices, be sure to reference Thursday’s StatSheet.
For this closed-out domestic “Buy” cycle (2/24/2022), here’s how some of our candidates have fared:
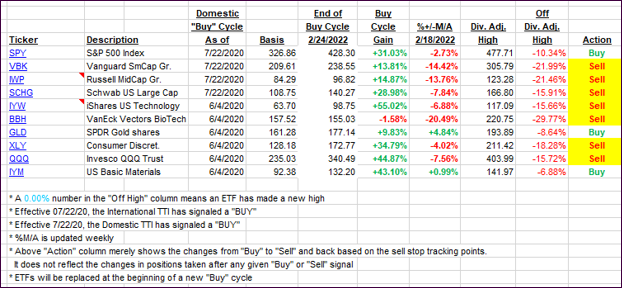
Click image to enlarge.
Again, the %+/-M/A column above shows the position of the various ETFs in relation to their respective long-term trend lines, while the trailing sell stops are being tracked in the “Off High” column. The “Action” column will signal a “Sell” once the -12% point has been taken out in the “Off High” column, which has replaced the prior -8% to -10% limits.
3. Trend Tracking Indexes (TTIs)
Our TTI’s were mixed during this failed comeback session, as the Domestic one slipped and the International one gained.
This is how we closed 05/16/2022:
Domestic TTI: -6.98% below its M/A (prior close -6.65%)—Sell signal effective 02/24/2022.
International TTI: -7.25% below its M/A (prior close -7.54%)—Sell signal effective 03/08/2022.
Disclosure: I am obliged to inform you that I, as well as my advisory clients, own some of the ETFs listed in the above table. Furthermore, they do not represent a specific investment recommendation for you, they merely show which ETFs from the universe I track are falling within the specified guidelines.
All linked charts above are courtesy of Bloomberg via ZeroHedge.
Contact Ulli