
- Moving the markets
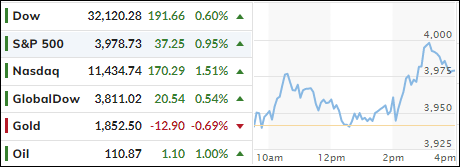
Nothing mattered today other the release of the Fed minutes. There were no surprises with the policy meeting notes showing that the Central Bank is prepared to raise rates further than anticipated.
This should have been reason enough for a sell off, but that did not happen. A deeper analysis of the minutes displayed some verbiage that possibly perhaps hinted at the Fed taking a pause of its hiking plan later this year.
That was enough to get the bullish juices flowing and the ensuing rally propelled the major indexes to intra-day highs, but momentum faded into the close. Still, all indexes managed to gain for the day.
Anxiety in the retail sector eased, as Nordstrom’s and Dick’s Sporting Goods surpassed earnings, with the former even raising its full-year outlook. Both stocks climbed on the news.
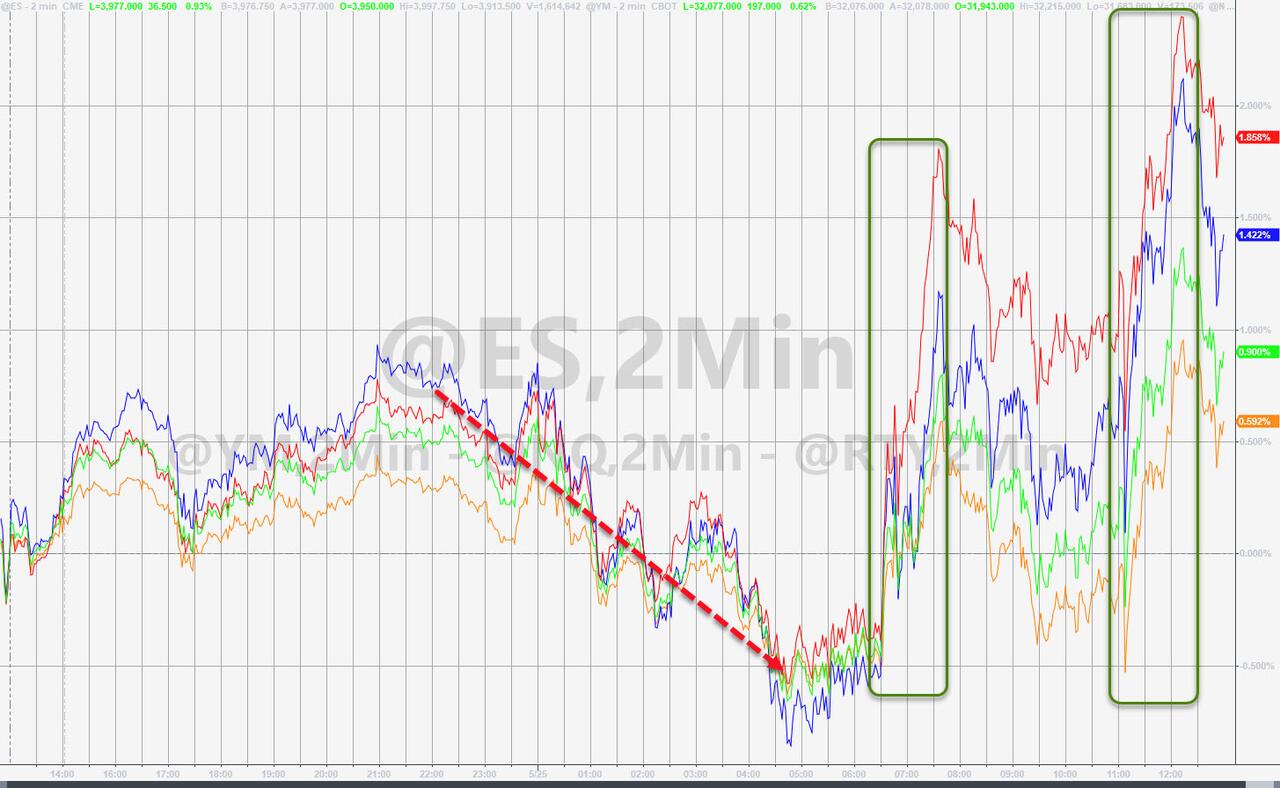
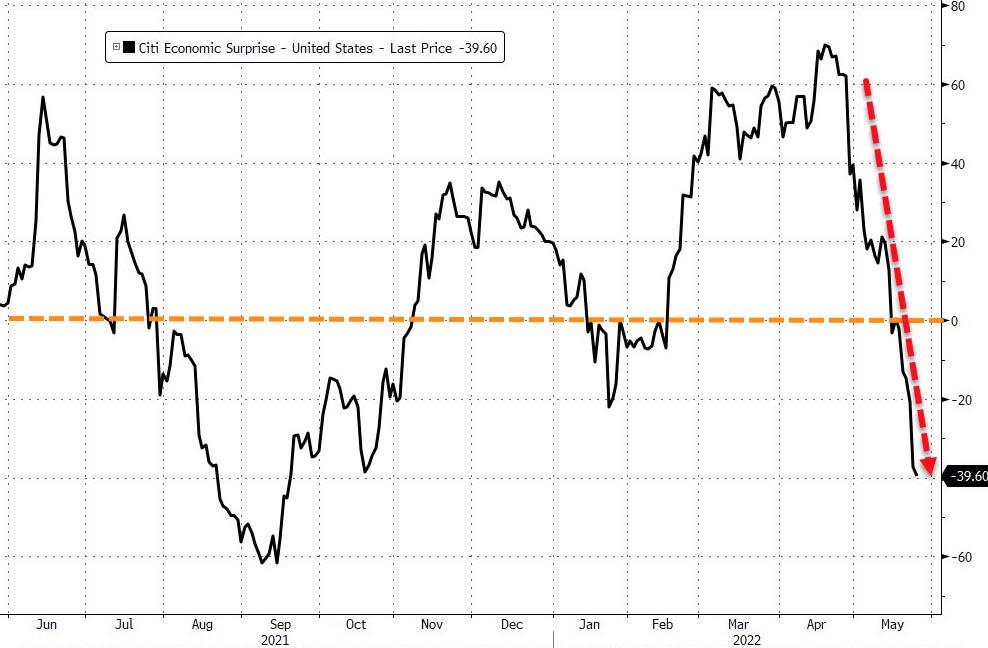
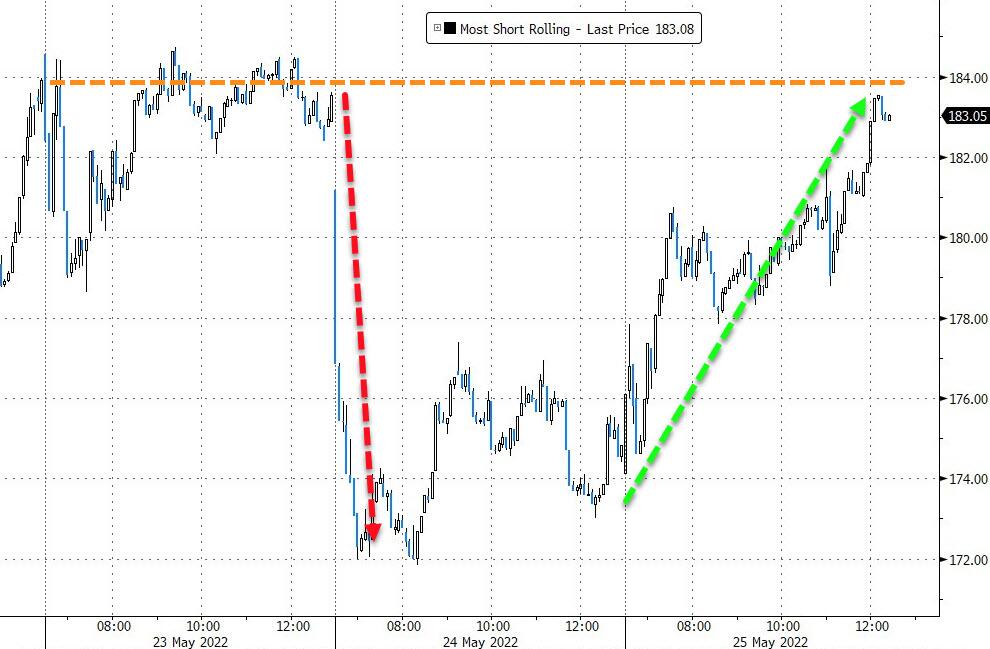
The tech sector saw support due to some good news from Intuit, DocuSign, and Zoom Video. However, Macro Data was dismal with Durable Goods numbers coming in below expectations, but, if you need bullish support, you can always count on a short squeeze, and today was no exception.
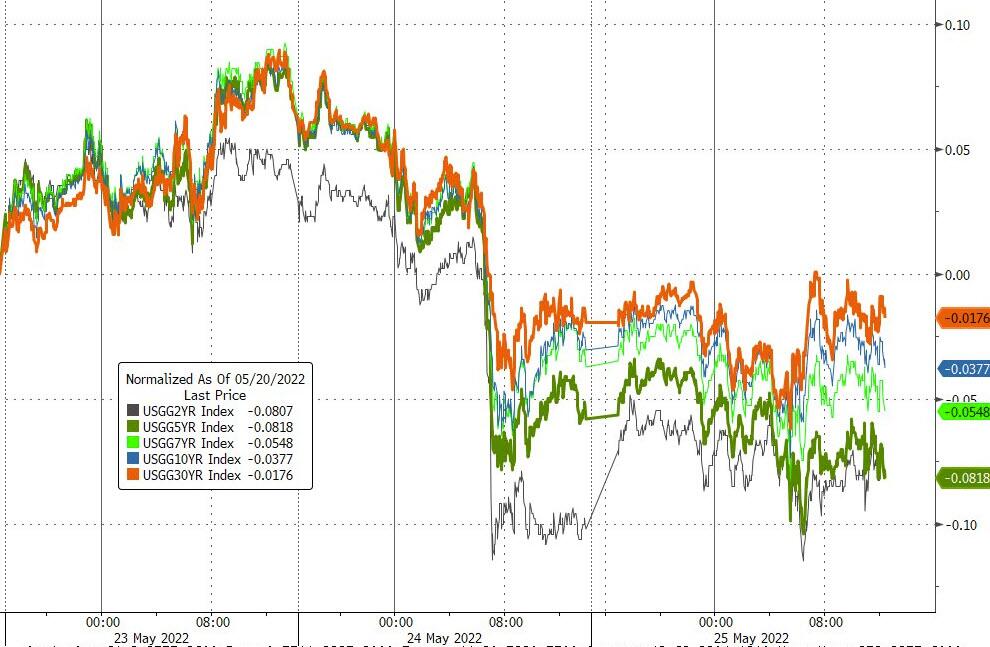
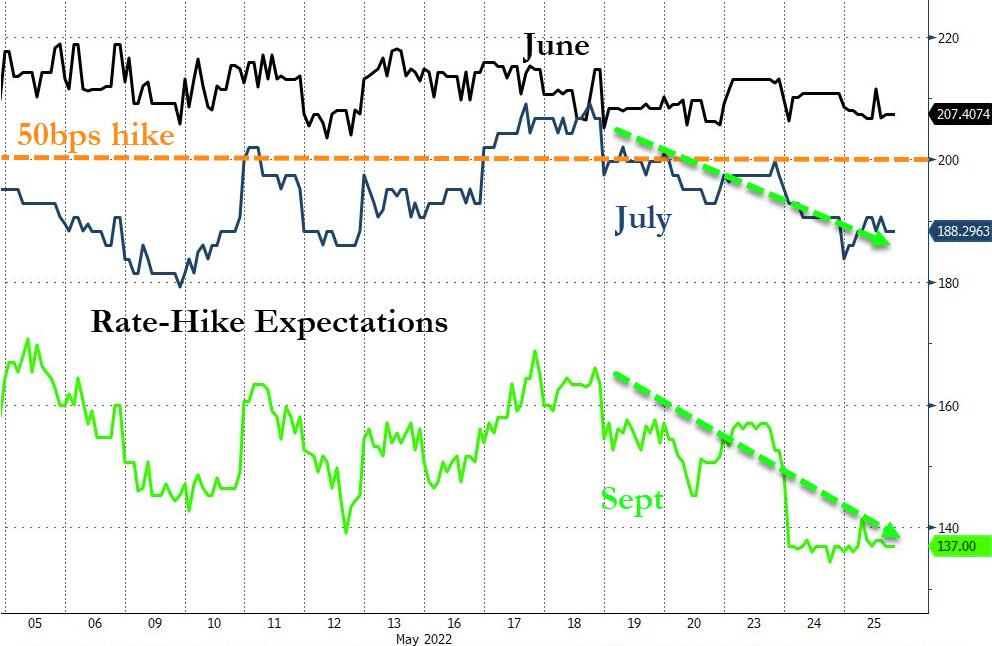
Bond yields slipped again, despite a 50-bps hike in rates for June being now a foregone conclusion. However, as ZeroHedge pointed out, the odds of another 50-bps hike in July are fading modestly and are tumbling for September.
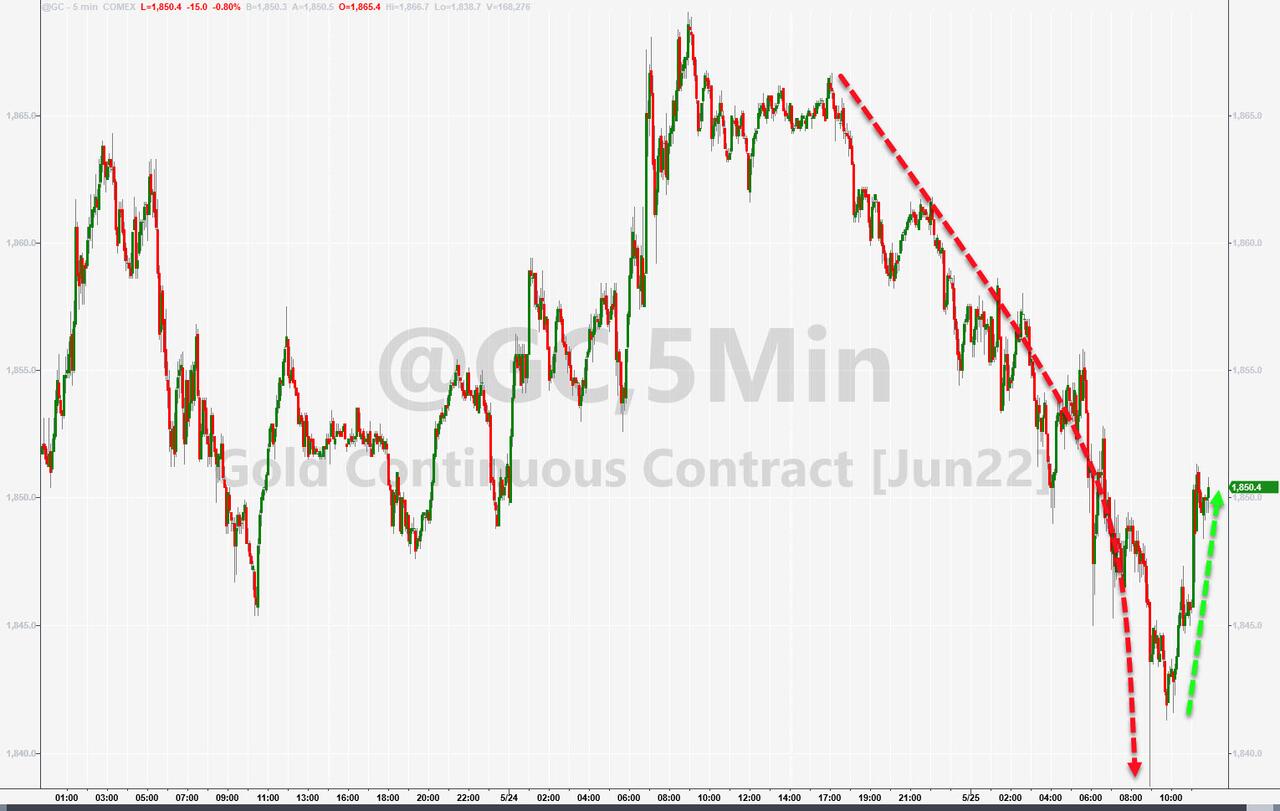
The US Dollar gained a tad but slipped into the close, while gold dipped and ripped but failed to reach its unchanged line.
ZH summed it up like this: Three more 50-bps hikes and then the Fed pauses… indefinitely; its next move a cut as the economic recession emerges from hiding.
2. ETFs in the Spotlight
In case you missed the announcement and description of this section, you can read it here again.
It features some of the 10 broadly diversified domestic and sector ETFs from my HighVolume list as posted every Saturday. Furthermore, they are screened for the lowest MaxDD% number meaning they have been showing better resistance to temporary sell offs than all others over the past year.
The below table simply demonstrates the magnitude with which these ETFs are fluctuating above or below their respective individual trend lines (%+/-M/A). A break below, represented by a negative number, shows weakness, while a break above, represented by a positive percentage, shows strength.
For hundreds of ETF choices, be sure to reference Thursday’s StatSheet.
For this closed-out domestic “Buy” cycle (2/24/2022), here’s how some of our candidates have fared:
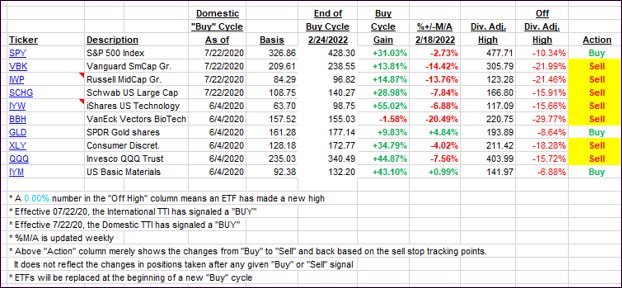
Click image to enlarge.
Again, the %+/-M/A column above shows the position of the various ETFs in relation to their respective long-term trend lines, while the trailing sell stops are being tracked in the “Off High” column. The “Action” column will signal a “Sell” once the -12% point has been taken out in the “Off High” column, which has replaced the prior -8% to -10% limits.
3. Trend Tracking Indexes (TTIs)
Our TTIs advanced due to the broad market holding on to its gains into the close.
This is how we closed 05/25/2022:
Domestic TTI: -6.85% below its M/A (prior close -7.91%)—Sell signal effective 02/24/2022.
International TTI: -5.71% below its M/A (prior close -6.21%)—Sell signal effective 03/08/2022.
Disclosure: I am obliged to inform you that I, as well as my advisory clients, own some of the ETFs listed in the above table. Furthermore, they do not represent a specific investment recommendation for you, they merely show which ETFs from the universe I track are falling within the specified guidelines.
All linked charts above are courtesy of Bloomberg via ZeroHedge.
Contact Ulli