
ETF Tracker StatSheet
You can view the latest version here.
AN AFTERNOON BOUNCE SAVES THE DAY BUT NOT THE WEEK
- Moving the markets
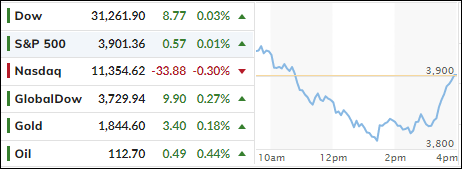
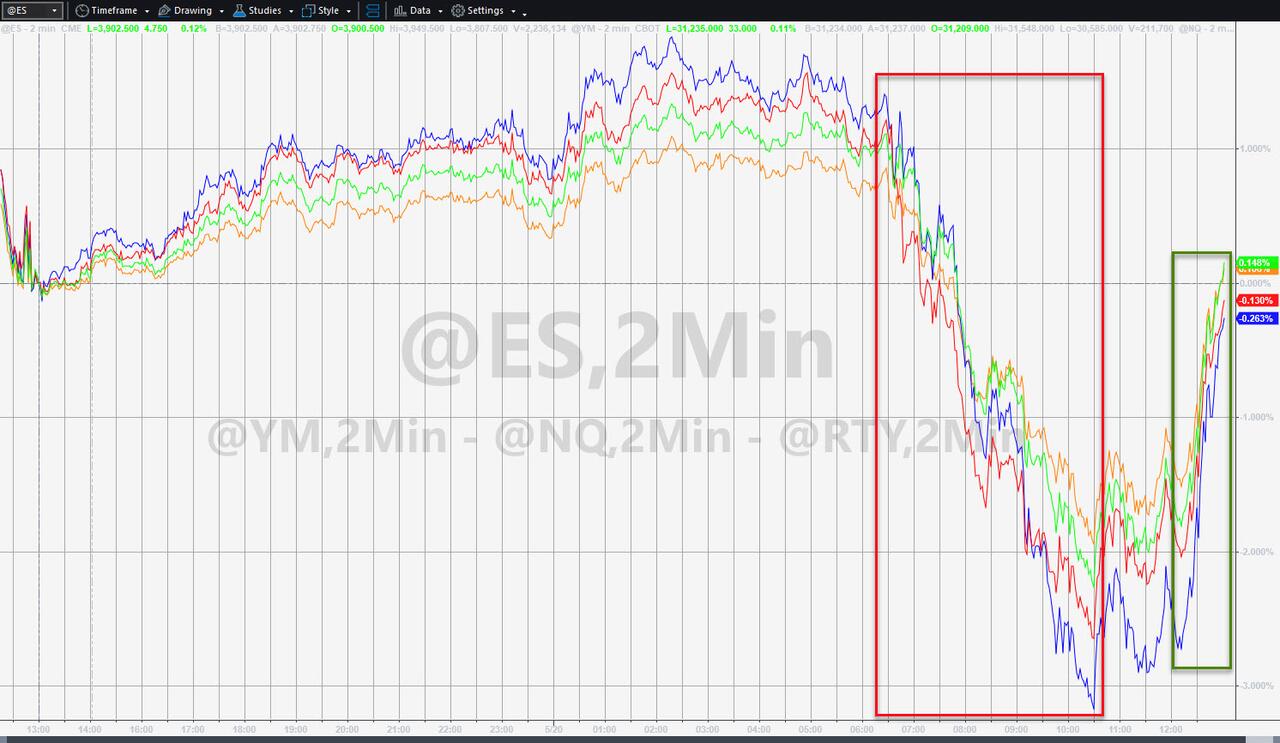
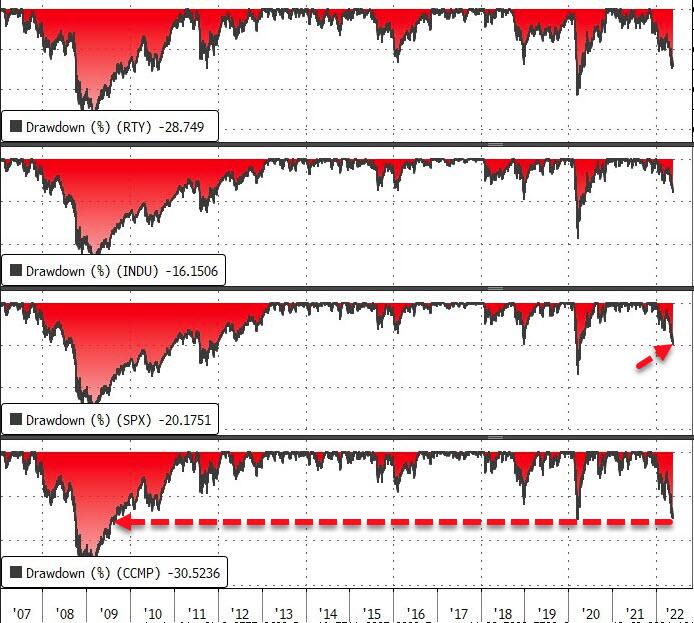
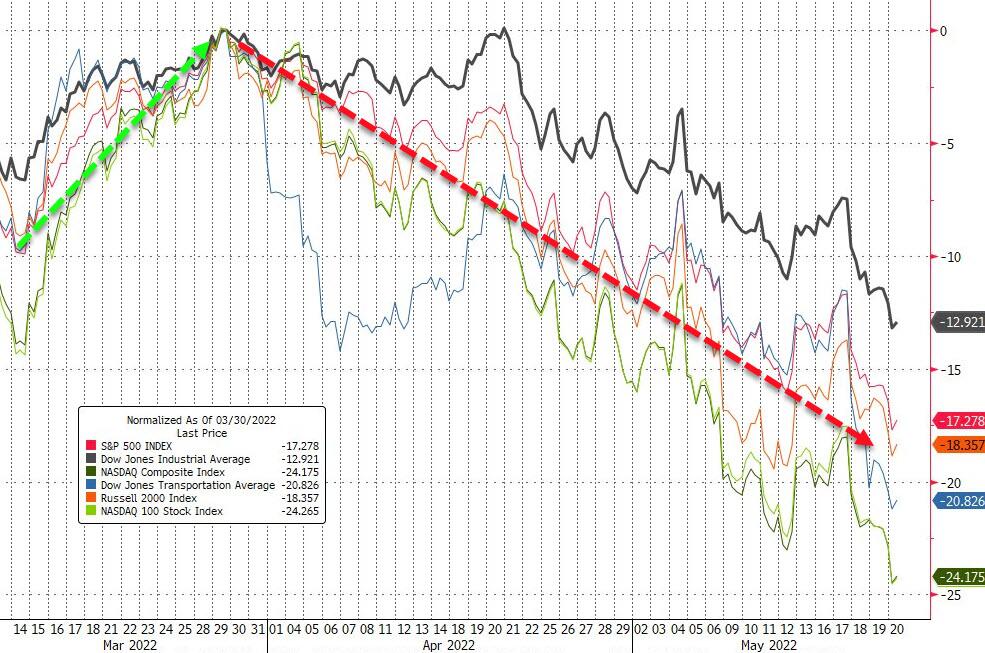
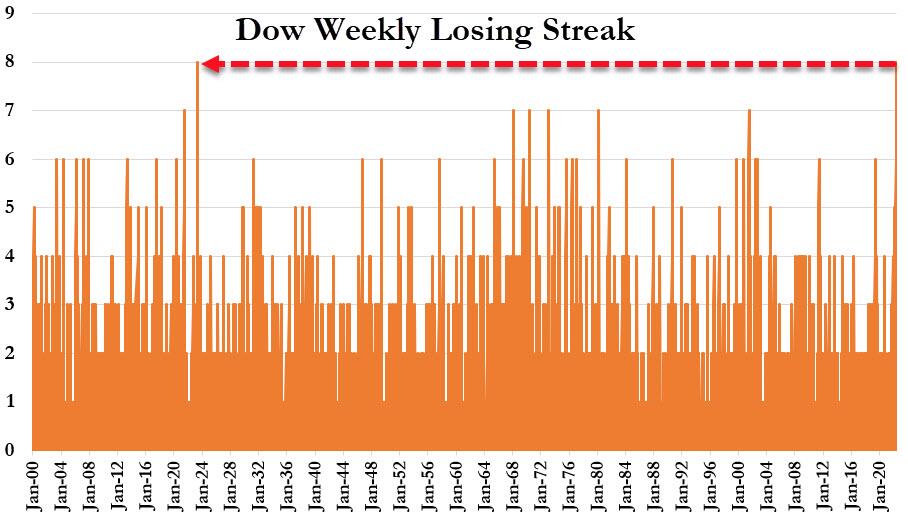
The market’s attempt at a comeback, after failing yesterday, was a success today as the Dow and S&P 500 managed to bounce back to their unchanged lines. Nevertheless, the S&P inched into bear market territory, which Wall Street defines as drop of 20% or more from its recent high. For the week, the index dropped more than 3%, the Nasdaq gave back 5%, while the Dow suffered its longest losing streak in 99 years.
Causing some of this week’s upheaval were back-to-back quarterly reports from Target and Walmart indicating that higher fuel costs and reduced consumer demand would hurt their bottom lines.
Both stocks were spanked on the news, as traders figured out that there might not be just 2 cockroaches that will be seeing the inflationary impact on earnings. And, as if on cue, Cisco followed suit and plunged on poor results.
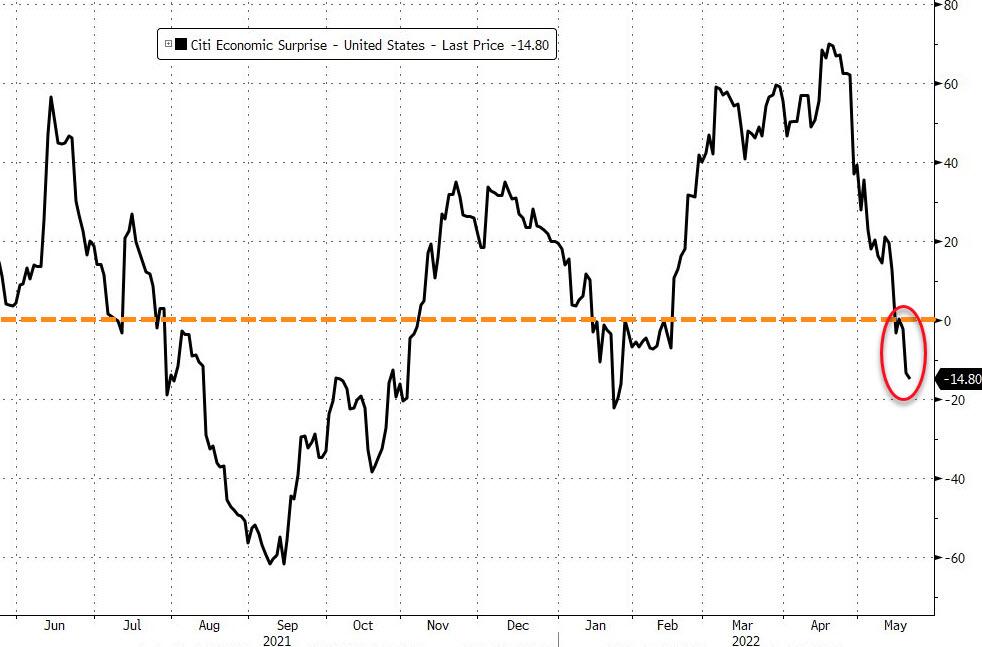
A hint that the economy is slowing was brought to the forefront yesterday when US jobless claims rose 218k for the week, causing a Deutsche Bank strategist to comment:
“In the event we slide into a recession imminently, we see the market selloff going well beyond average, i.e., into the upper half of the historical range and given elevated initial overvaluation, -35% to -40% or S&P 500 3000.”
We could get there in a hurry, if Fed head Powell remains serious when he uttered earlier this week that “there won’t be any hesitation” to bring down inflation.
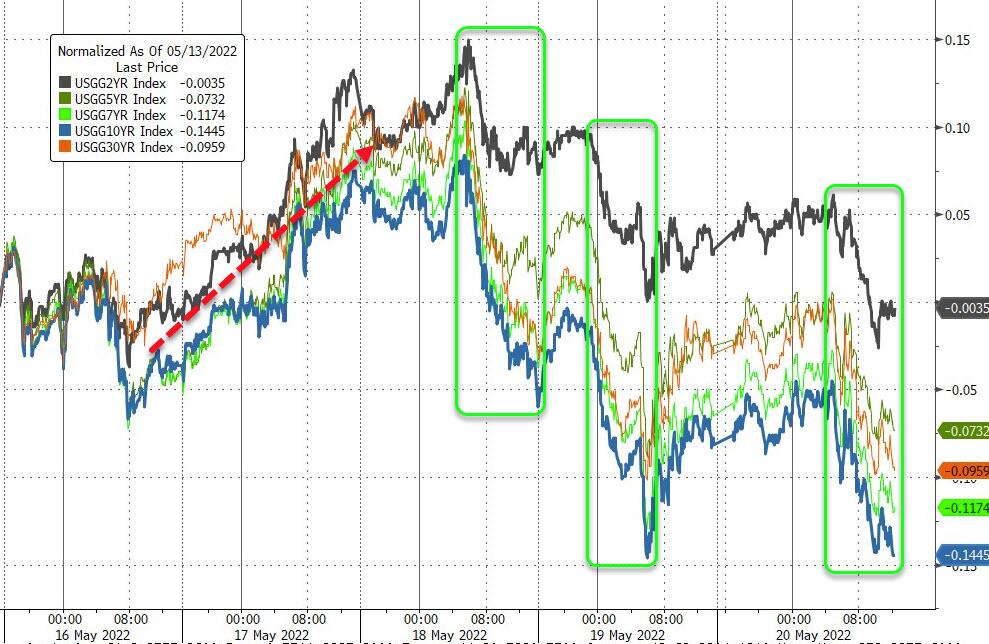
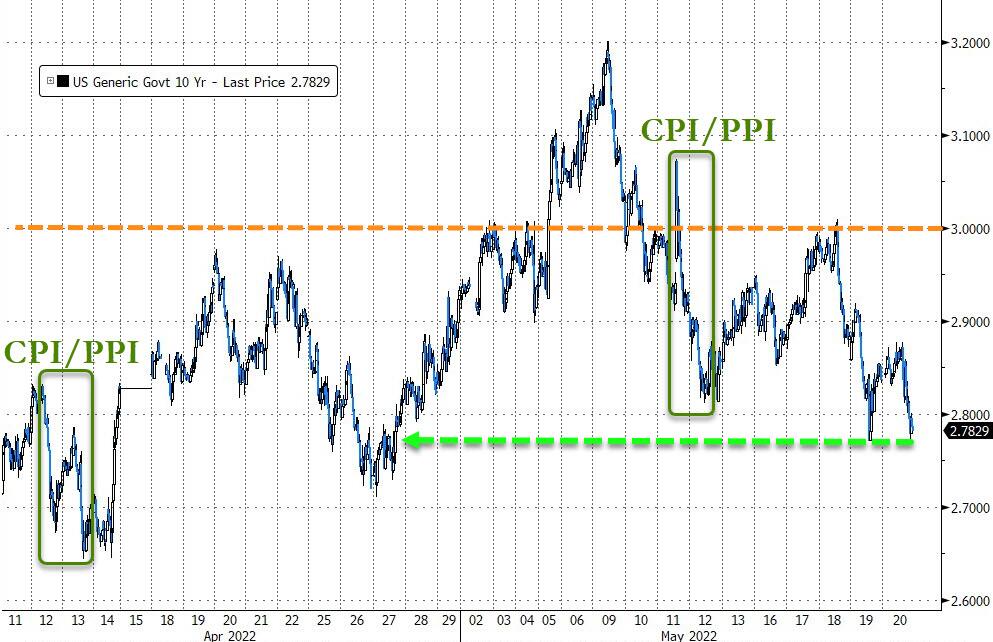
Bond yields eased during the latter part of this week with the 10-year hitting its lowest level in a month giving a small assist to the crushed bond holders, while Gold had a solid week but failed to reach its $1,900 level.
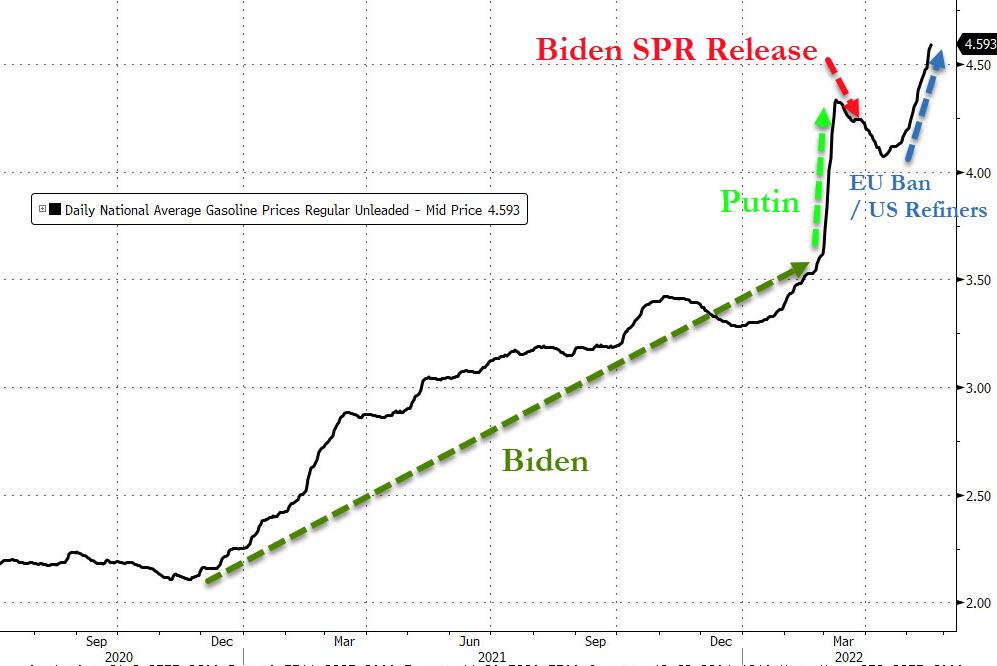
Record high and continuously surging gas prices will unfortunately be with us and seem to be gaining upward momentum, as Bloomberg shows in this chart.
Despite all the negativity, there may be an equity bounce in our future due to balanced mutual funds having to do their monthly rebalancing towards the end of May, which should stoke the bullish theme—even though if only temporary.
2. ETFs in the Spotlight
In case you missed the announcement and description of this section, you can read it here again.
It features some of the 10 broadly diversified domestic and sector ETFs from my HighVolume list as posted every Saturday. Furthermore, they are screened for the lowest MaxDD% number meaning they have been showing better resistance to temporary sell offs than all others over the past year.
The below table simply demonstrates the magnitude with which these ETFs are fluctuating above or below their respective individual trend lines (%+/-M/A). A break below, represented by a negative number, shows weakness, while a break above, represented by a positive percentage, shows strength.
For hundreds of ETF choices, be sure to reference Thursday’s StatSheet.
For this closed-out domestic “Buy” cycle (2/24/2022), here’s how some of our candidates have fared:
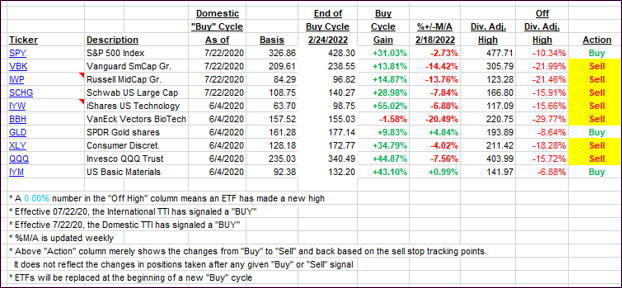
Click image to enlarge.
Again, the %+/-M/A column above shows the position of the various ETFs in relation to their respective long-term trend lines, while the trailing sell stops are being tracked in the “Off High” column. The “Action” column will signal a “Sell” once the -12% point has been taken out in the “Off High” column, which has replaced the prior -8% to -10% limits.
3. Trend Tracking Indexes (TTIs)
Our TTI’s changed only immaterially because a late rebound saved equities from further destruction.
This is how we closed 05/20/2022:
Domestic TTI: -8.63% below its M/A (prior close -8.79%)—Sell signal effective 02/24/2022.
International TTI: -7.73% below its M/A (prior close -8.13%)—Sell signal effective 03/08/2022.
Disclosure: I am obliged to inform you that I, as well as my advisory clients, own some of the ETFs listed in the above table. Furthermore, they do not represent a specific investment recommendation for you, they merely show which ETFs from the universe I track are falling within the specified guidelines.
All linked charts above are courtesy of Bloomberg via ZeroHedge.
———————————————————-
WOULD YOU LIKE TO HAVE YOUR INVESTMENTS PROFESSIONALLY MANAGED?
Do you have the time to follow our investment plans yourself? If you are a busy professional who would like to have his portfolio managed using our methodology, please contact me directly or get more details.
Contact Ulli