
- Moving the markets
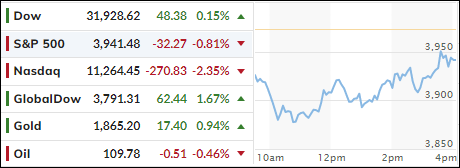
One look at the above chart tells the story of the day. With the Dow down over 450 points early in the session, a rebound attempt showed some promise, but it was only the Dow, which ended up at the unchanged line.
Even though the S&P 500 greatly reduced its early losses, the Nasdaq got spanked again and gave back more than it had gained during yesterday’s ramp-a-thon. Contributing to the index’s fall was social media’s SNAP (-41%), which warned that it’s bracing to miss not only earnings and revenue targets but also may slow down hiring.
Billionaire hedge fund guru Bill Ackman offered his view of the current state of Fed policy:
“If the Fed doesn’t do its job, the market will do the Fed’s job, and that is what is happening now. The only way to stop today’s raging inflation is with aggressive monetary tightening or with a collapse in the economy.”
After retail bellwethers Target and Walmart got pounded last week, due increasing labor and transportations costs, today, it was Abercrombie & Fitch’s turn to pick up the baton by announcing that freight and product costs weighed on sales. The punishment was quick, and the stock dropped some 31%.
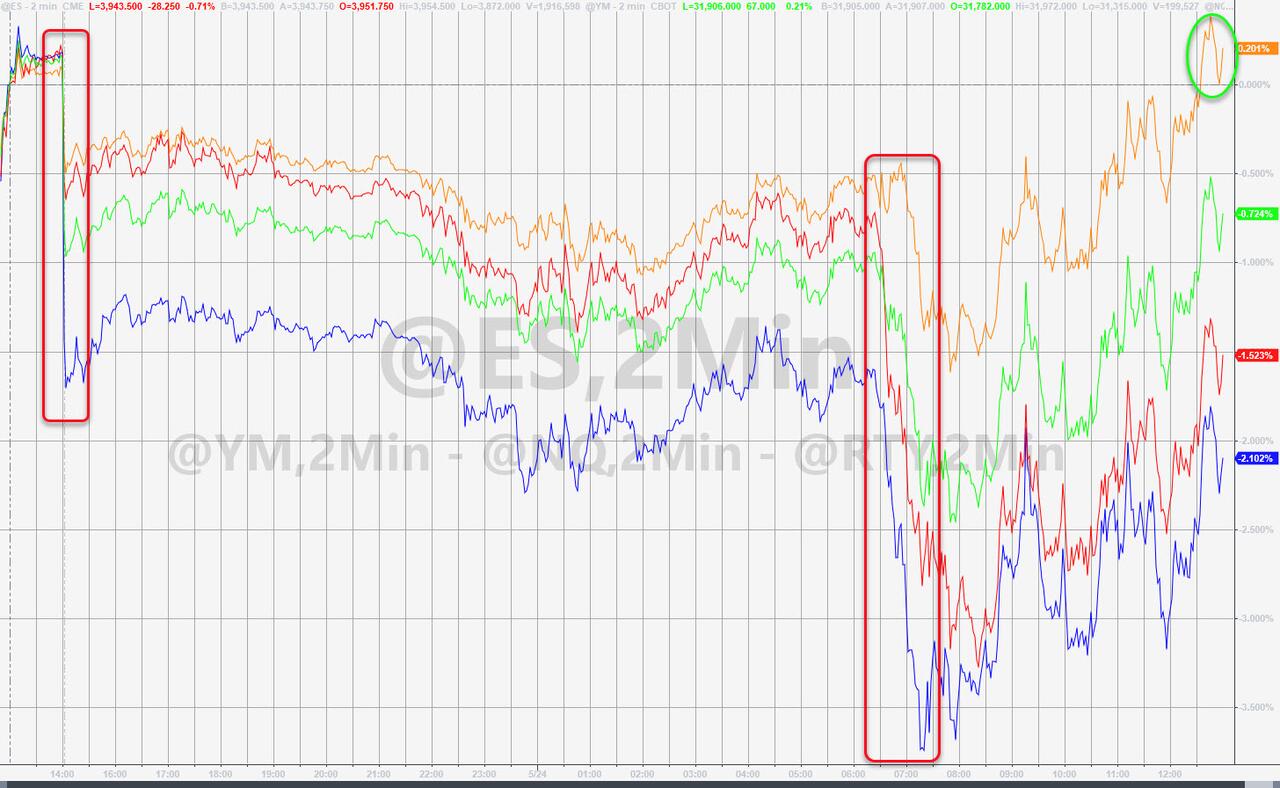
As ZeroHedge reported, the economy, as measured by the US Macro Surprise Index, crashed into negative territory and to its weakest since October 2021. That caused bond yields to fall with the 10-year dropping to 2.755% thereby giving the much maligned bond holders some reprieve, as the widely held bond ETF TLT rebounded +1.97%. But, that is only a small consolation given that this ETF is still down -21% YTD.
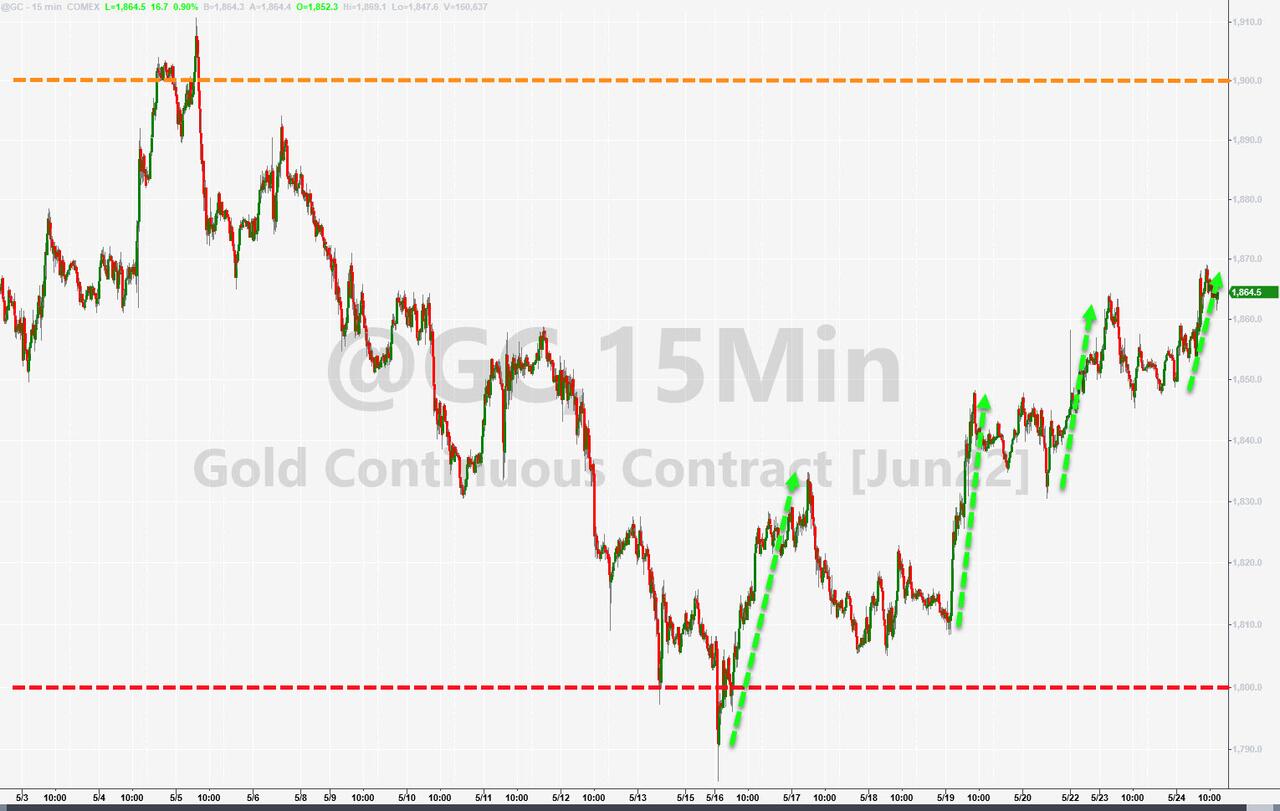
With recessionary expectations on the rise, gold benefited and gained +0.95% on the day, while the US Dollar continued its aimless meandering by falling to its lowest in a month.
2. ETFs in the Spotlight
In case you missed the announcement and description of this section, you can read it here again.
It features some of the 10 broadly diversified domestic and sector ETFs from my HighVolume list as posted every Saturday. Furthermore, they are screened for the lowest MaxDD% number meaning they have been showing better resistance to temporary sell offs than all others over the past year.
The below table simply demonstrates the magnitude with which these ETFs are fluctuating above or below their respective individual trend lines (%+/-M/A). A break below, represented by a negative number, shows weakness, while a break above, represented by a positive percentage, shows strength.
For hundreds of ETF choices, be sure to reference Thursday’s StatSheet.
For this closed-out domestic “Buy” cycle (2/24/2022), here’s how some of our candidates have fared:
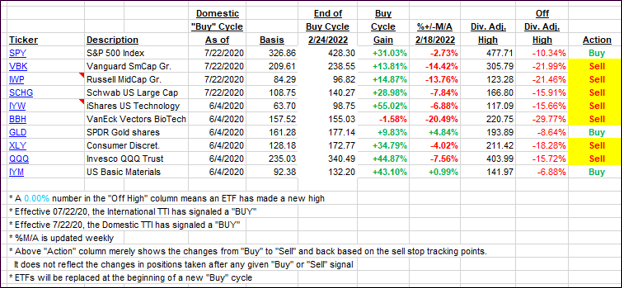
Click image to enlarge.
Again, the %+/-M/A column above shows the position of the various ETFs in relation to their respective long-term trend lines, while the trailing sell stops are being tracked in the “Off High” column. The “Action” column will signal a “Sell” once the -12% point has been taken out in the “Off High” column, which has replaced the prior -8% to -10% limits.
3. Trend Tracking Indexes (TTIs)
Our TTI’s improved, as the bulls finally saw upward momentum hold into the close.
This is how we closed 05/24/2022:
Our TTIs slipped, as the rebound attempt was not able to produce green results.
Domestic TTI: -7.91% below its M/A (prior close -7.34%)—Sell signal effective 02/24/2022.
International TTI: -6.21% below its M/A (prior close -5.94%)—Sell signal effective 03/08/2022.
Disclosure: I am obliged to inform you that I, as well as my advisory clients, own some of the ETFs listed in the above table. Furthermore, they do not represent a specific investment recommendation for you, they merely show which ETFs from the universe I track are falling within the specified guidelines.
All linked charts above are courtesy of Bloomberg via ZeroHedge.
Contact Ulli