
ETF Tracker StatSheet
You can view the latest version here.
DEBT DEAL FLOPS, NASDAQ POPS, AND GOLD TOPS
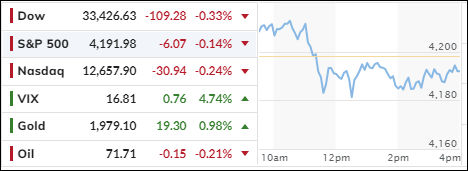
[Chart courtesy of MarketWatch.com]
- Moving the markets
The markets went crazy this week, jumping up and down on every rumor of a debt ceiling deal. The Nasdaq (small caps) was especially nuts, soaring to new highs even as interest rates spiked. What were they thinking?
Their bubble burst today, when the Republicans walked out of the talks, throwing cold water on the hopes of avoiding a US default. Oops.
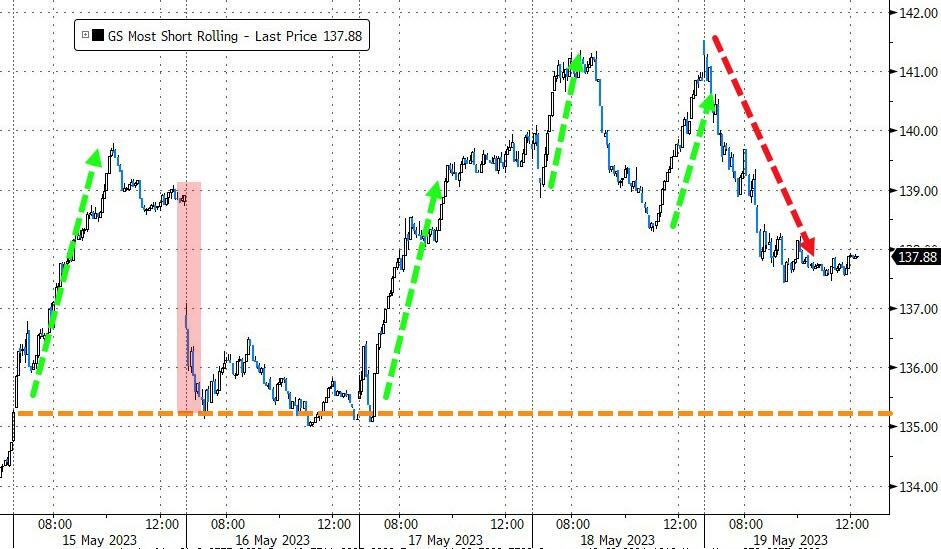
ZeroHedge had it right: there will be no deal until the market freaks out. And today’s rally was just a massive Nasdaq squeeze, the biggest since 2014!
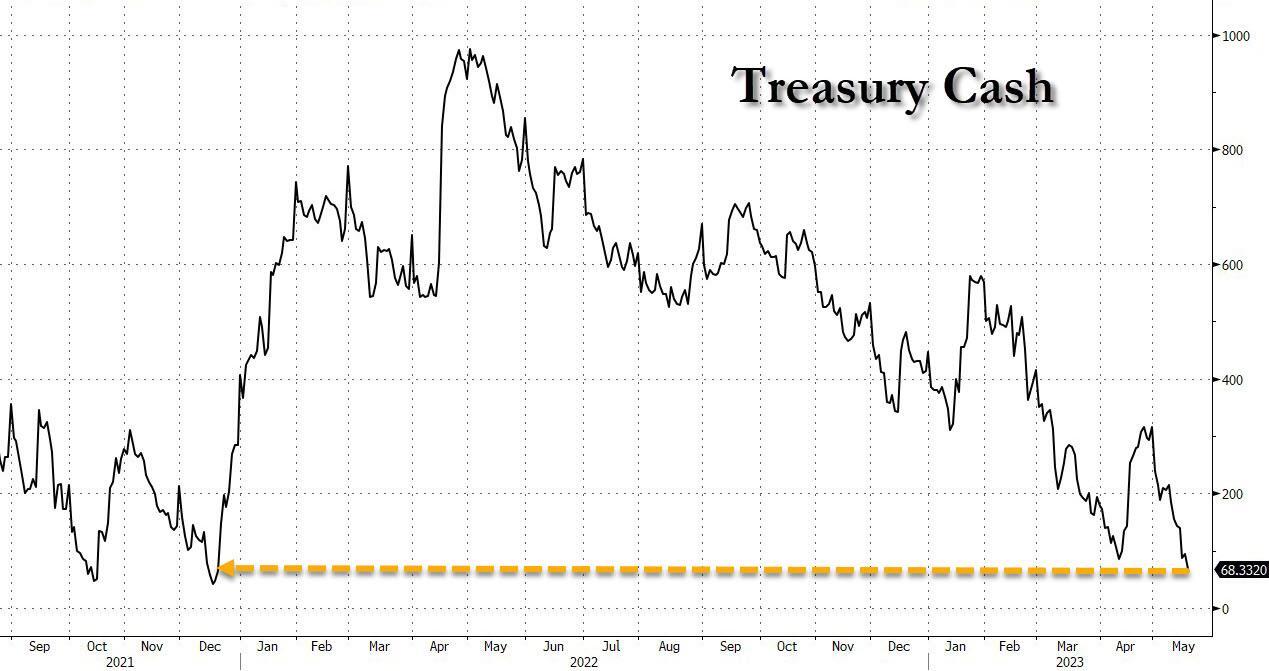
Meanwhile, the Treasury is running out of cash fast, with only $18 billion left before hitting the $50 billion danger zone. Yellen tried to calm the nerves by saying we might see more bank mergers soon. Yeah, right. That means more banks are going under!
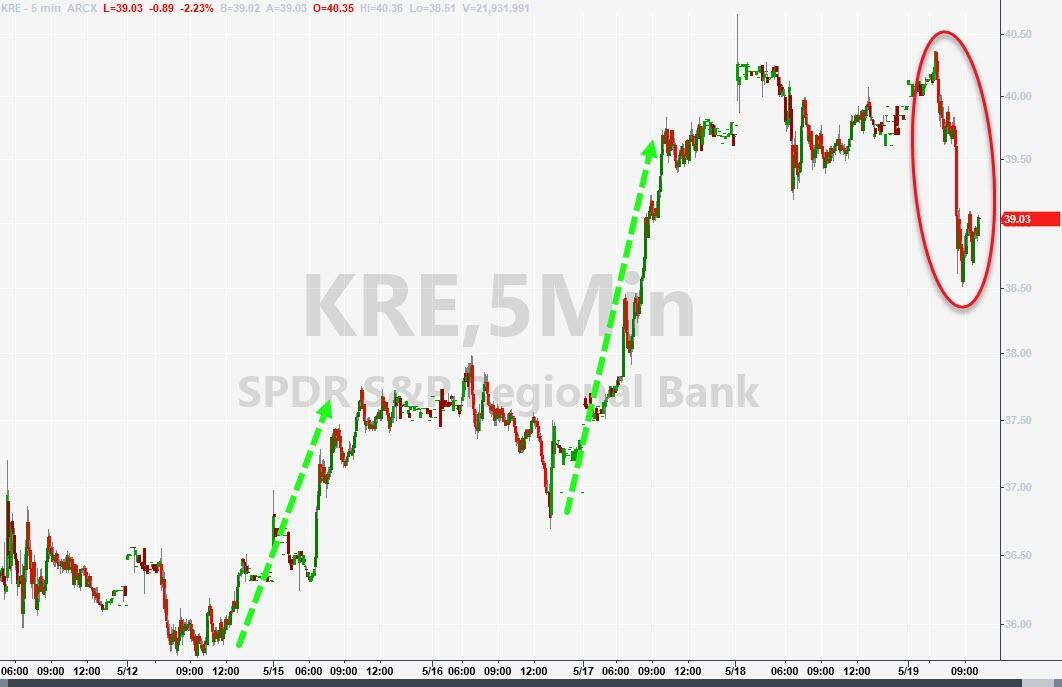
No wonder bank stocks tanked today, with the Regional Banking ETF KRE losing over 2%. That index is down -33.41% YTD, even after this week’s 8% bounce.
This week’s rally was also helped by a huge short-squeeze, but that ran out of steam today. Tech stocks did well, but retail stocks did poorly, signaling weak consumer spending ahead. This is not new. We saw this in 2011, and the S&P 500 ended up losing big.
Bond yields rose sharply this week, with the 2-year hitting its highest level since June 2022, as ZH noted. The US Dollar followed suit but retreated today. Gold had a rough week, but recovered today with a nearly 1% gain, as some sanity returned to the markets.
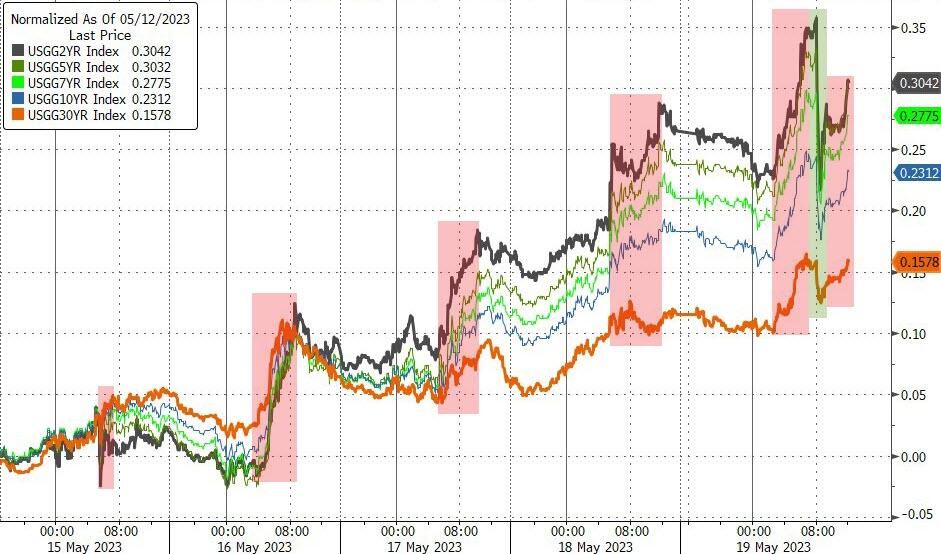
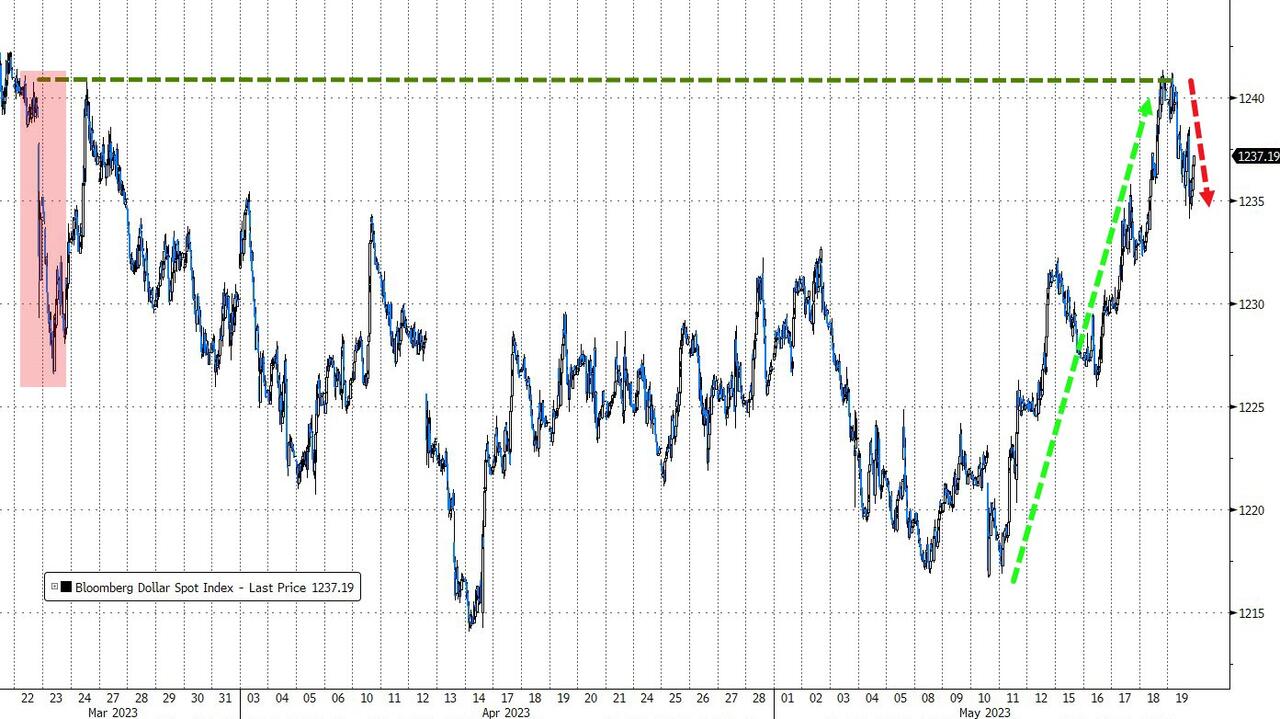
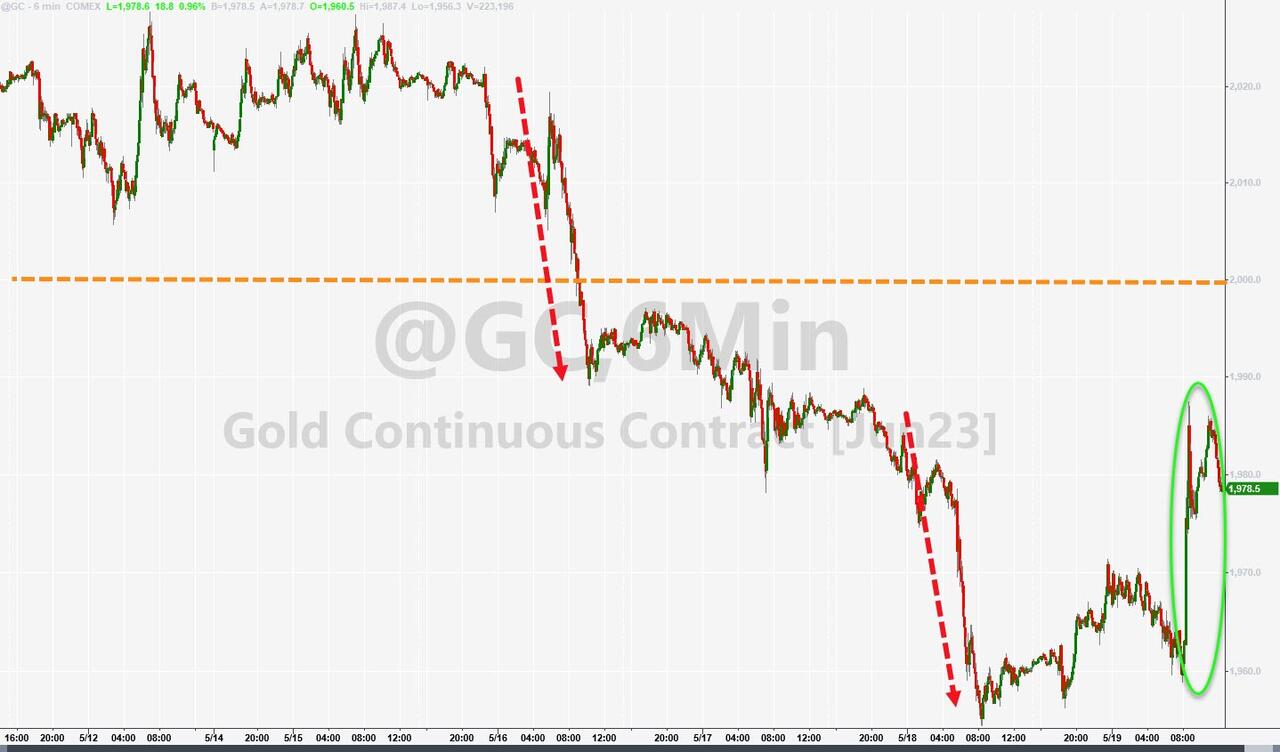
The bottom line: don’t get too excited about stocks. The mood could change in a heartbeat from optimism to pessimism.
2. “Buy” Cycle Suggestions
For the current Buy cycle, which started on 12/1/2022, I suggested you reference my then current StatSheet for ETF selections. However, if you came on board later, you may want to look at the most recent version, which is published and posted every Thursday at 6:30 pm PST.
I also recommend you consider your risk tolerance when making your selections by dropping down more towards the middle of the M-Index rankings, should you tend to be more risk adverse. Likewise, a partial initial exposure to the markets, say 33% to start with, will reduce your risk in case of a sudden directional turnaround.
We are living in times of great uncertainty, with economic fundamentals steadily deteriorating, which will eventually affect earnings negatively and, by association, stock prices.
In my advisor’s practice, we are therefore looking for limited exposure in value, some growth and dividend ETFs. Of course, gold has been a core holding for a long time.
With all investments, I recommend the use of a trailing sell stop in the range of 8-12% to limit your downside risk.
3. Trend Tracking Indexes (TTIs)
Our TTIs slipped by a tiny margin, as an early morning rally bit the dust.
This is how we closed 05/19/2023:
Domestic TTI: +0.79% above its M/A (prior close +0.97%)—Buy signal effective 12/1/2022.
International TTI: +5.89% above its M/A (prior close +5.90%)—Buy signal effective 12/1/2022.
All linked charts above are courtesy of Bloomberg via ZeroHedge.
———————————————————-
WOULD YOU LIKE TO HAVE YOUR INVESTMENTS PROFESSIONALLY MANAGED?
Do you have the time to follow our investment plans yourself? If you are a busy professional who would like to have his portfolio managed using our methodology, please contact me directly to get more details.
Contact Ulli