
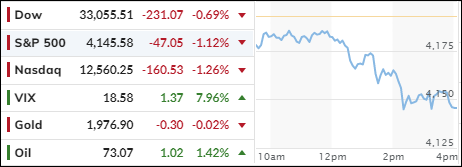
[Chart courtesy of MarketWatch.com]
- Moving the markets
The clock is ticking for the US government to raise the debt ceiling, but there is still no sign of a deal. This uncertainty weighed on the markets, which closed in the red. Unless the politicians stop playing chicken and reach an agreement before June 1st, we could see more volatility and weakness ahead.
The talks between the parties have been described as “productive” and “professional”, but that sounds like diplomatic code for “we’re not getting anywhere”. This does not inspire confidence in our ability to manage our economy sensibly.
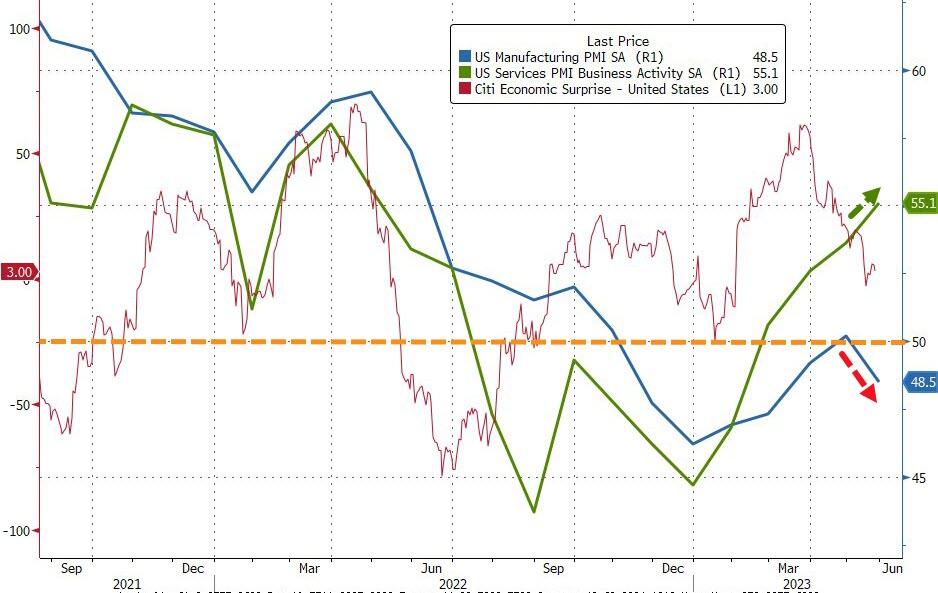
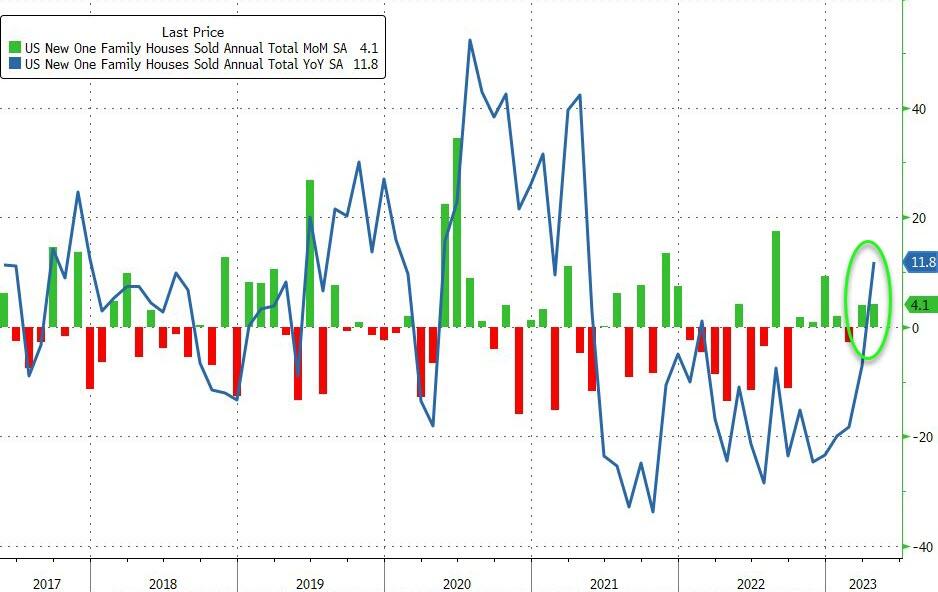
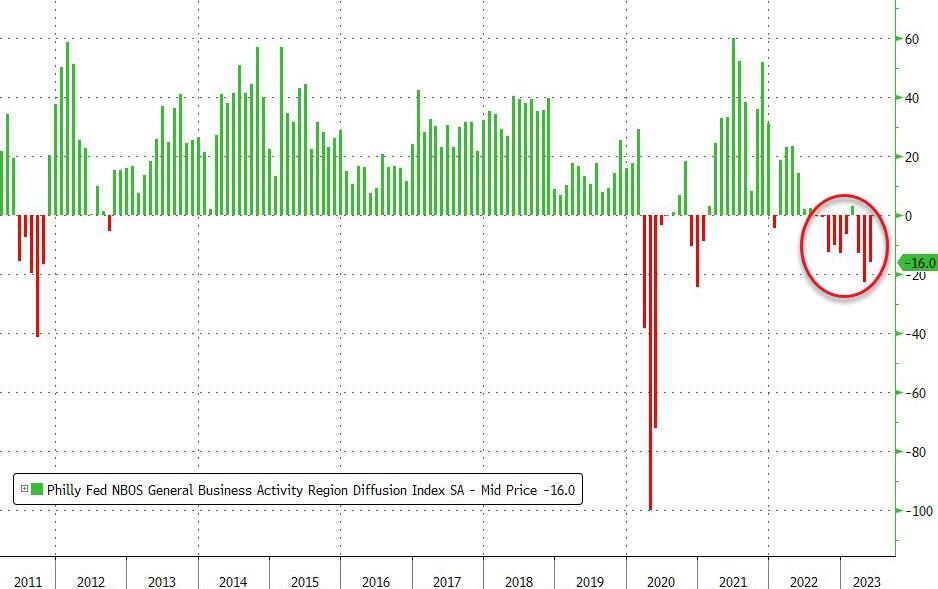
The economic data was also mixed, with some signs of strength and some signs of weakness. The service sector expanded at its fastest pace in over a year, but the manufacturing sector shrank again. New home sales jumped in April, but the Fed’s service index fell. These conflicting signals suggest that we might be heading for stagflation, a nasty combination of low growth and high inflation.
So why have the stock indexes been rising despite this gloomy picture?
According to analyst Peter Schiff, it’s because investors are betting on the Fed to cut interest rates in response to a looming recession. He says:
The stock market going up is not a sign of a strong economy. It’s actually the reverse. The reason the stock market is going up is because investors expect a recession, and they expect the Fed to cut rates at some point due to that recession.
But this optimism may be misplaced, as a failed attempt to trigger a short squeeze showed. The markets dove in the afternoon, as reality set in. As ZeroHedge pointed out, financial conditions have tightened, something that the Nasdaq has ignored by diverging from reality.
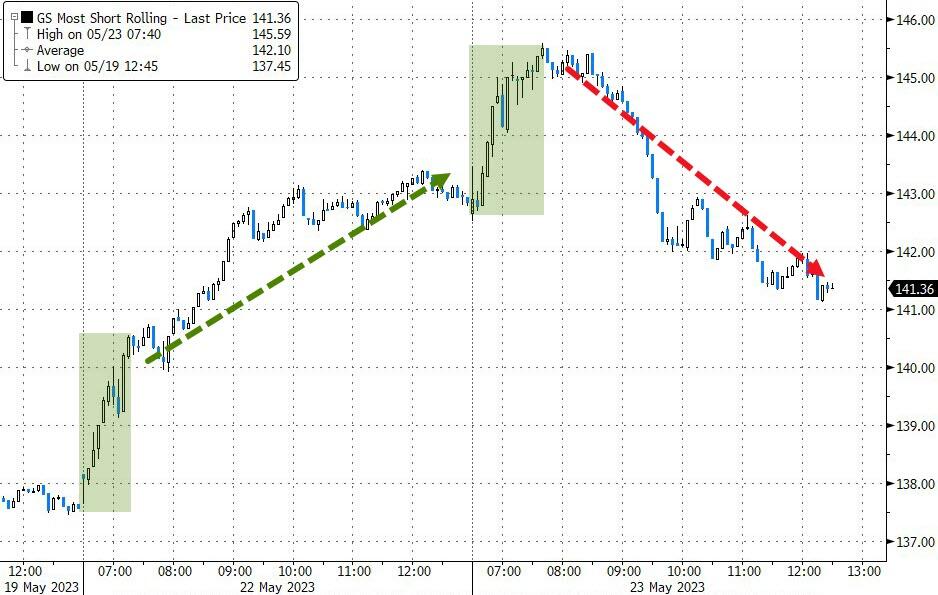
How long can this last?
The bond market was also mixed, with the 30-year yield briefly touching 4% for the first time since March, but then falling back. The US dollar edged higher, and gold ended flat after recovering from an early drop.
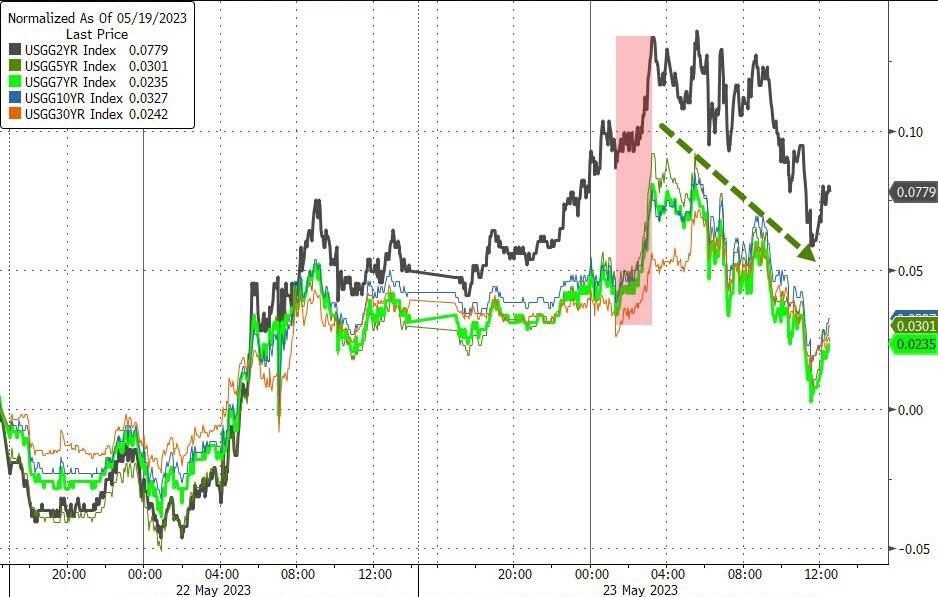
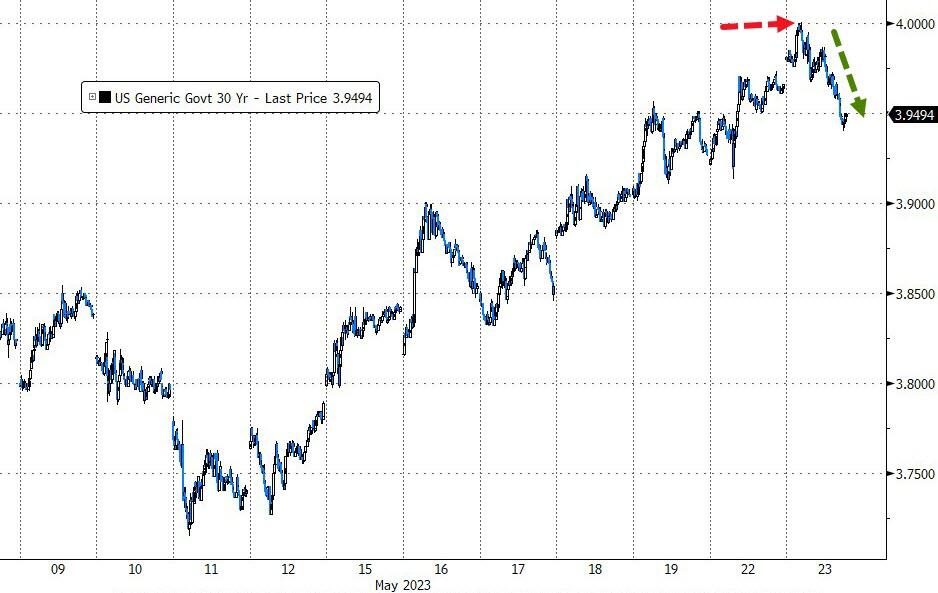
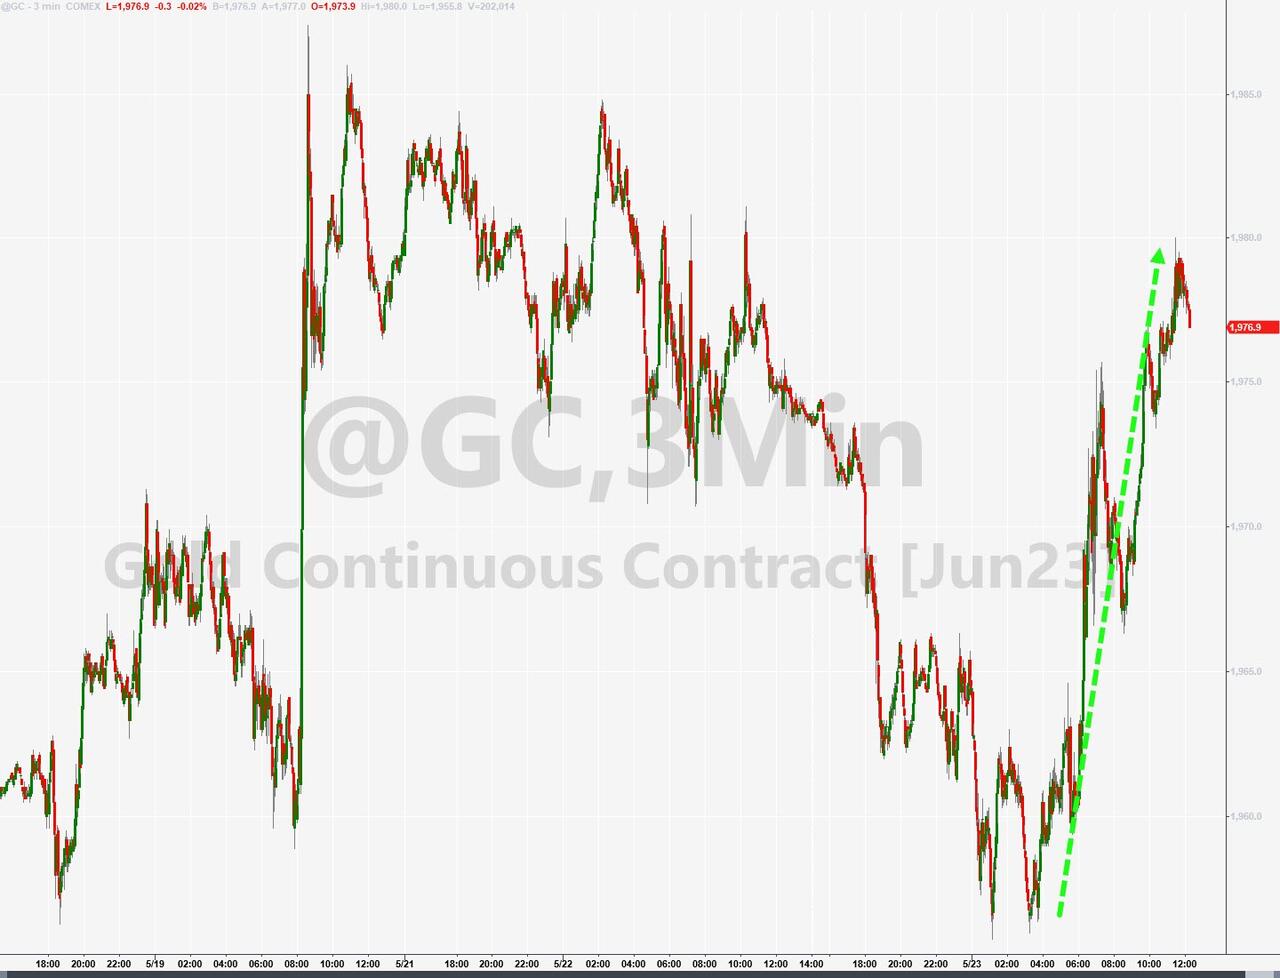
2. “Buy” Cycle Suggestions
For the current Buy cycle, which started on 12/1/2022, I suggested you reference my then current StatSheet for ETF selections. However, if you came on board later, you may want to look at the most recent version, which is published and posted every Thursday at 6:30 pm PST.
I also recommend you consider your risk tolerance when making your selections by dropping down more towards the middle of the M-Index rankings, should you tend to be more risk adverse. Likewise, a partial initial exposure to the markets, say 33% to start with, will reduce your risk in case of a sudden directional turnaround.
We are living in times of great uncertainty, with economic fundamentals steadily deteriorating, which will eventually affect earnings negatively and, by association, stock prices.
In my advisor’s practice, we are therefore looking for limited exposure in value, some growth and dividend ETFs. Of course, gold has been a core holding for a long time.
With all investments, I recommend the use of a trailing sell stop in the range of 8-12% to limit your downside risk.
3. Trend Tracking Indexes (TTIs)
Our TTIs reversed with the Domestic once again sinking below its long-term trend line, as the sideways pattern continues. Very likely, we will not see a clear direction develop until the debt ceiling saga has been resolved.
This is how we closed 05/23/2023:
Domestic TTI: -0.12% below its M/A (prior close +0.95%)—Buy signal effective 12/1/2022.
International TTI: +5.07% above its M/A (prior close +5.86%)—Buy signal effective 12/1/2022.
All linked charts above are courtesy of Bloomberg via ZeroHedge.
Contact Ulli