
[Chart courtesy of MarketWatch.com]
- Moving the markets
The markets were in a frenzy as the debt ceiling deadline loomed closer. Speaker McCarthy blamed the other side for delaying the talks and hoped for some progress today. Yeah, right.
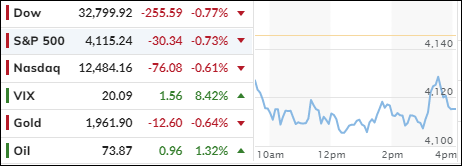
The uncertainty drove the investors to dump their stocks and bonds, sending the major indexes lower for the second day in a row. Everything was in the red, and no one wanted to stick around.
The Fed minutes showed some doubt about raising rates in June. It all depended on the data. But who cared about the data when the government was on the verge of defaulting?
Treasury Secretary Yellen warned of market stress and urged Congress to act fast. She said the Administration was not planning for a default, but for a deal. Good luck with that.
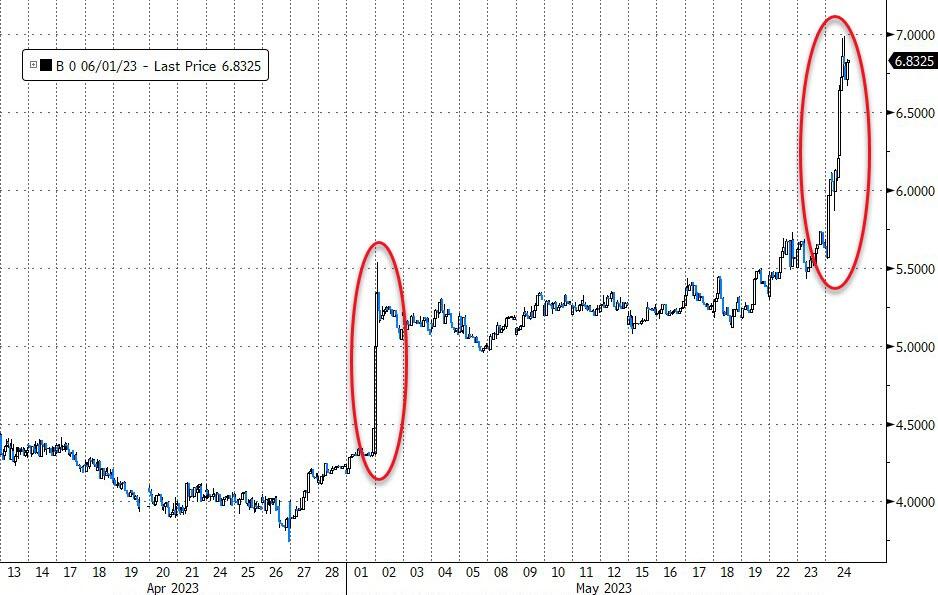
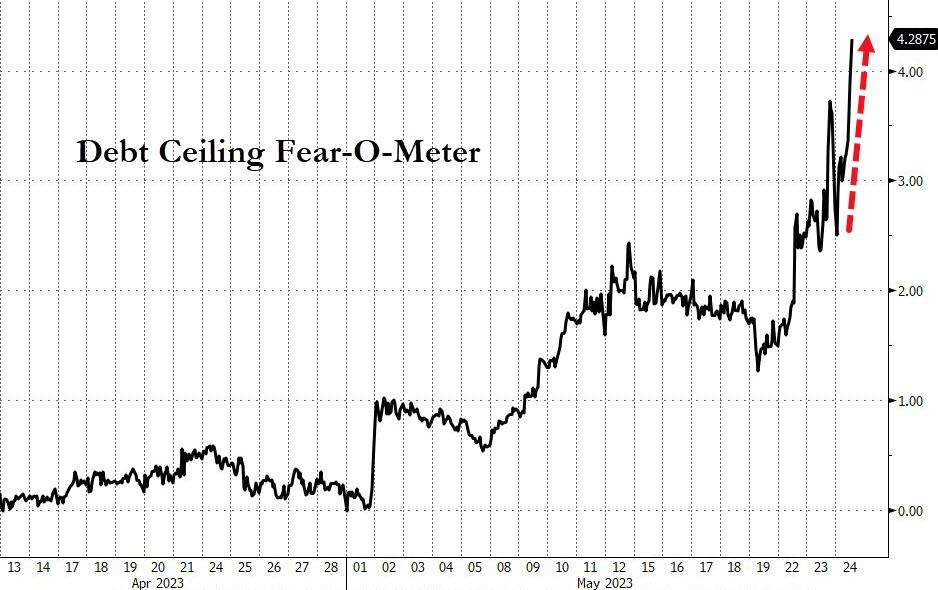
The June 1st T-Bill yield skyrocketed above 7%, showing how scared the market was of a default. The debt ceiling Fear-O-Meter also hit a record high, as ZeroHedge put it.
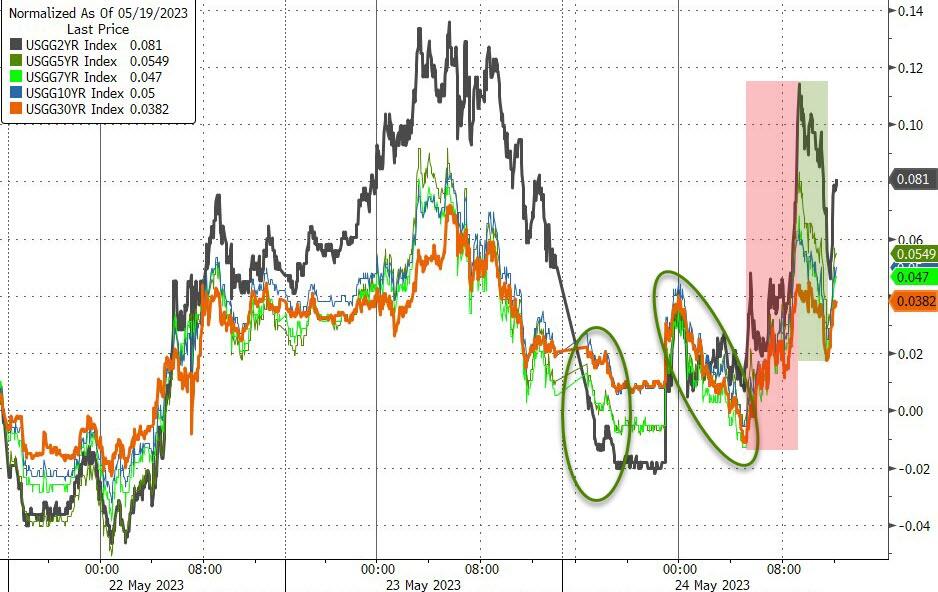
A late rally eased some of the pain, but it was too little, too late. Bond yields ended higher, the dollar edged up, and gold slipped 0.64%.
2. “Buy” Cycle Suggestions
For the current Buy cycle, which started on 12/1/2022, I suggested you reference my then current StatSheet for ETF selections. However, if you came on board later, you may want to look at the most recent version, which is published and posted every Thursday at 6:30 pm PST.
I also recommend you consider your risk tolerance when making your selections by dropping down more towards the middle of the M-Index rankings, should you tend to be more risk adverse. Likewise, a partial initial exposure to the markets, say 33% to start with, will reduce your risk in case of a sudden directional turnaround.
We are living in times of great uncertainty, with economic fundamentals steadily deteriorating, which will eventually affect earnings negatively and, by association, stock prices.
In my advisor’s practice, we are therefore looking for limited exposure in value, some growth and dividend ETFs. Of course, gold has been a core holding for a long time.
With all investments, I recommend the use of a trailing sell stop in the range of 8-12% to limit your downside risk.
3. Trend Tracking Indexes (TTIs)
Our TTIs headed south, as traders, due to the lack of progress in the debt ceiling debacle, finally gave up on their bullish sentiment and sold. The Domestic TTI dropped for the second day in a row, as we’ve seen many times this year. I need to see more downside weakness before I pull the trigger on the current “Buy” signal.
This is how we closed 05/24/2023:
Domestic TTI: -1.22% below its M/A (prior close -0.12%)—Buy signal effective 12/1/2022.
International TTI: +3.89% above its M/A (prior close +5.07%)—Buy signal effective 12/1/2022.
All linked charts above are courtesy of Bloomberg via ZeroHedge.
Contact Ulli