Below, you can evaluate the latest High-Volume ETF Cutline report, which shows how far above or below their respective long-term trend lines (39-week SMA) my currently tracked ETFs are positioned.
This report covers the HV ETF Master List from Thursday’s StatSheet and includes 312 High Volume ETFs, defined as those with an average daily volume of more than $5 million, of which currently 210 (last report: 222) are hovering in bullish territory. The yellow line separates those ETFs that are positioned above their trend line (%M/A) from those that have dropped below it.
In case you are not familiar with some of the terminology used in the reports, please read the Glossary of Terms. If you missed the original post about the Cutline approach, you can read it here.
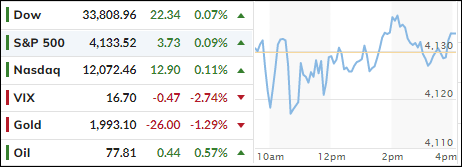
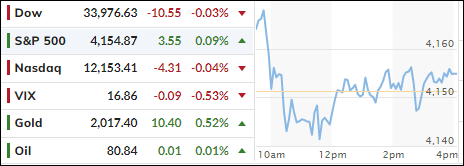
Today’s activity pretty much resembled how the markets fared during this entire week. It was a snooze fest with neither buyers nor sellers being motivated to act, with the result that the S&P 500 lost 4 points, or 0.1%.
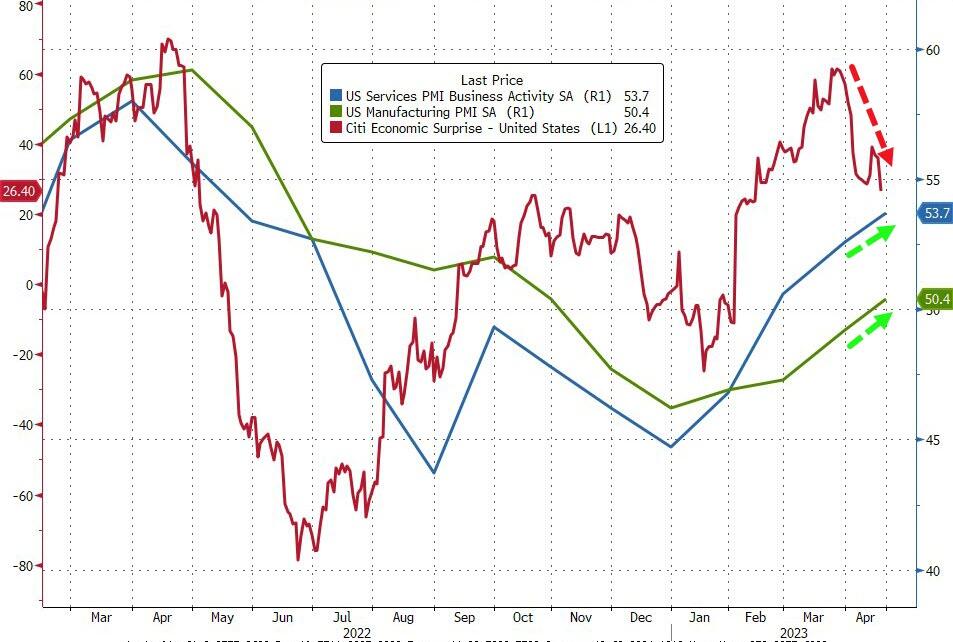
The tug-of-war between bulls and bears ended in a draw this week, with direction lacking. That may continue until it becomes clear if the restrictive Fed monetary policy can overwhelm the case made by many that the economy is more resilient due to stronger-than-expected corporate earnings, which were achievable only due to a much-lowered bar.
For sure, the markets appear stressed in view of the upcoming debt-ceiling debate. Both sides have hardened their views, and just because in the past common ground was found eventually, this time may be different, hence the lack of activity.
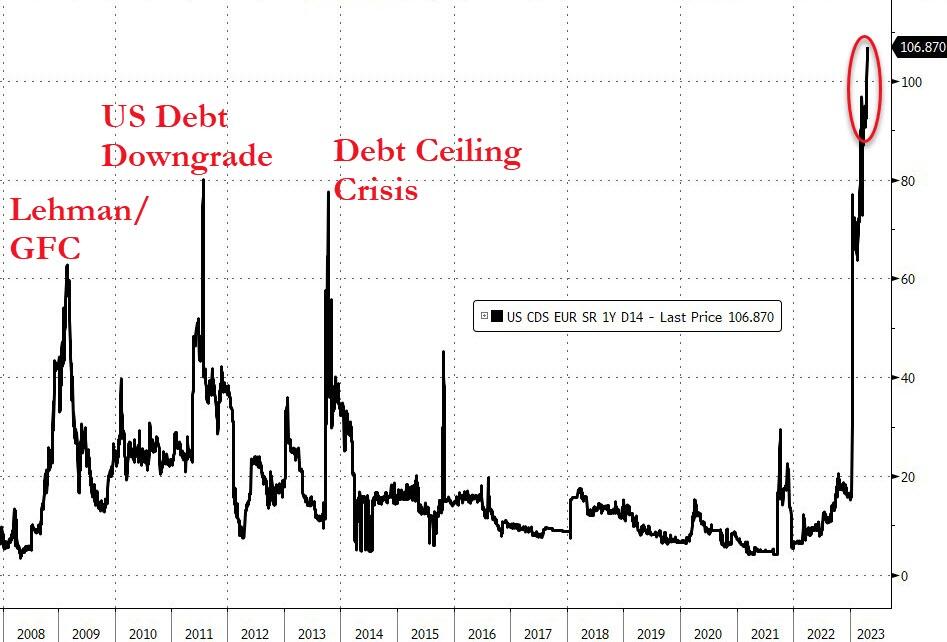
The current high USA risk is reflected by Credit Default Swaps (CDS) hitting their highest in 15 years and surpassing past crisis events.
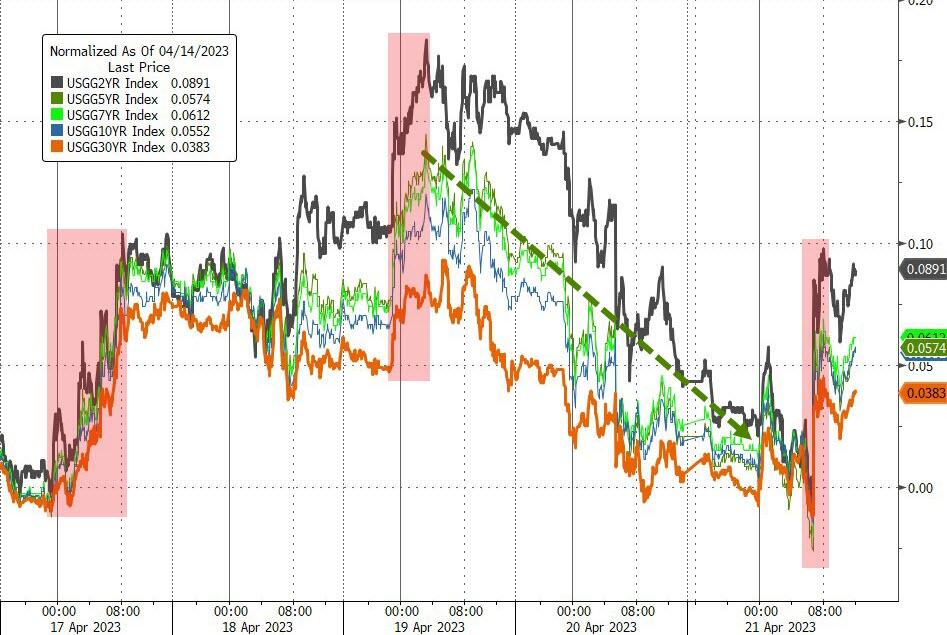
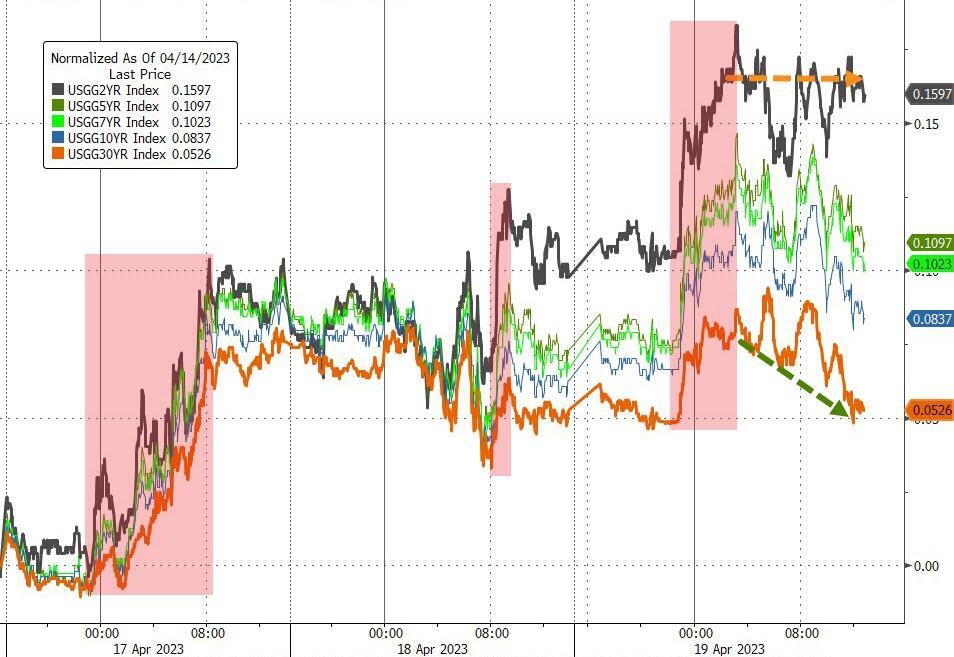
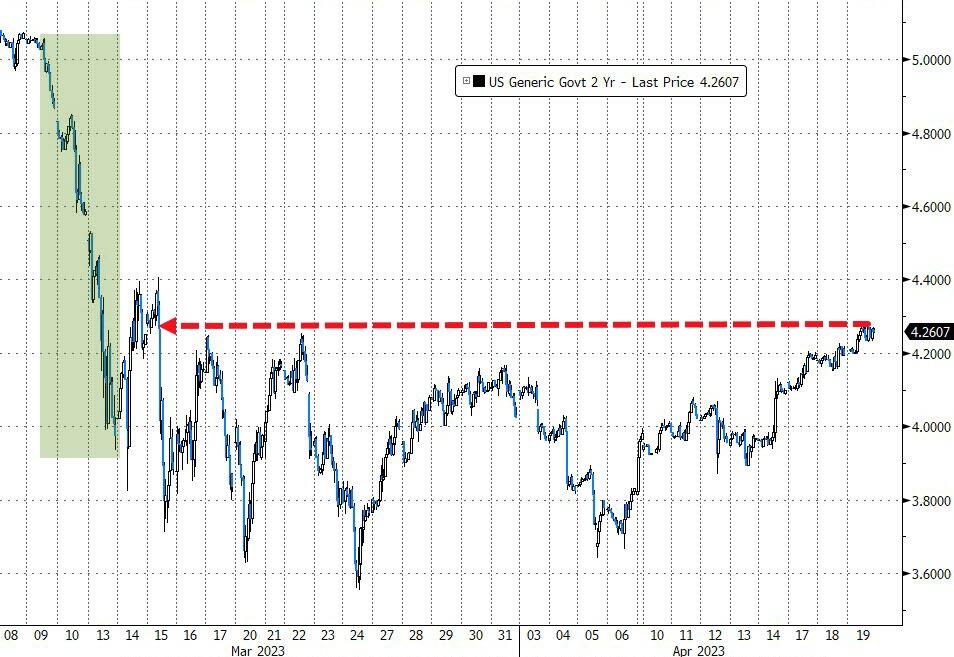
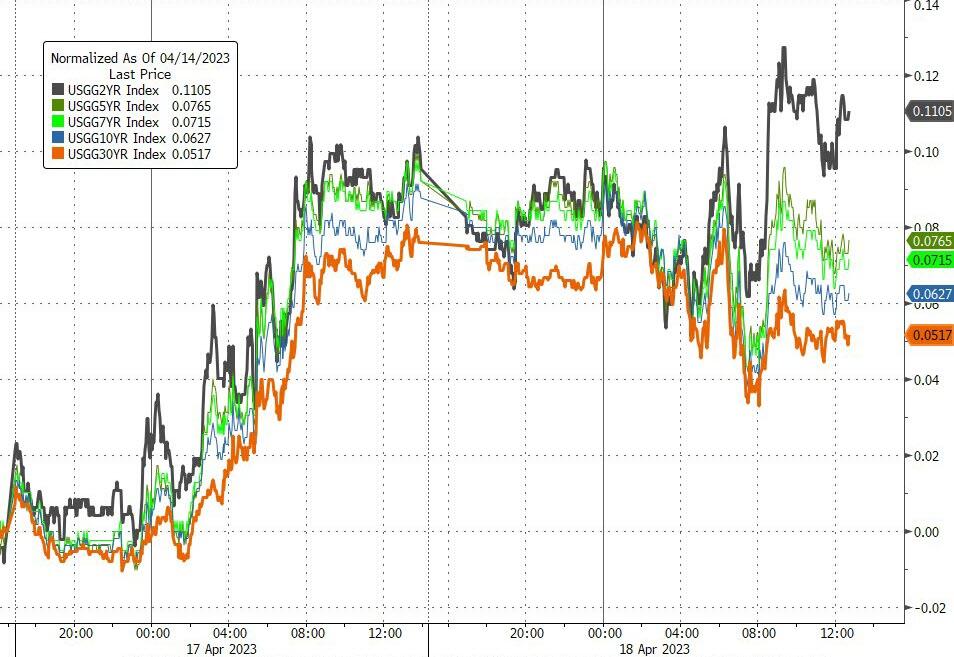
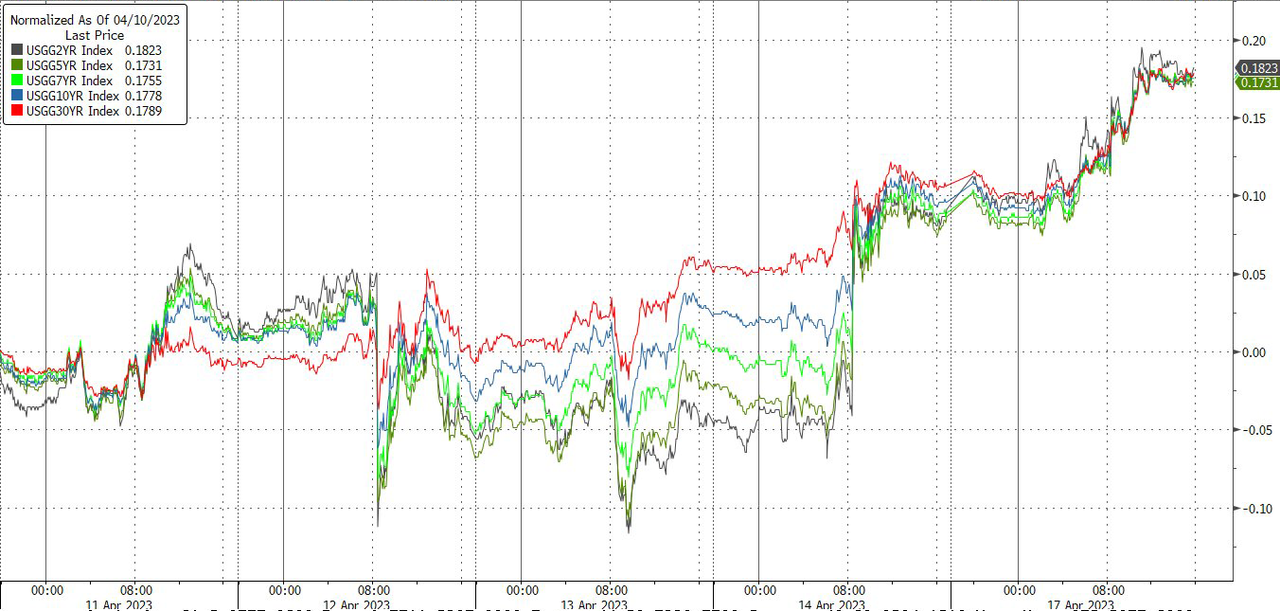
Bond yields rode a roller coaster and ended the week a tad higher, while rate hike expectations continued to rise, with the odds now being 92% that the Fed will hike by 0.25% at the beginning of May.
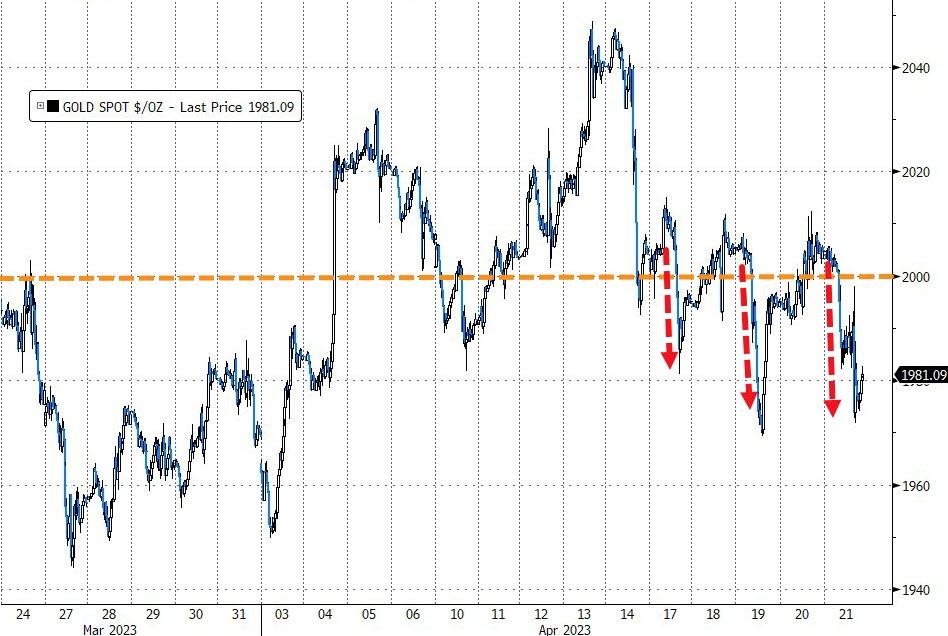
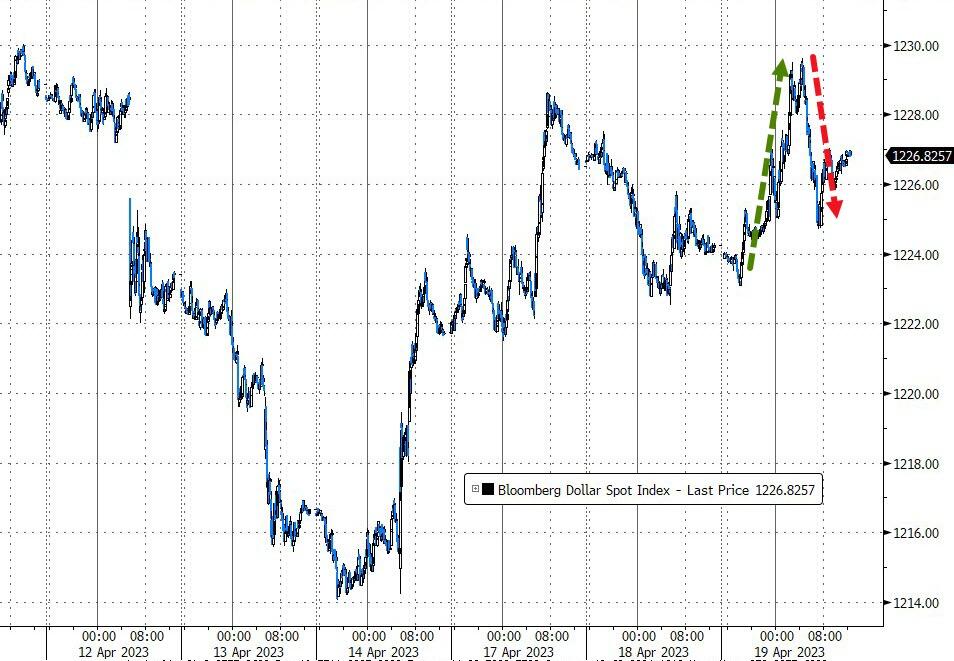
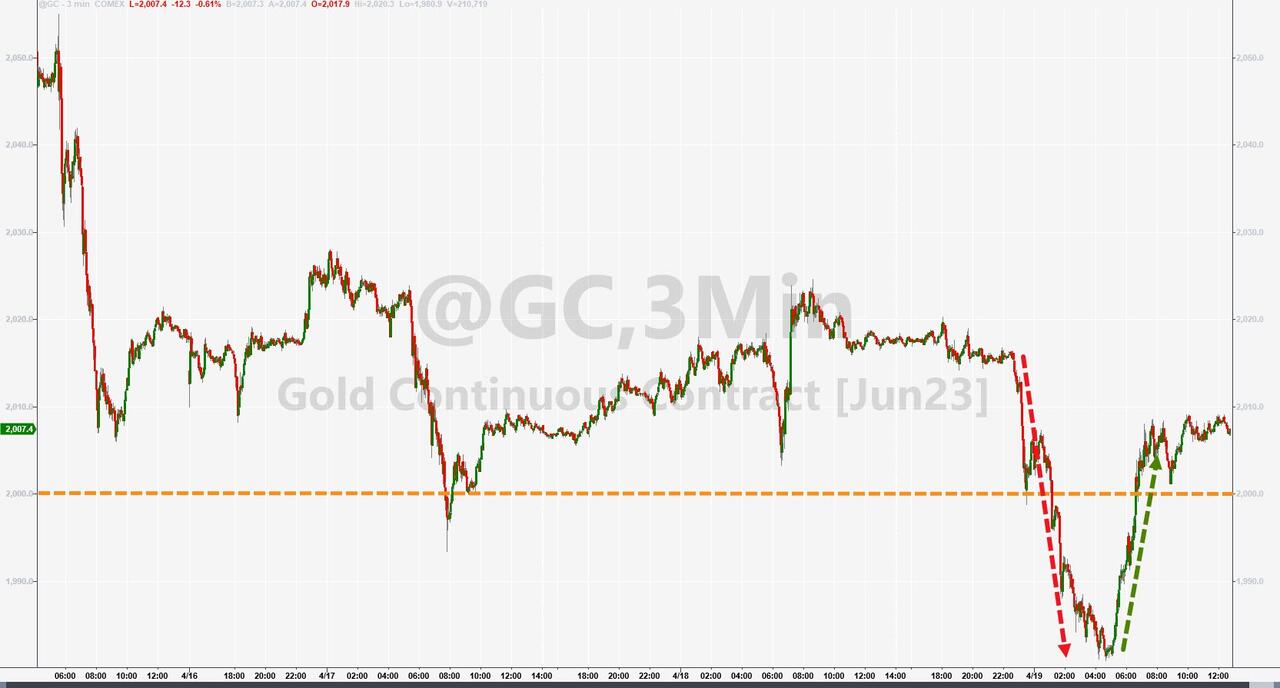
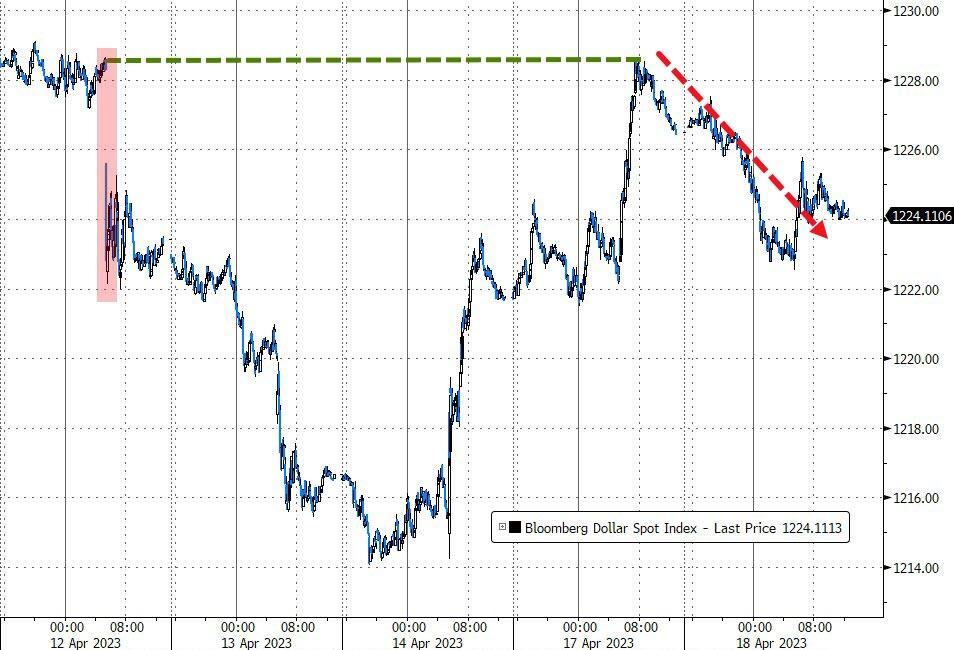
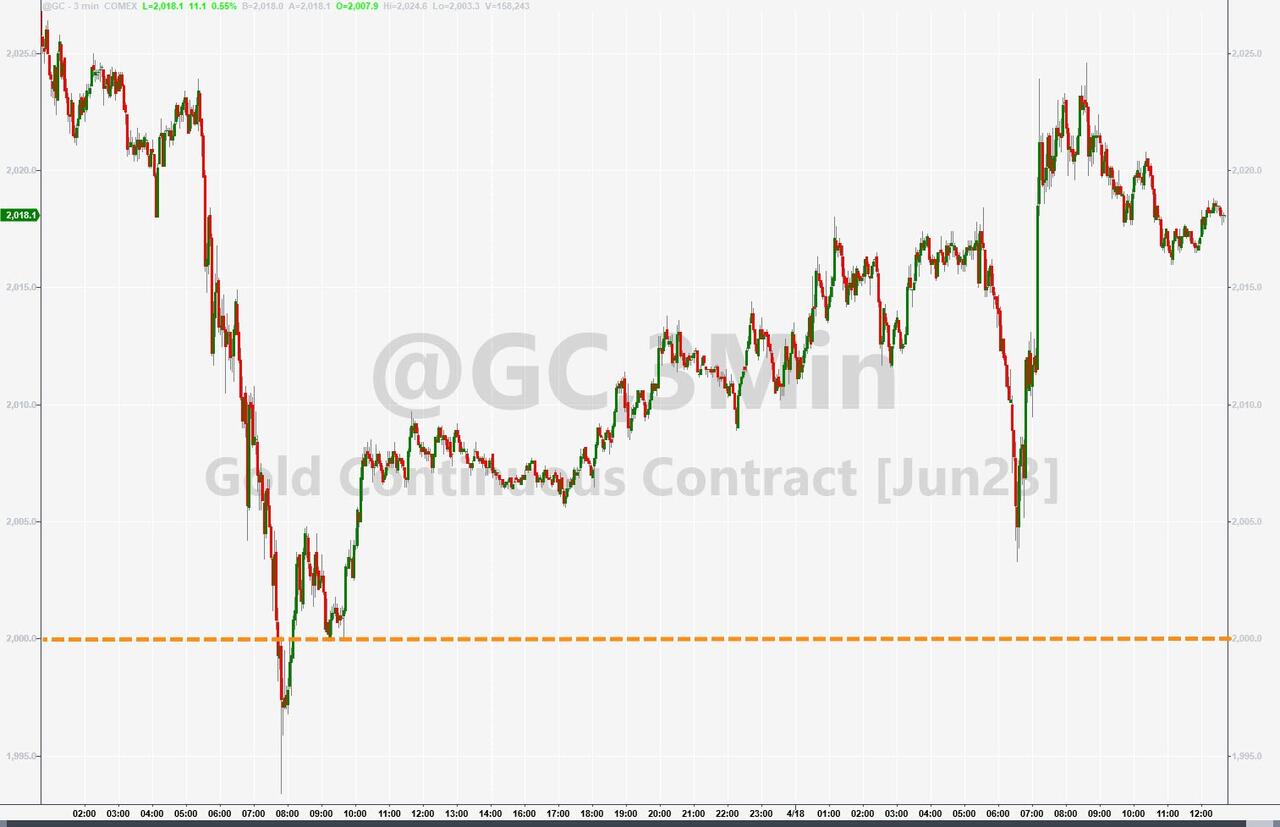
The US Dollar closed out a volatile week to the upside, which caused Gold to lose its $2k level.
Besides 42% of the S&P’s market cap reporting earnings next week, the debt ceiling battle will likely be the focus point for traders and algos alike.
1. From the universe of over 1,800 ETFs, I have selected only those with a trading volume of over $5 million per day (HV ETFs), so that liquidity and a small bid/ask spread are assured.
2. Trend Tracking Indexes (TTIs)
Buy or Sell decisions for Domestic and International ETFs (section 1 and 2), are made based on the respective TTI and its position either above or below its long-term M/A (Moving Average). A crossing of the trend line from below accompanied by some staying power above constitutes a “Buy” signal. Conversely, a clear break below the line constitutes a “Sell” signal. Additionally, I use a 12% trailing stop loss on all positions in these categories to control downside risk.
3. All other investment arenas do not have a TTI and should be traded based on the position of the individual ETF relative to its own respective trend line (%M/A). That’s why those signals are referred to as a “Selective Buy.” In other words, if an ETF crosses its own trendline to the upside, a “Buy” signal is generated. Here too, I recommend trailing sell stop of 12%, or less, depending on your risk tolerance.
If you are unfamiliar with some of the terminology, please see Glossary of Termsand new subscriber information in section 9.
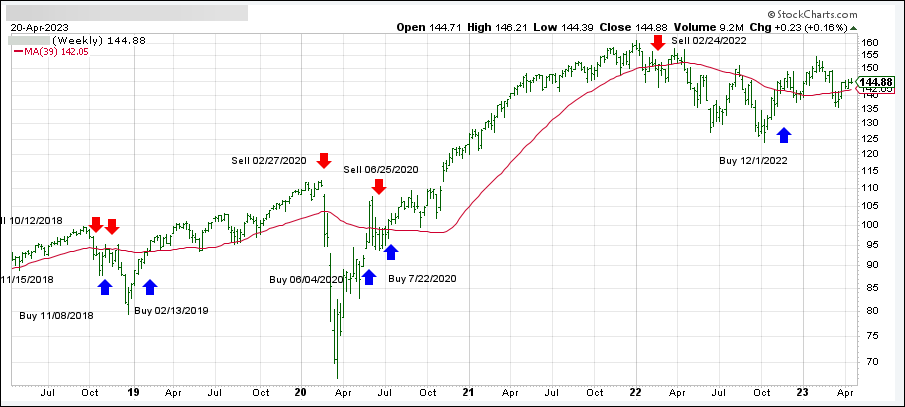
1. DOMESTIC EQUITY ETFs: BUY — since 12/01/2022
Click on chart to enlarge
Our main directional indicator, the Domestic Trend Tracking Index (TTI-green line in the above chart) has reclaimed its long-term trend line (red) by +2.11% and remains in “Buy” mode for the time being.
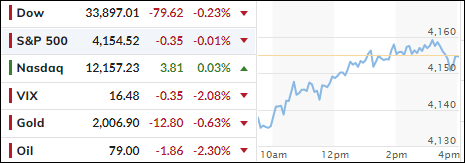
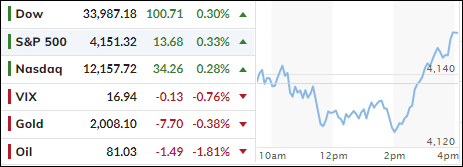
Today’s session had all the excitement that I usually experience when I watch grass grow or paint dry, as the major indexes meandered without conviction and ended up around their respective unchanged lines—again.
Despite another loaded earnings day kicking into full swing, as MarketWatch called it, traders simply found something wrong with the results. The lack of forecasts from major companies kept Wall Street mired in uncertainty, while the outlook for the Fed executing another 0.25% rate hike at the beginning of May did nothing to inspire bullish sentiment.
Considering that the S&P 500 has only moved 4 points higher this week clearly demonstrates that a new driver is needed to pull the markets out of their current ho-hum environment.
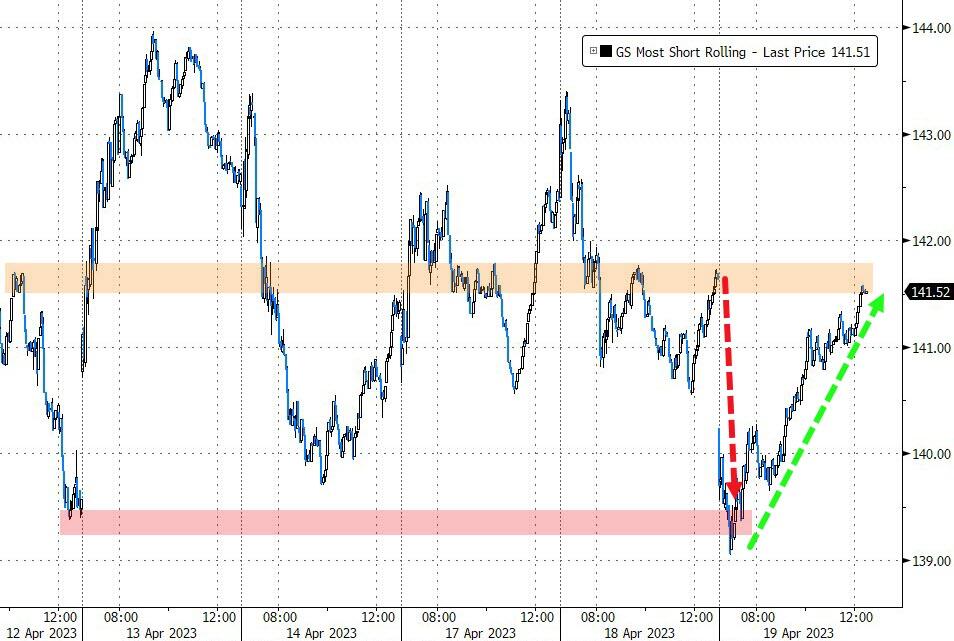
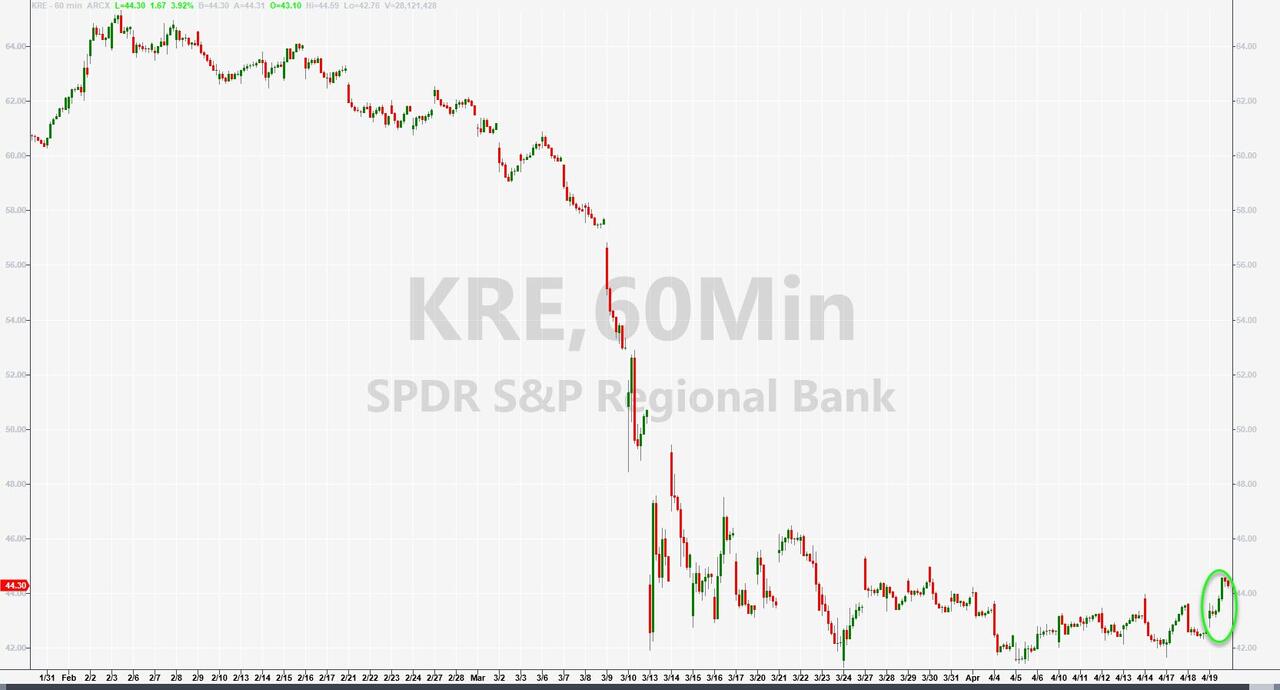
Even the most shorted stocks did nothing but roundtrip, but the KRE banking index showed signs of life by bouncing to two-week highs, but it has a long way to go to make up recent losses.
Bond yields were mixed, but the 2-year recaptured the 4% level, the US Dollar roundtripped yet gained for the session, while gold slipped but stayed above its $2k level.
I expect this choppiness to continue until a sudden possibly unforeseen event wakes up bulls and bears, and the race will be on, but in which direction?
It was another session during which traders adopted a “wait and see” attitude, as they digested the latest earnings reports along with their potential economic consequences. The major indexes chopped around within a narrow range and ended essentially unchanged.
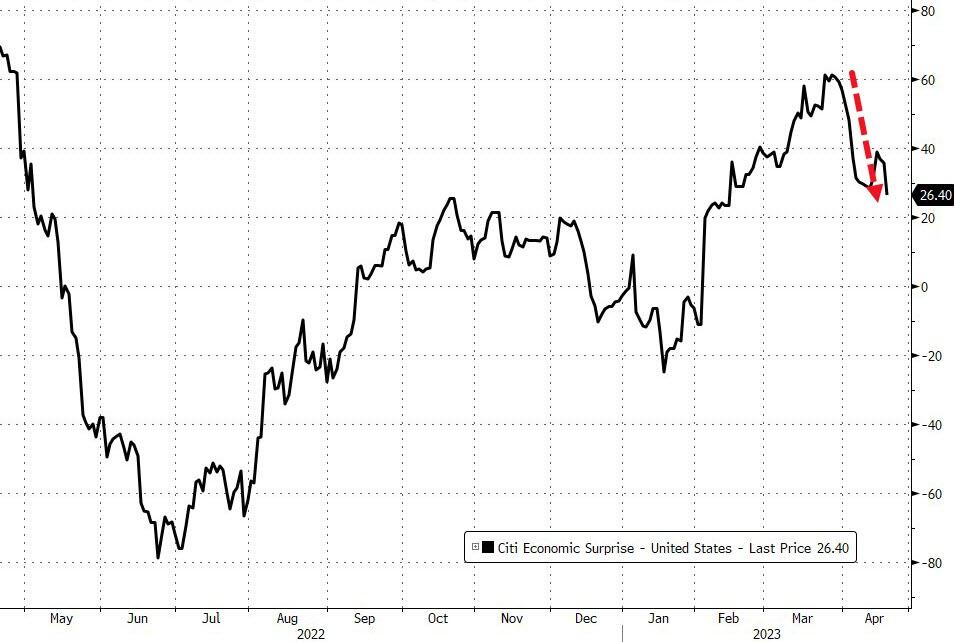
Even though the view that earnings have been resilient, given reduced expectations, some profit warnings apparently kept traders and algos subdued and not in the mood to press the “buy” buttons.
The theme remained that the battle continues, with more potential rate hikes on deck, while profits may top only a sharply reduced bar, which has created this current dilemma of uncertainty as to whether equities have hit a glass ceiling or have more room to run.
Bond yields were mixed, the US Dollar slipped off yesterday’s highs, but gold picked up momentum and added +0.53%.
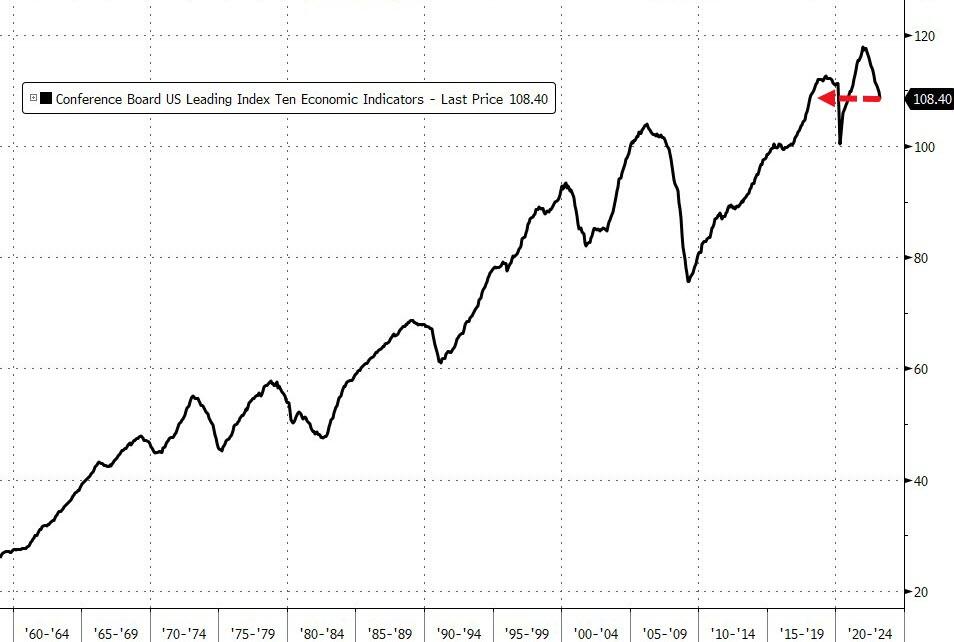
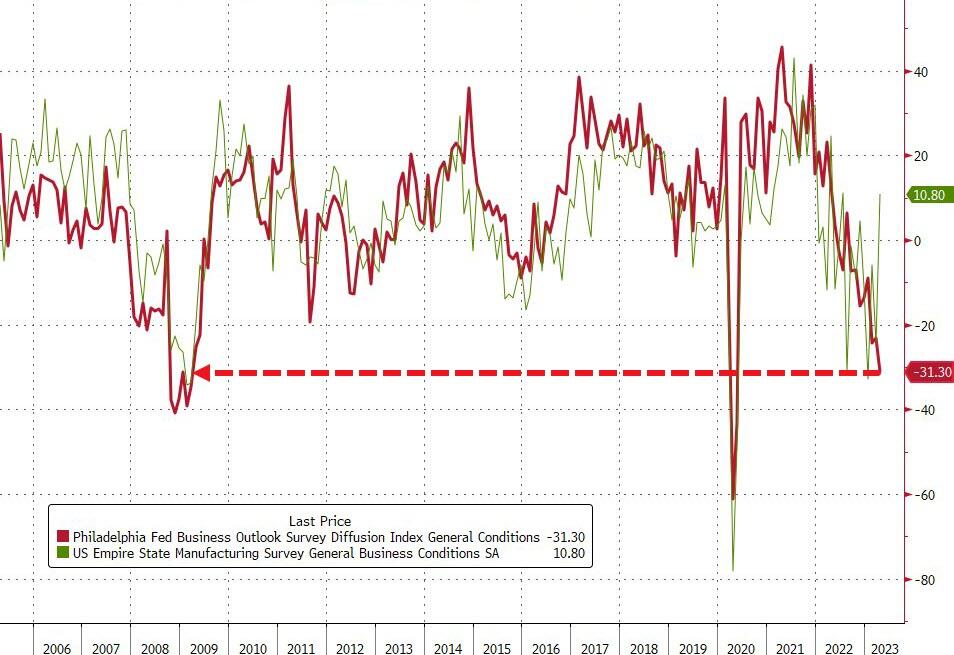
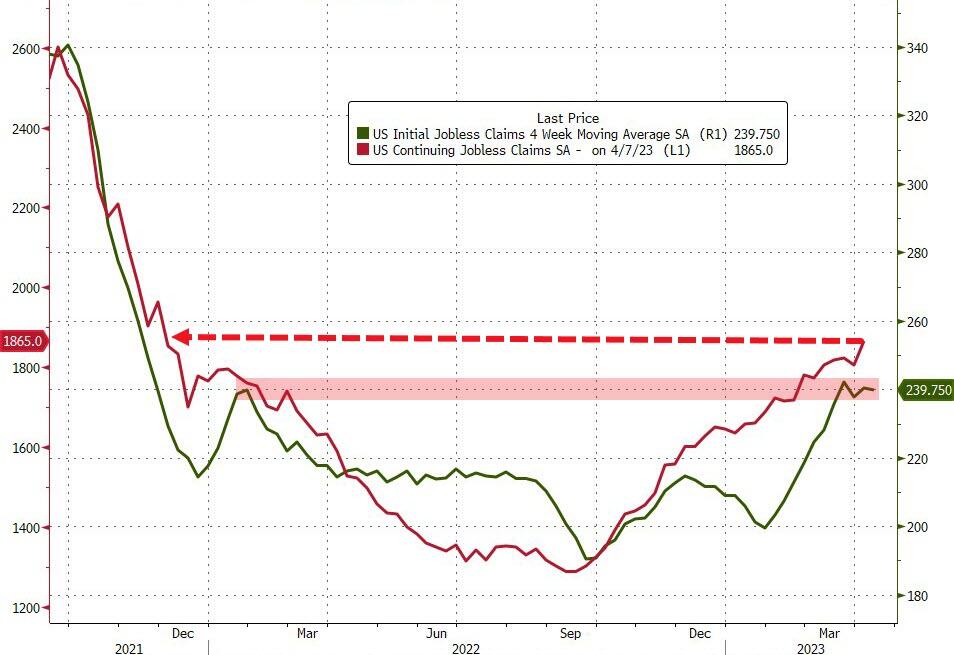
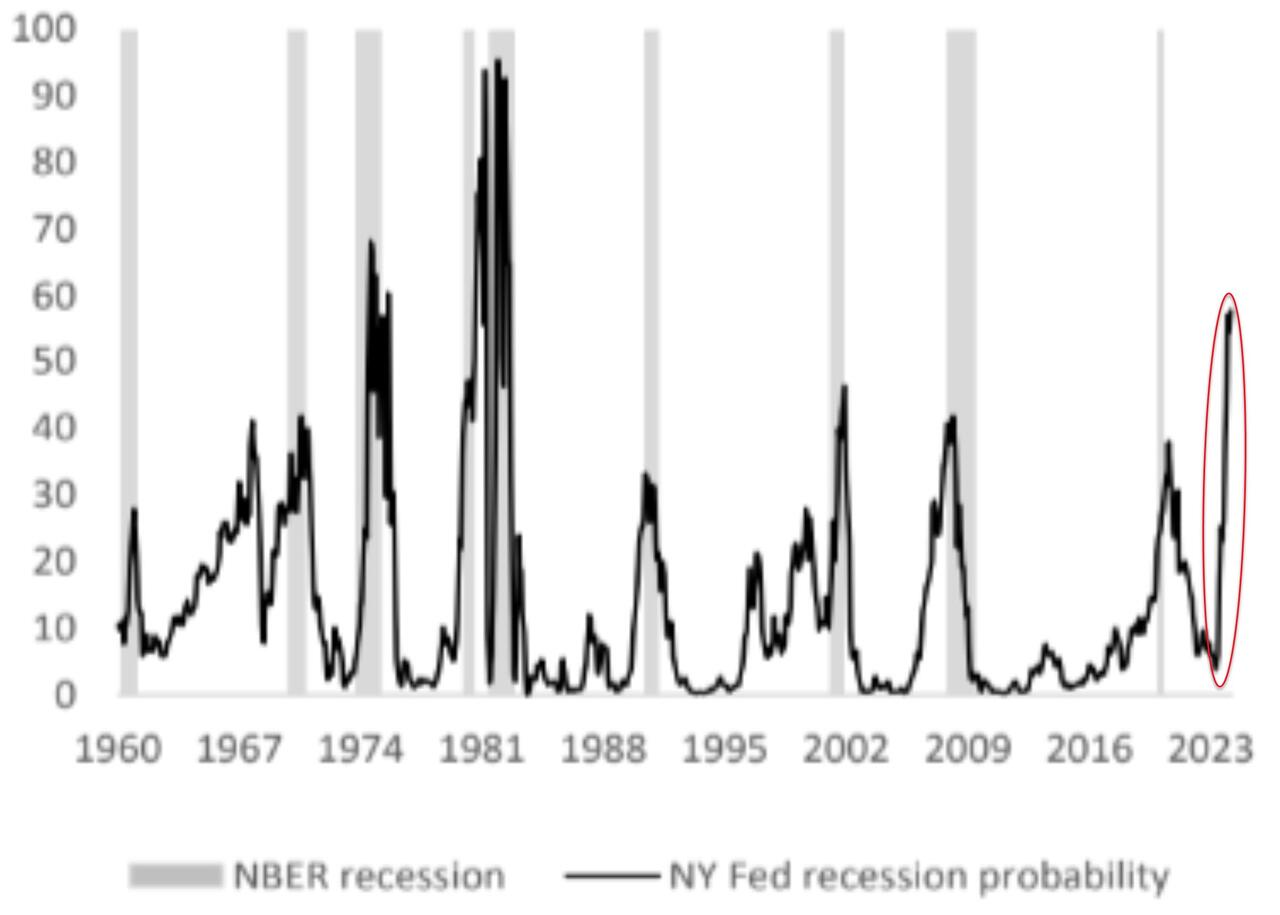
Recessionary signs are widely spread, and the NY Fed’s model appears to concur.
Traders spent most of the day examining the latest earnings results for clues to determine whether optimism via higher stock prices was warranted. The major indexes meandered aimlessly around their respective unchanged lines, predominantly below it, until a last hour squeeze play assured a moderately green close, but it pulled the KBW banking index out of a deep hole.
The endless tug-of war, between those who believe that the Fed will soon end its tightening campaign and others, who are convinced that the rate hike campaign will continue, remained in full force.
It came as no surprise that, in view of the recent and still ongoing banking crisis, traders so far mainly focused on the health of financial companies to have a front row seat when it comes to spotting unwelcome shockers. None of the latter surfaced today, which may have led to the last hour jump of optimism.
As I pointed out last week, if you set the bar low enough, you will get desirable results. That was the case today in that 90% of the names that reported during the first week topped EPS estimates. Go figure…
Bond yields rose, which helped the US Dollar gain 0.53%, but it hurt the precious metals with gold retreating 0.38% but holding on to its $2k level.
With more money printing on deck, it’s just a matter of time until precious metals will resume their ascent to higher prices.