Below, you can evaluate the latest High-Volume ETF Cutline report, which shows how far above or below their respective long-term trend lines (39-week SMA) my currently tracked ETFs are positioned.
This report covers the HV ETF Master List from Thursday’s StatSheet and includes 312 High Volume ETFs, defined as those with an average daily volume of more than $5 million, of which currently 222 (last report: 209) are hovering in bullish territory. The yellow line separates those ETFs that are positioned above their trend line (%M/A) from those that have dropped below it.
In case you are not familiar with some of the terminology used in the reports, please read the Glossary of Terms. If you missed the original post about the Cutline approach, you can read it here.
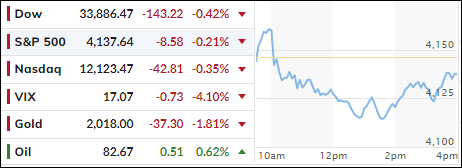
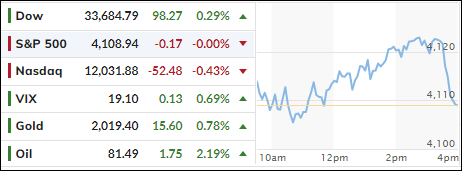
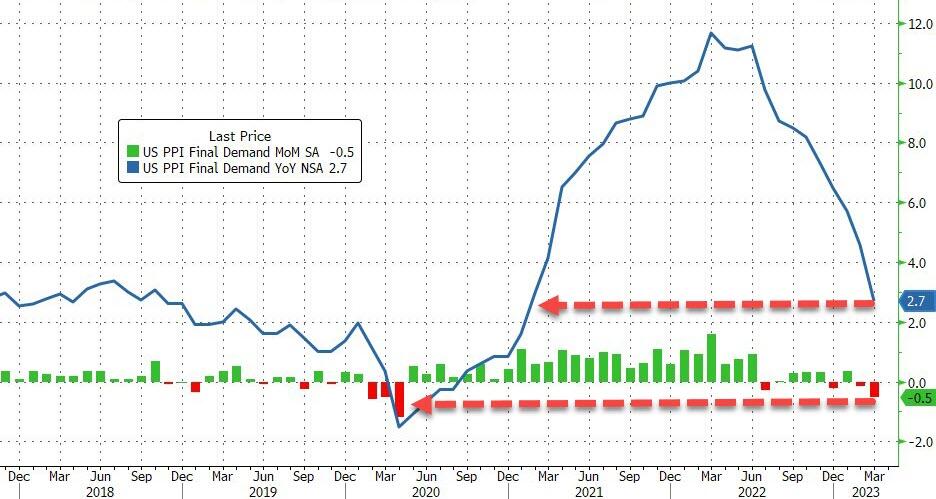
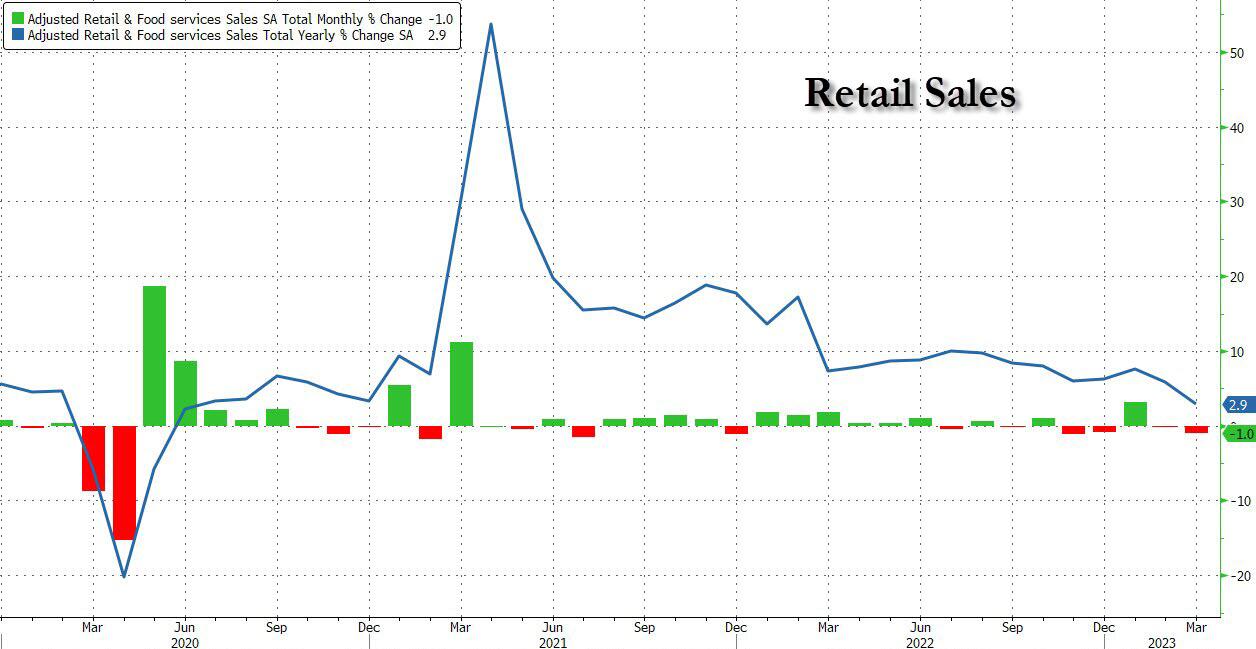
Yesterday’s better than expected PPI number pushed all markets solidly in the green, but today’s weak retail sales, in the face strong bank earnings, pulled all indexes lower with stocks, bonds, and precious metals participating in the slide.
On the positive, yesterday’s gains far outweighed today’s losses, so not much damage was done, and, for the week, the S&P 500 added some 2%.
Consumer spending, which contributes almost 70% to economic activity, fell twice as much as expected, as retail sales declined by 1% last month, which hugely exceeded forecasts of a 0.5% fall. Lower gas prices contributed, because consumers paid less for fuel, but that could reverse in a hurry.
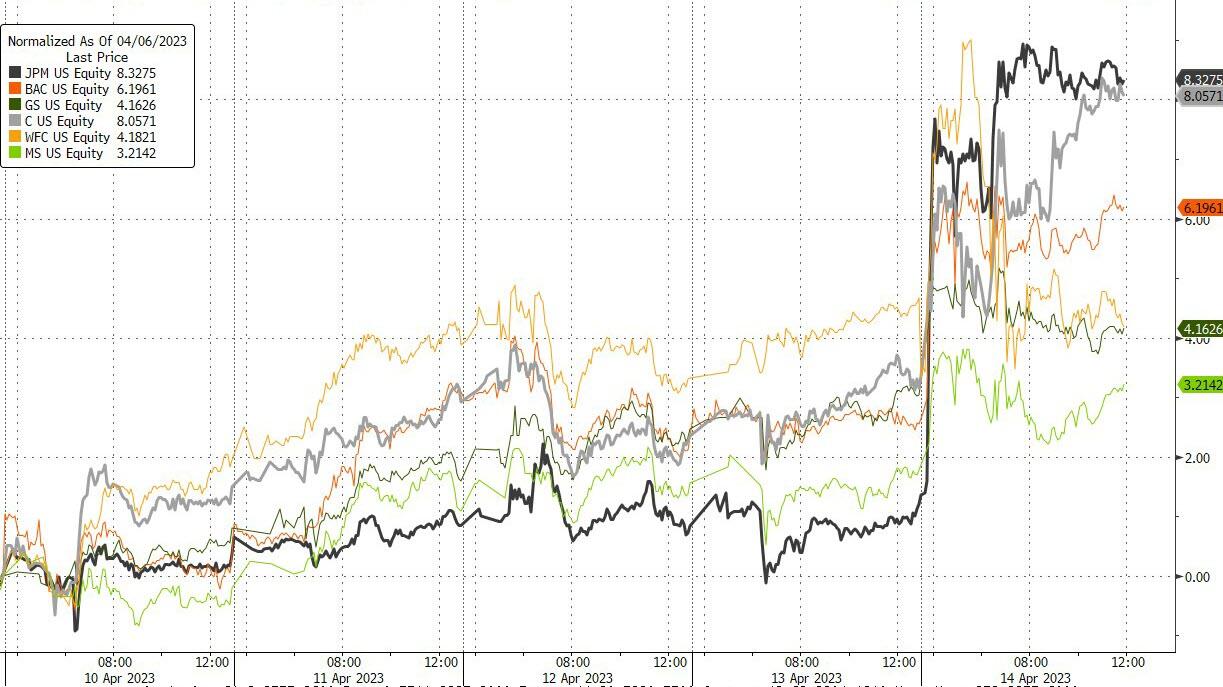
Offsetting this reduction was a solid start with bank earnings, as powerhouse JP Morgan reported record revenue, which pushed its stock up some 7%. Even much beleaguered Wells Fargo reported growing profits, but its stock gave back the early advance. However, thanks to JPM, all major banks participated in today’s Lift-A-Thon.
Expectations for this earnings season are downbeat, with estimates forecasting a reduction of 5%. So, the bar will be set extremely low, and those companies which beat these much lower expectations will likely see their stock prices rise—at least that’s how the game is played.
Fed governor Waller again hawkishly chimed in, as have many other Fed gov’s before, that he favored “more monetary policy tightening to reduce persistently high inflation,” although he said he was prepared to adjust his stance if needed if credit tightens more than expected.
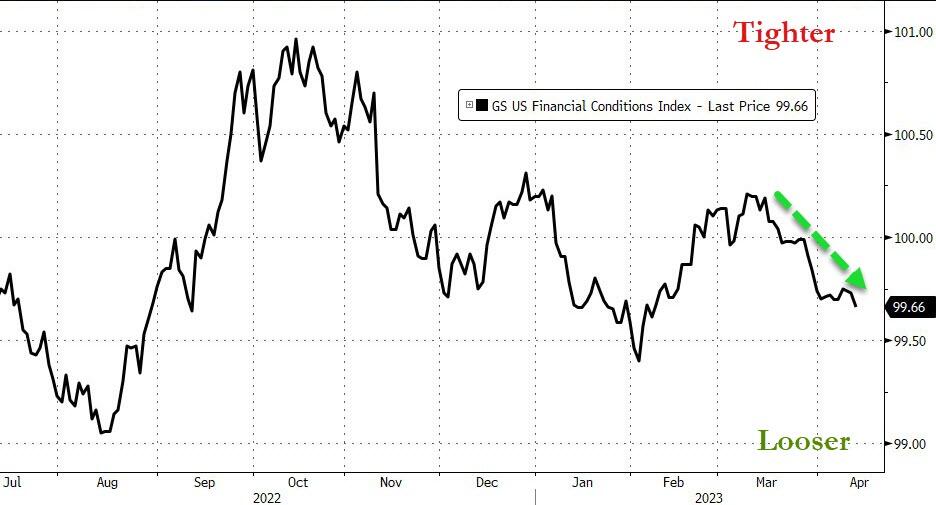
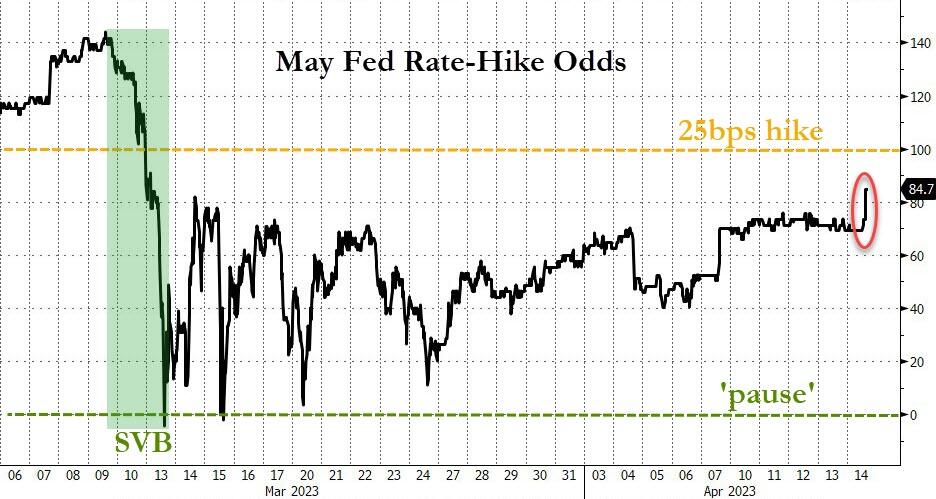
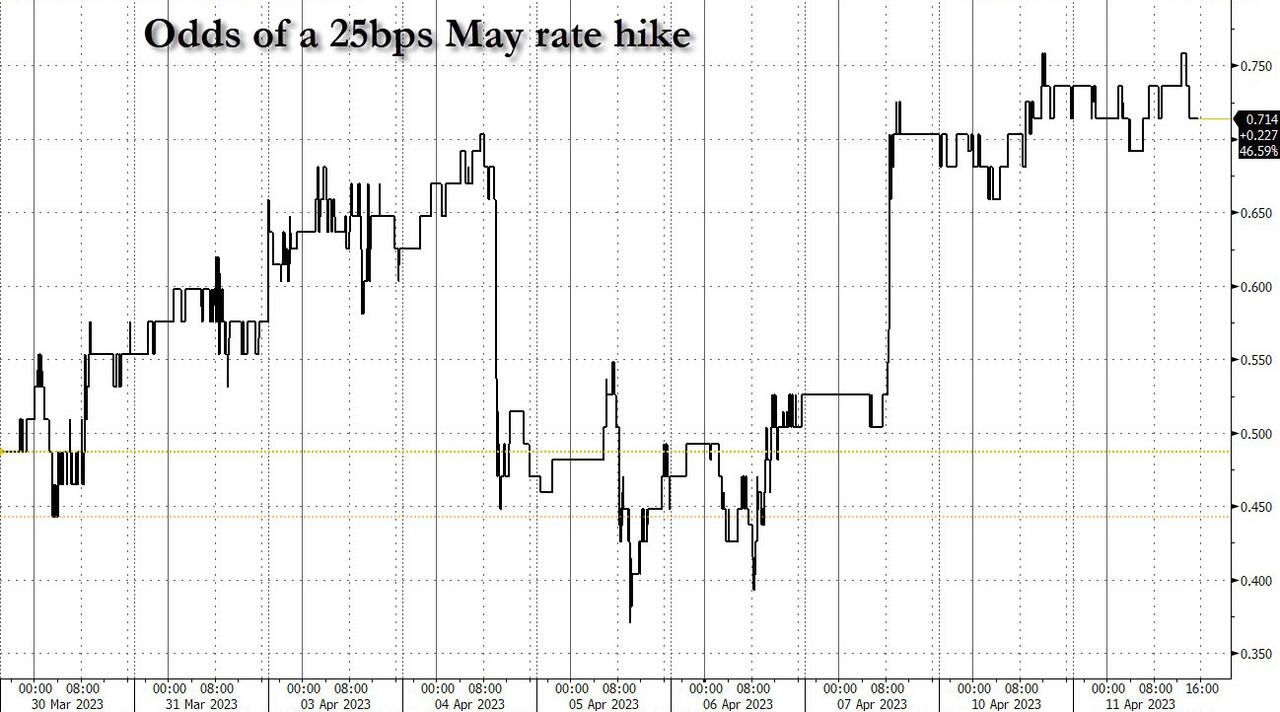
However, so far financial conditions are looser, so his view is correct, at least for the time being. Loose financial conditions are not what the Fed is looking for, which is why the odds of a 0.25% rate hike in May have now spiked from 70% to 85%, as this chart shows.
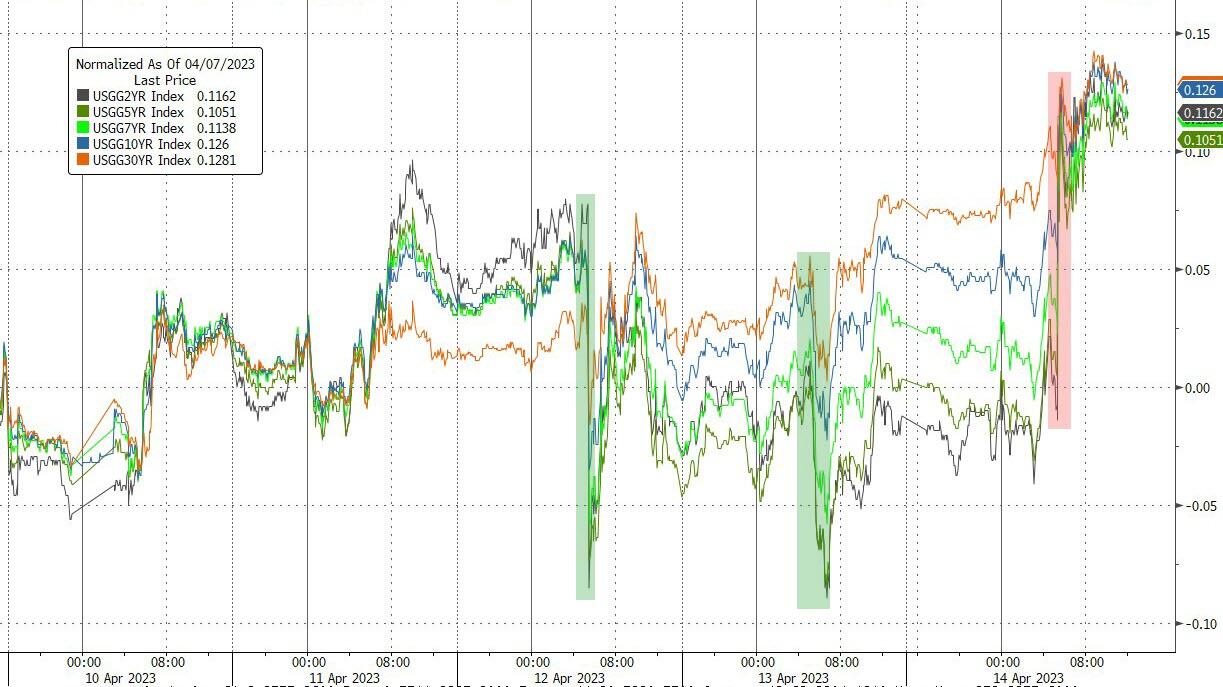
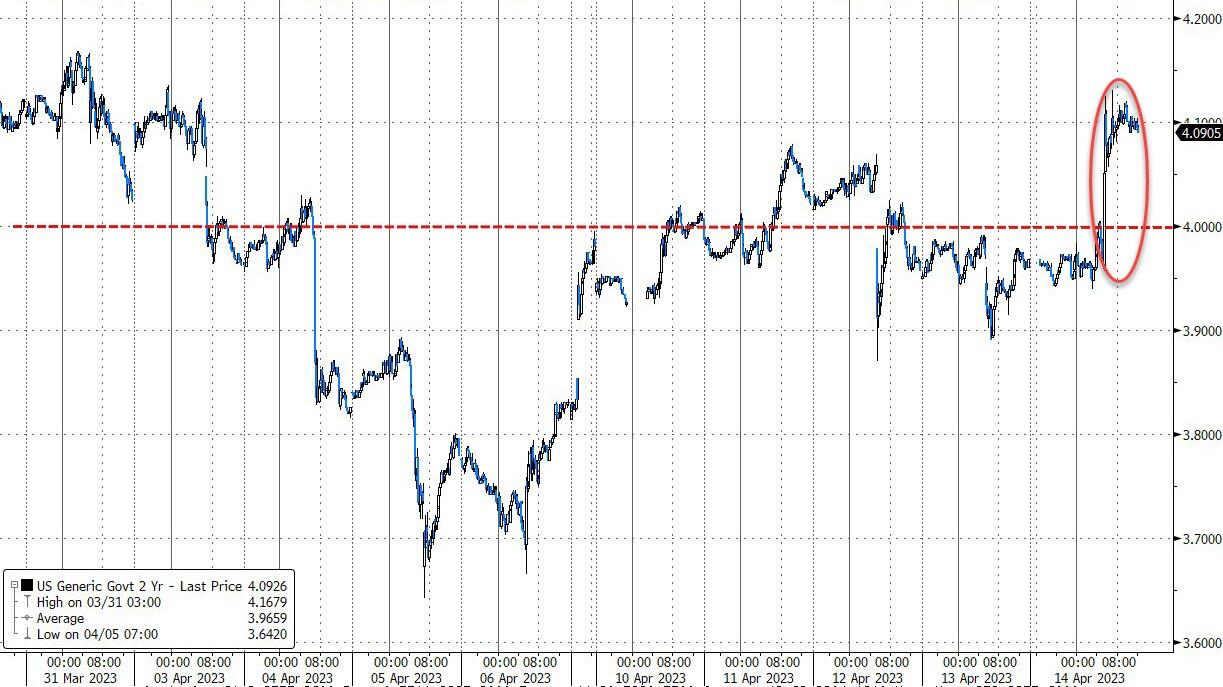
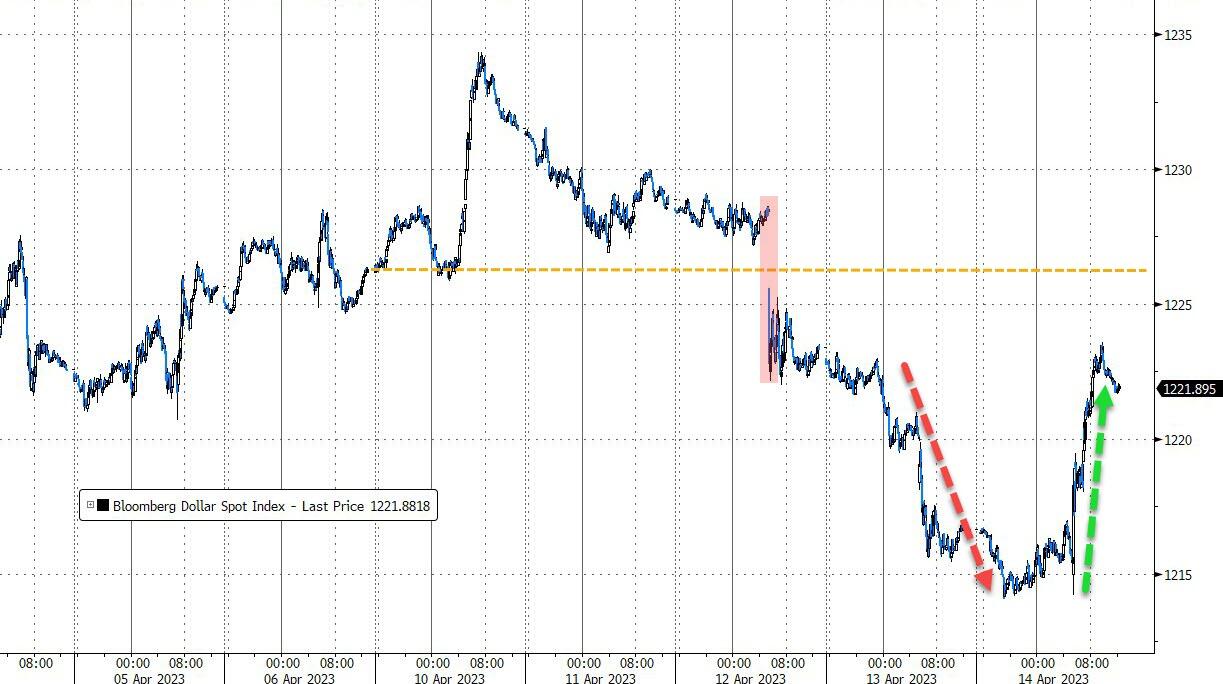
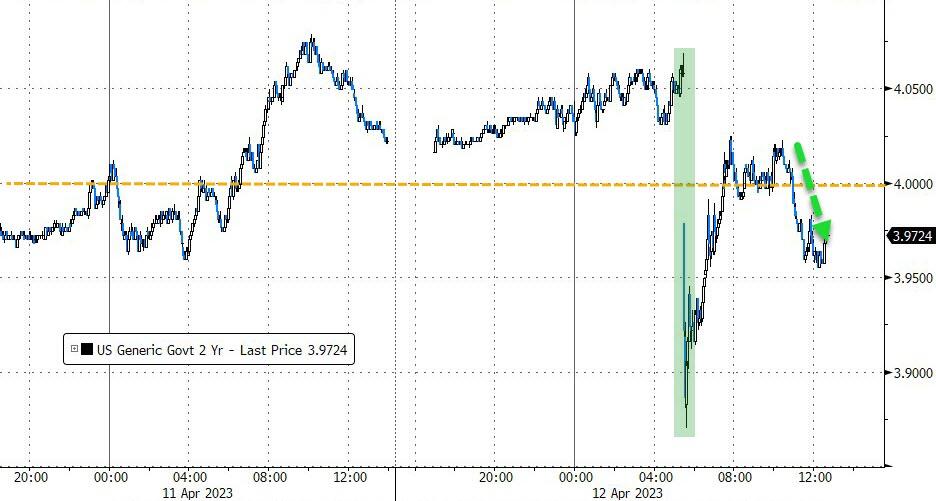
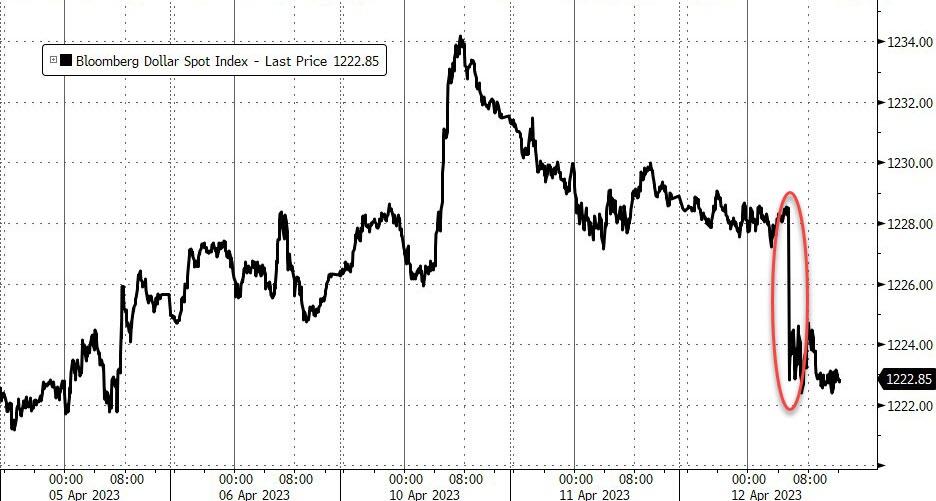
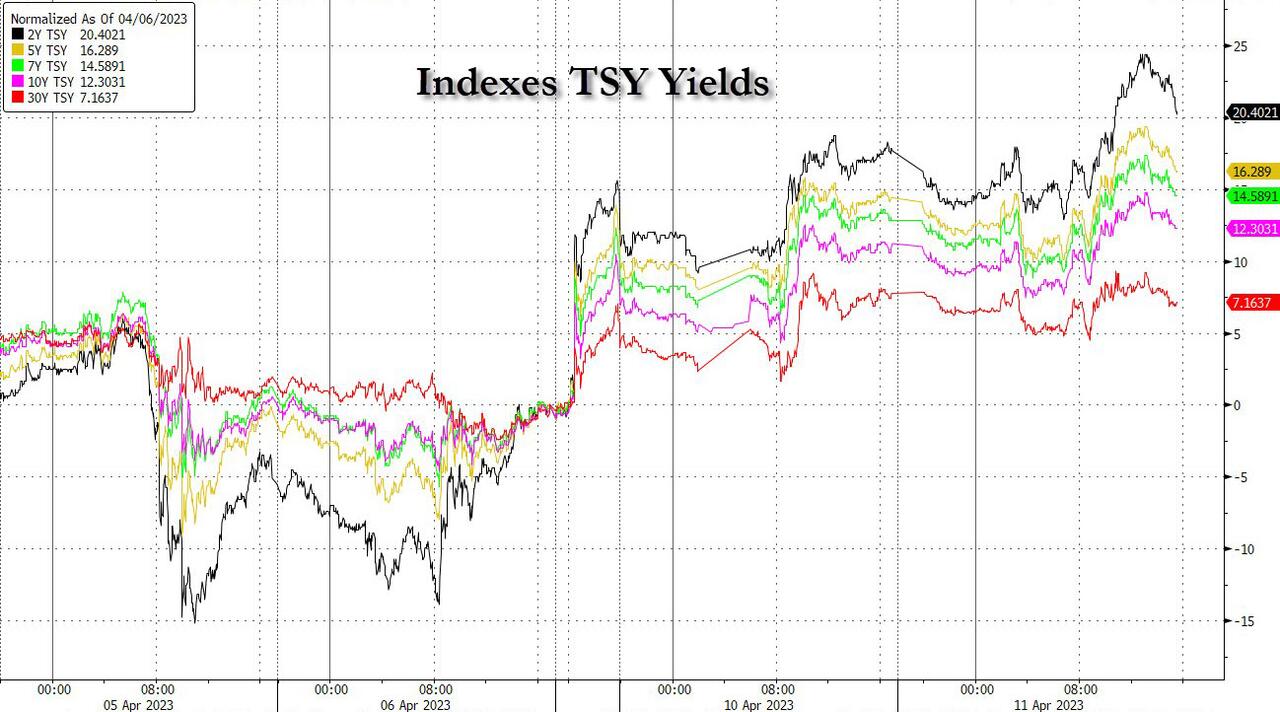
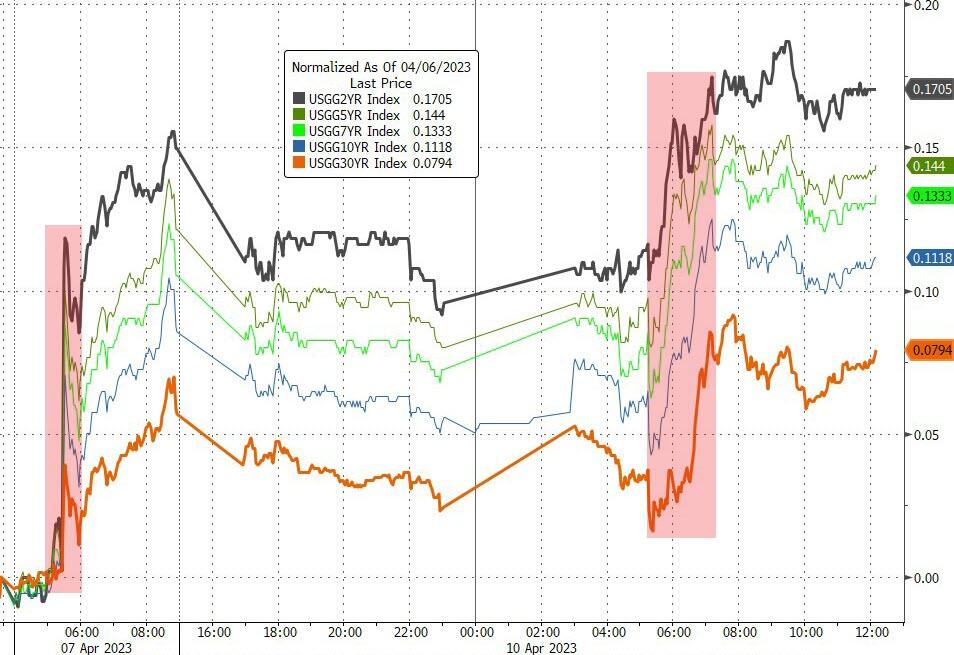
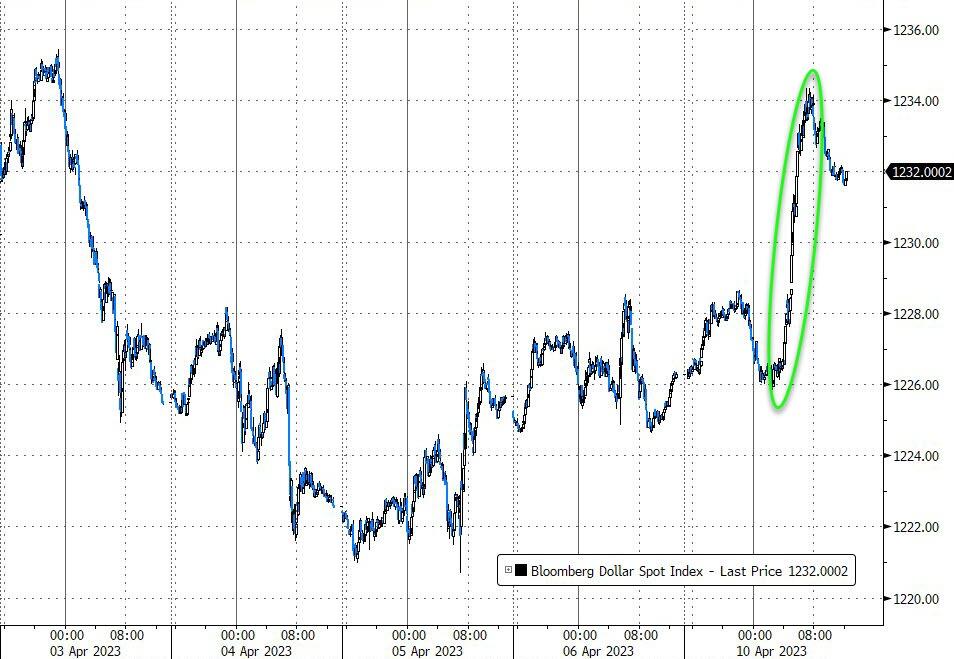
Bond yields rose today with the 2-year surging back above its 4% level, giving the US Dollar a reason to bounce back, but the greenback is still down for the 5th week in a row, as ZH pointed out.
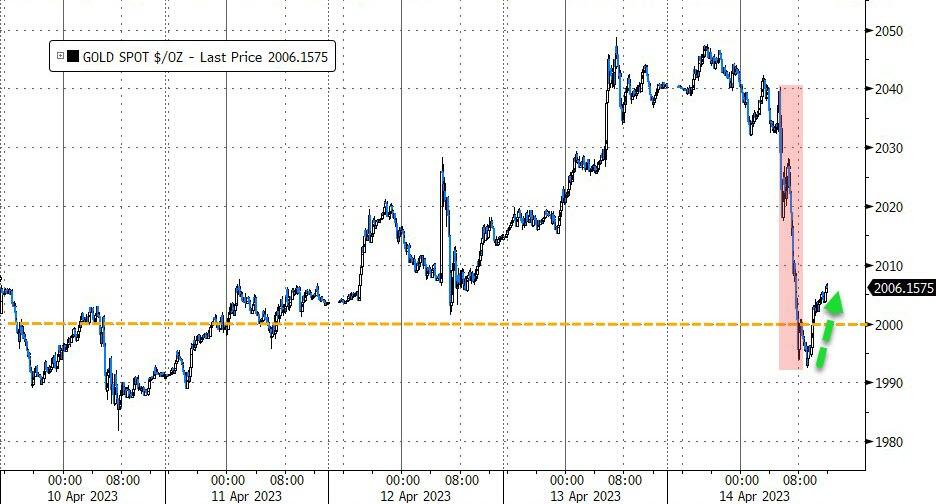
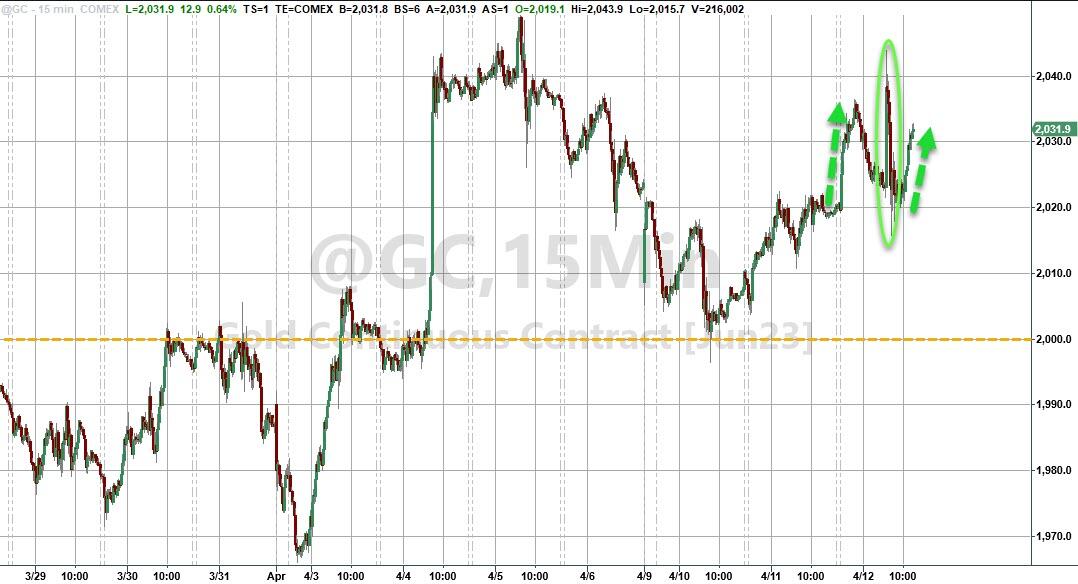
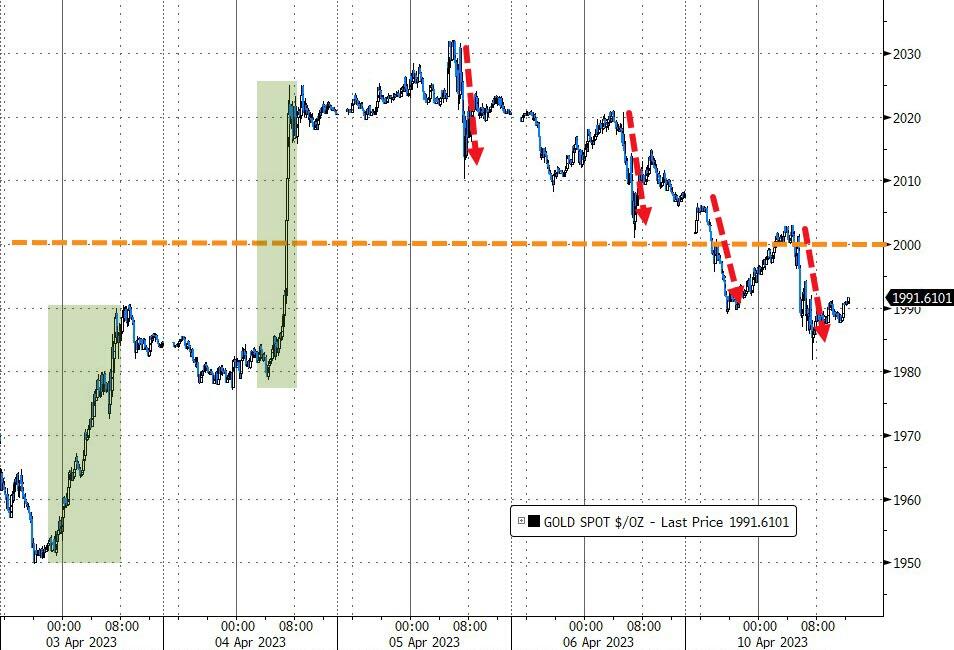
Gold had a chest pounding week but pulled back as yields surged, yet the precious metal reversed during the last hour of trading to “save” its $2k level.
1. From the universe of over 1,800 ETFs, I have selected only those with a trading volume of over $5 million per day (HV ETFs), so that liquidity and a small bid/ask spread are assured.
2. Trend Tracking Indexes (TTIs)
Buy or Sell decisions for Domestic and International ETFs (section 1 and 2), are made based on the respective TTI and its position either above or below its long-term M/A (Moving Average). A crossing of the trend line from below accompanied by some staying power above constitutes a “Buy” signal. Conversely, a clear break below the line constitutes a “Sell” signal. Additionally, I use a 12% trailing stop loss on all positions in these categories to control downside risk.
3. All other investment arenas do not have a TTI and should be traded based on the position of the individual ETF relative to its own respective trend line (%M/A). That’s why those signals are referred to as a “Selective Buy.” In other words, if an ETF crosses its own trendline to the upside, a “Buy” signal is generated. Here too, I recommend trailing sell stop of 12%, or less, depending on your risk tolerance.
If you are unfamiliar with some of the terminology, please see Glossary of Termsand new subscriber information in section 9.
1. DOMESTIC EQUITY ETFs: BUY — since 12/01/2022
Click on chart to enlarge
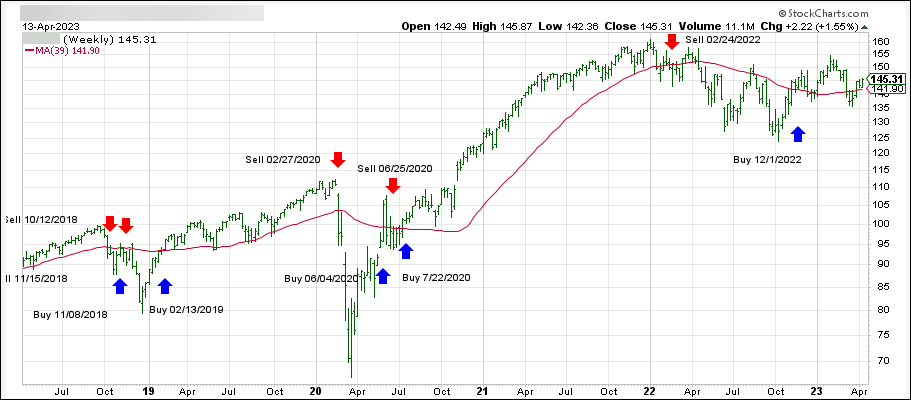
Our main directional indicator, the Domestic Trend Tracking Index (TTI-green line in the above chart) has reclaimed its long-term trend line (red) by +2.75% and remains in “Buy” mode for the time being.
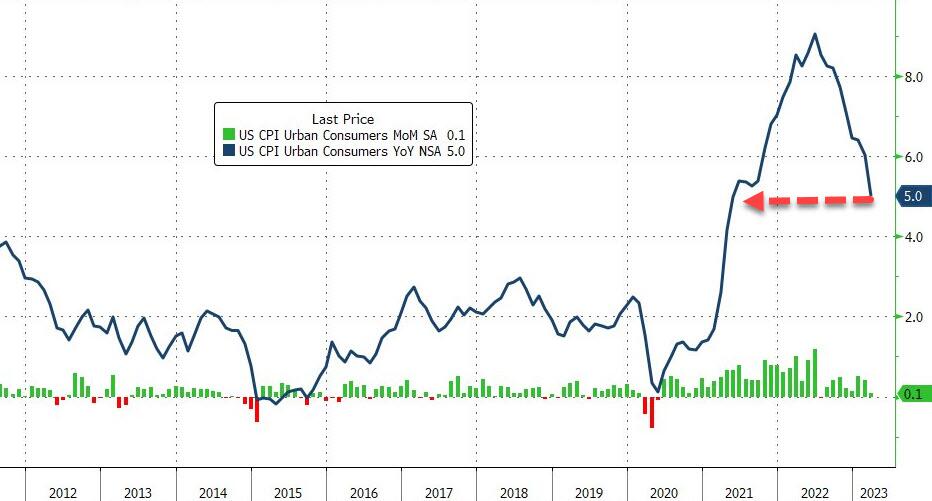
Despite the CPI turning out a bit “cooler” than expected, with the headline number printing +0.1% MoM and +5.0% YoY vs. 5.1% anticipated—and down from 6% YoY prior—the reaction was lukewarm at best.
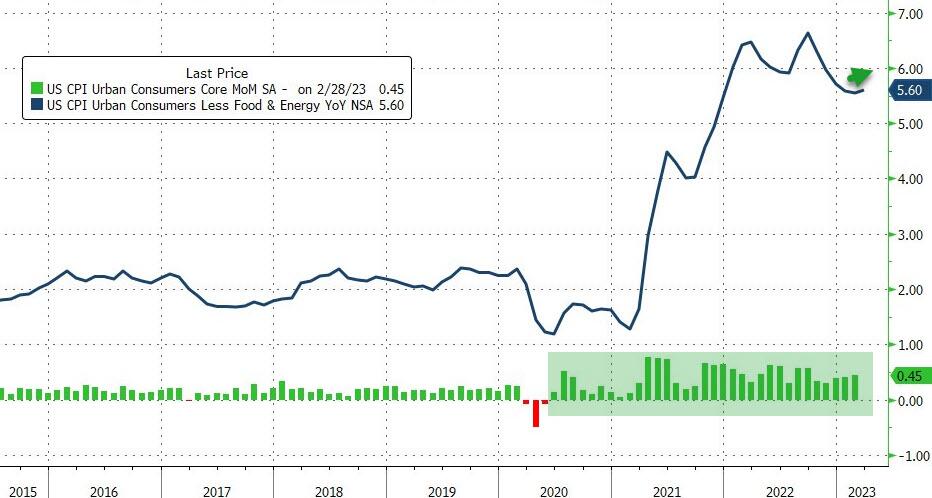
The Fed’s favorite core CPI rose 0.4% MoM, in line with expectations, but it pushed the index up 5.6% YoY, up from a prior 5.5%, as ZH reported.
The market’s initial reaction was positive, yet after an early rally, the major indexes retreated, only to rebound at midday, after which a sudden decline across the board pushed all three of them into the red.
This kind of directional indecision appears to have been caused by the Fed’s release of the March minutes, which showed that officials were alarmed that the economy could slip into a mild recession later this year, with a potential recovery slated over the subsequent two years.
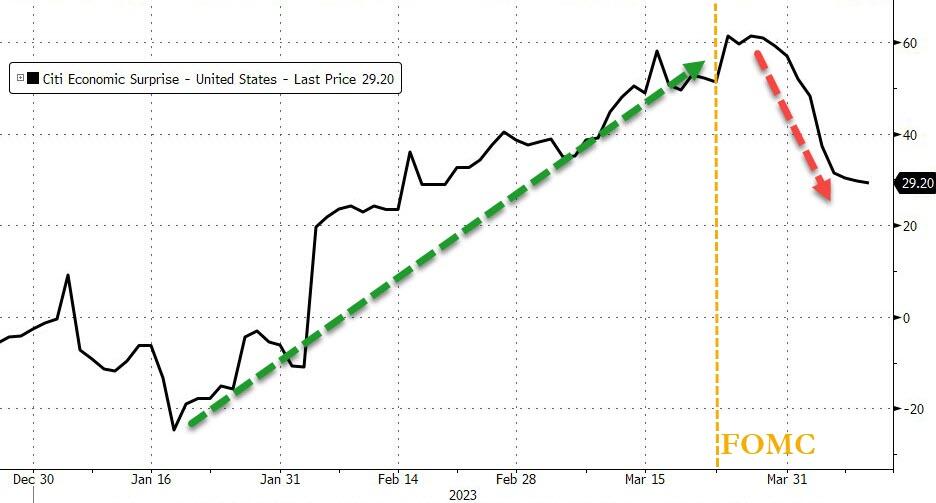
The Citi Economic Surprise index seems to confirm the fact that not all is well with the domestic economy, as the banking crisis, which is far from being over, has done its part to make the current environment appear to be not up to par.
Not helping the bulls to gain momentum were a couple of Fed mouthpieces singing from the same hymn sheet from a month ago that “policy makers have more work to do,” and “there are good reasons to think that policy may have to tighten more to bring inflation down,” along similar bon mots.
None of this is new, as the Fed had made it clear last year that rate hikes for “higher and longer” would be on the agenda, but that theme has been lost on traders and algos, who refuse to believe that a pause is not on the current horizon.
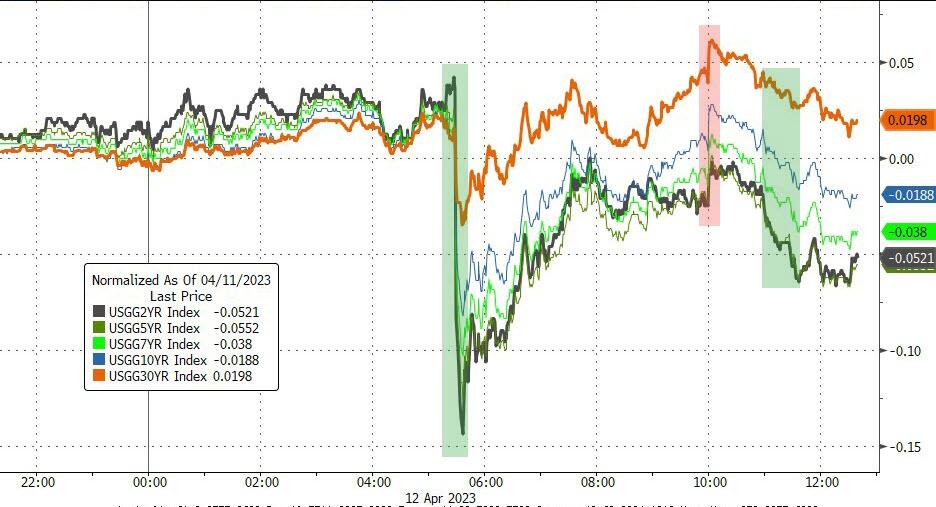
Bond yields went on a wild ride, ended the session just about unchanged, but the 10-year was yanked off its high and back below the 4% level. The US Dollar dove after the dovish CPI print, while Gold rode its own rollercoaster but managed to add another 0.45% to its impressive YTD gains.
Tomorrow, it’s up to the Producer Price Index (PPI) to determine short-term market direction.
Despite the Dow and the S&P bouncing above their respective unchanged lines throughout the session, in the end not much was gained, as traders tried to elude possible negative consequences ahead of key inflation data.
It’s worth noting that tomorrow’s CPI and Thursday’s PPI report are the last critical inflation data points before the Fed meets next, which will be on May 3rd.
At that point, they will re-evaluate their fight to control inflation via rate hikes, whether their current policy is on target, or if it needs to be adjusted. The latter is what traders are looking for, while hoping that any adjustment will tilt towards a dovish stance, which will then give a boost to equities—at least in theory.
Also on deck is the earnings season, with banks starting to post their report cards this coming Friday, so traders are eager to find out if last month’s banking crisis impeded their bottom lines.
Bond yields inched higher for the 3rd straight day, while the odds of a 0.25% hike in May stayed around the 70% level. The US Dollar dropped, and Gold popped another +0.80% to close at $2,020.
Today’s activity seemed dull and uninspiring, but the next two days could change that in a hurry.
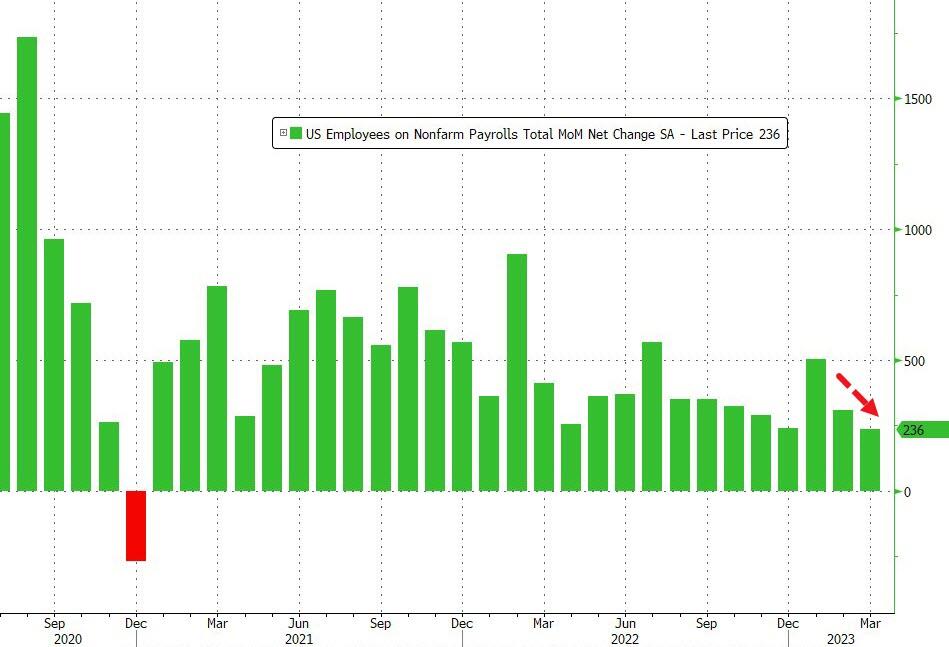
Friday’s March payroll report was largely in line with expectations, as 236k new jobs were created, which was slightly above the 230k anticipated, while the unemployment rate dipped from 3.6% to 3.5%.
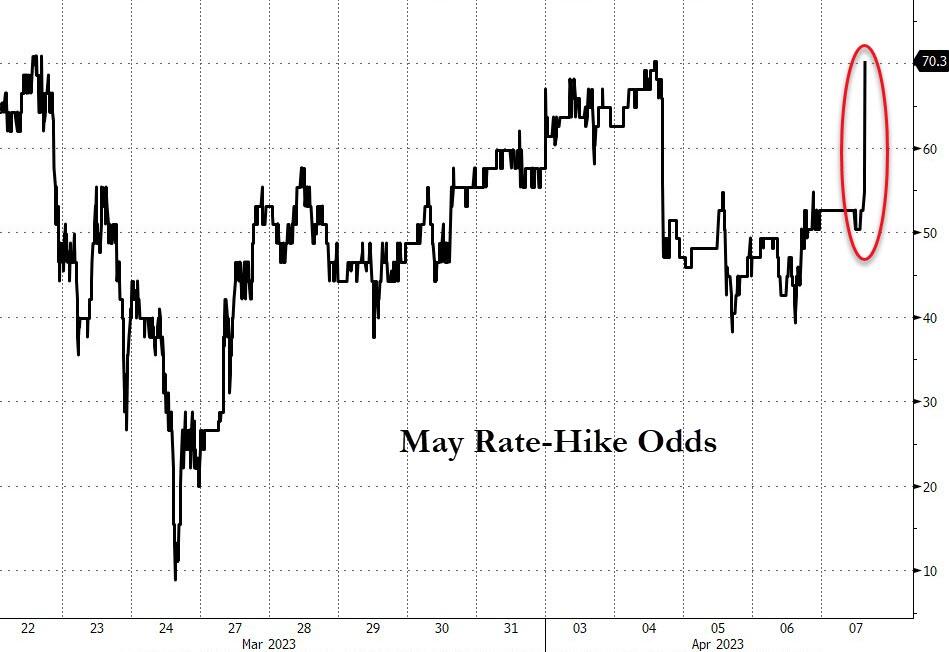
That number might compel the Fed to remain hawkish for longer with the May Rate-Hike odds now having climbed from 50% to over 70%, which had bond yields spiking first before fading.
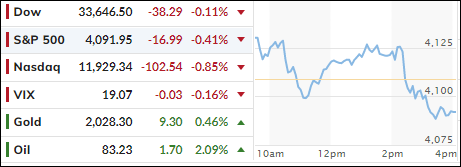
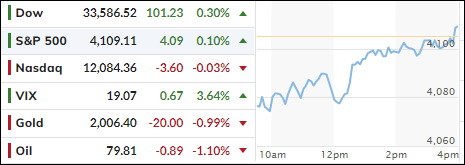
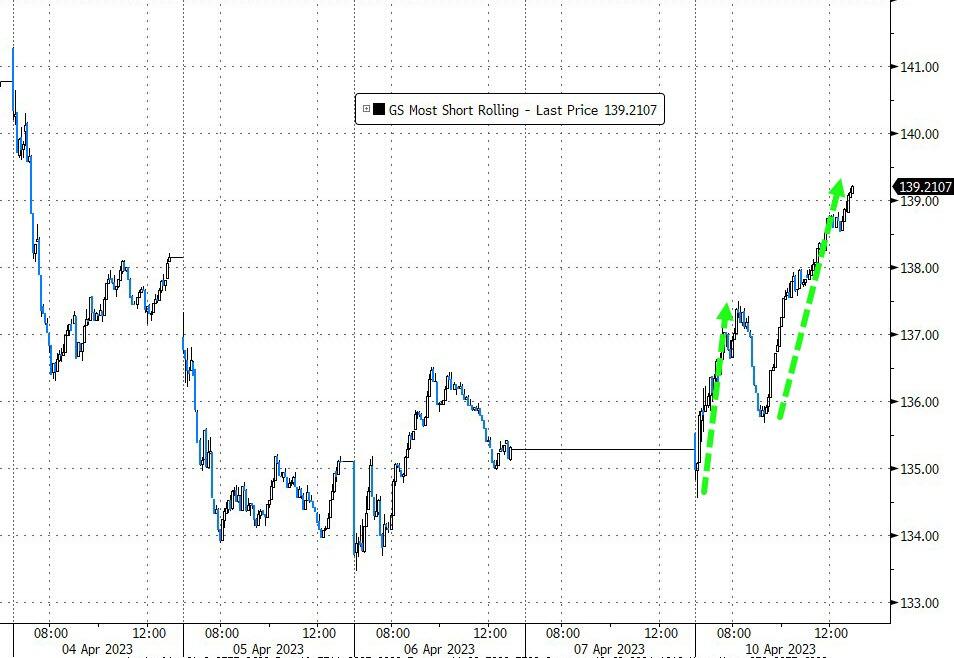
We started the day on a weak note, as the chart above shows, but in the end a slow long grind higher, assisted by a short squeeze, pushed the major indexes back to their respective unchanged lines—with not much lost or gained.
Traders seemed to be on edge and are staring at this week’s upcoming key inflation data. Wednesday, the CPI number is on deck, which is followed Thursday by the PPI data, both of which will be key in determining what the Fed’s next move might be. Will it be a pause and an end to its hiking campaign, or will they continue with a more moderate hiking schedule? My guess is the latter.
We saw a bit of a reversal from last week’s action in that Bond yields spiked, the US Dollar bounced back, rate-hike odds rose, and gold came off its lofty high but closed above its $2k level.
All eyes are now on the release of the inflation numbers, which likely will cause traders and algos to spring back into action.