Below, you can evaluate the latest High-Volume ETF Cutline report, which shows how far above or below their respective long-term trend lines (39-week SMA) my currently tracked ETFs are positioned.
This report covers the HV ETF Master List from Thursday’s StatSheet and includes 312 High Volume ETFs, defined as those with an average daily volume of more than $5 million, of which currently 221 (last report: 210) are hovering in bullish territory. The yellow line separates those ETFs that are positioned above their trend line (%M/A) from those that have dropped below it.
In case you are not familiar with some of the terminology used in the reports, please read the Glossary of Terms. If you missed the original post about the Cutline approach, you can read it here.
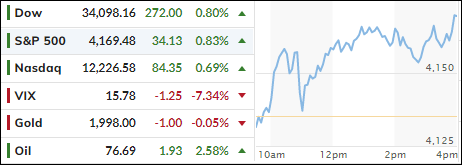
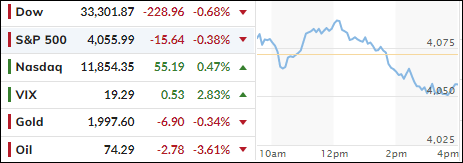
If it hadn’t been for the Ramp-A-Thon over the last two trading days of the month, the S&P 500 would have ended in the red during April.
The Fed’s favorite Personal Consumption Expenditure price index (PCE) rose 0.3% in March, meeting expectations and therefore supporting the bullish theme for the moment.
Earnings were mixed, but FactSet reported that just over half of the S&P 500 companies have reported earnings so far, with 80% beating he much-lowered expectations, which in Wall Street’s way of looking at things creates a better sentiment, as markets don’t like to hear about misses. Go figure…
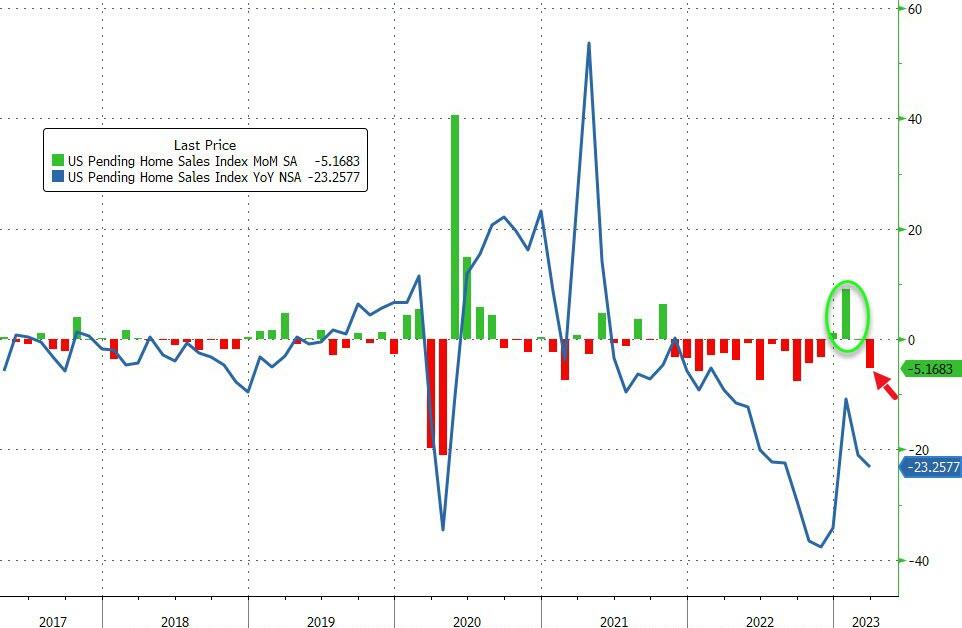
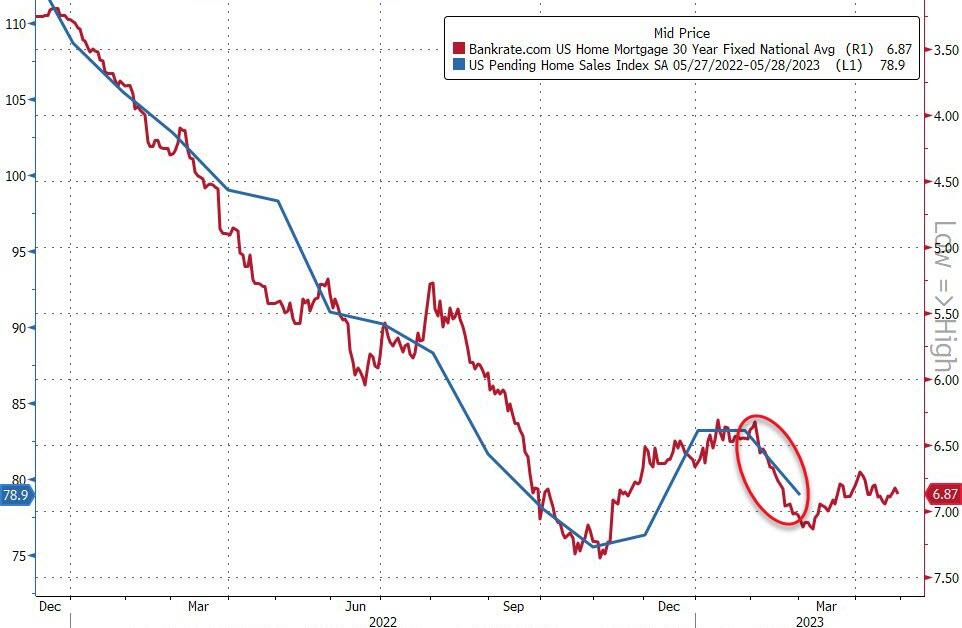
Yesterday’s economic news showed that Pending Home Sales dropped in March, as mortgage rates surged. Even the fact that Q1 GDP turned out much weaker than expected, as it slid from 3% in late March to only 1.1% yesterday, it could not generate a bearish response.
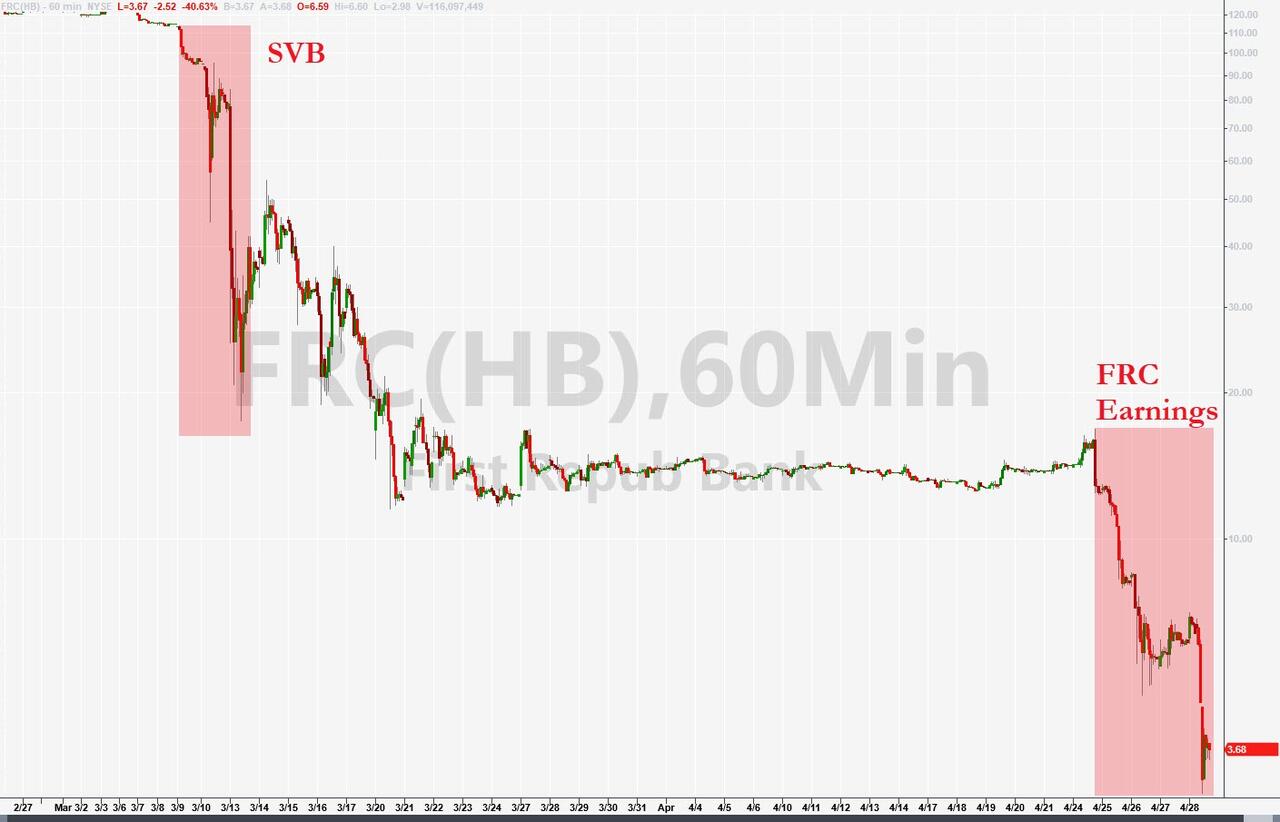
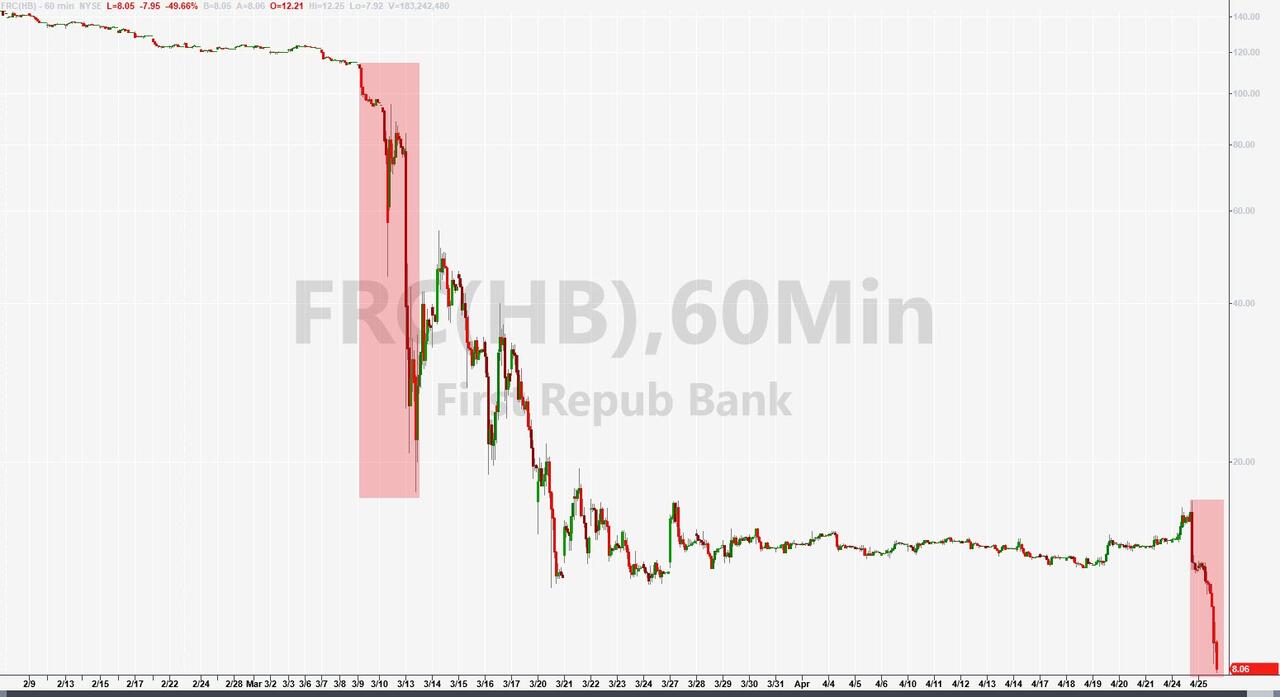
First Republic Bank (FRC) seems to be the next cockroach on the chopping block, after hope for a private deal turned out to be misplaced, with the stock taking another dump. The potential for a weekend bailout certainly exists, and could create a systemic threat, but none of that was able to disturb the bullish mood during this last trading day of April.
Not even the prospect of looming US debt defaults provided hesitancy in the markets due to the above-mentioned fantasy of “earnings beats” overriding all concerns. I suspect that this exuberant attitude will come to an end, as we move into May.
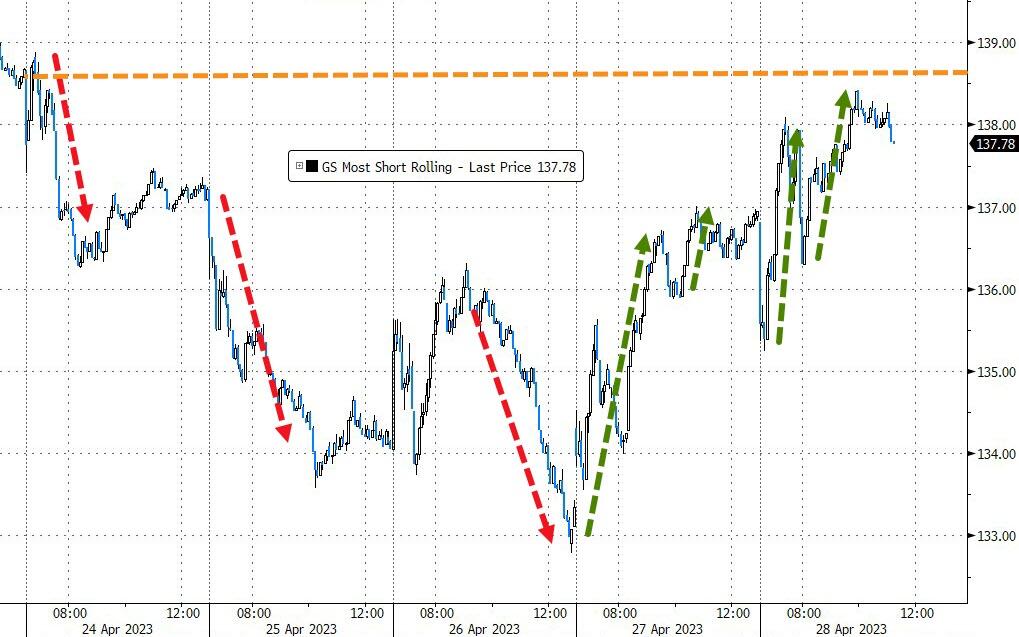
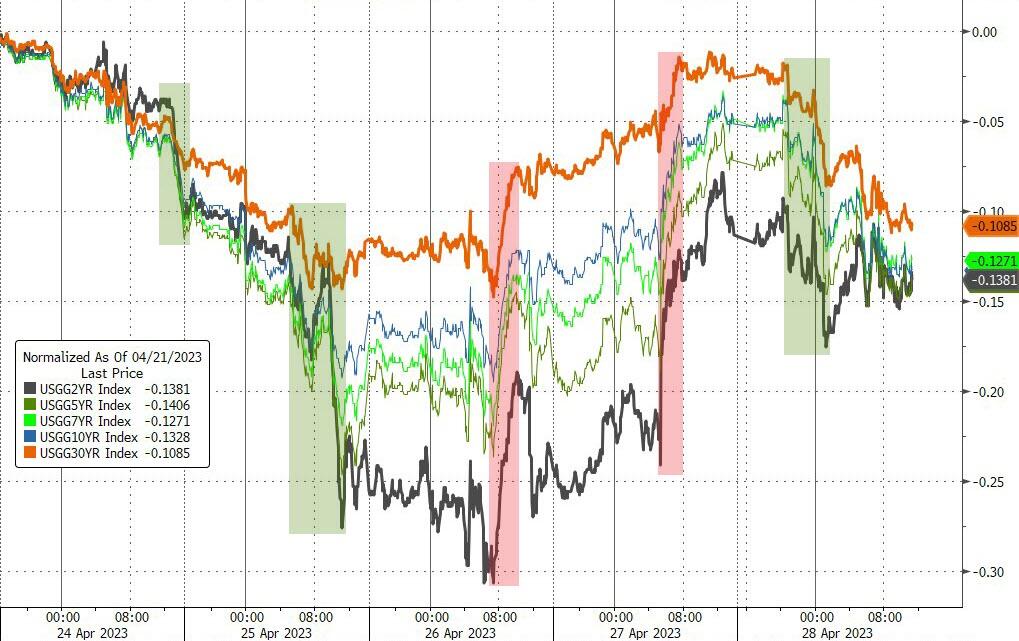
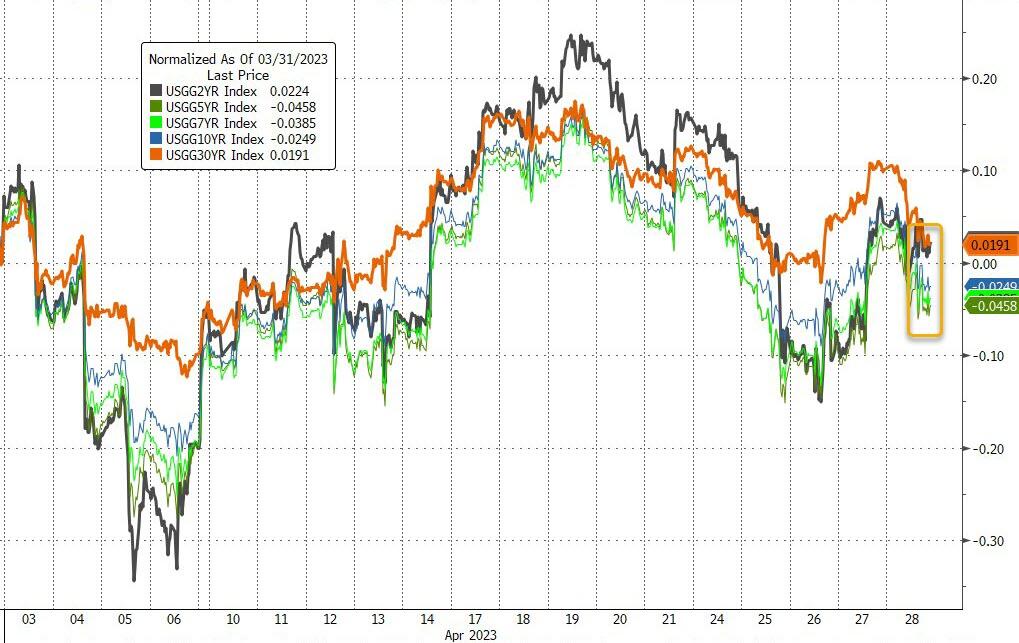
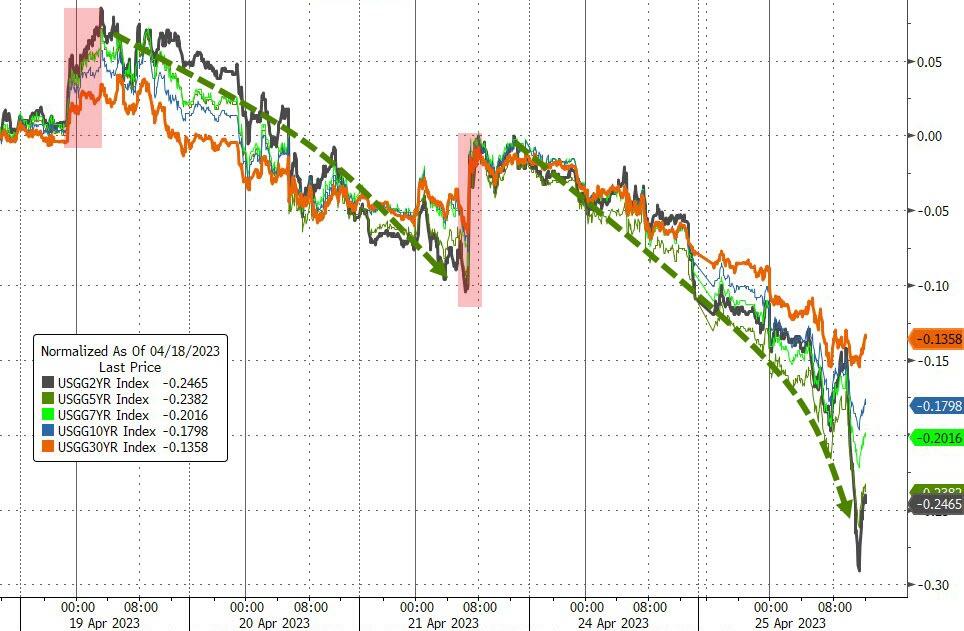
Of course, these kinds of bullish moves never happen in isolation, so it came as no surprise that the usual short-squeeze made its presence felt and assisted with this 2-day bullish run. Bond yields slipped for the week but were unchanged for the month.
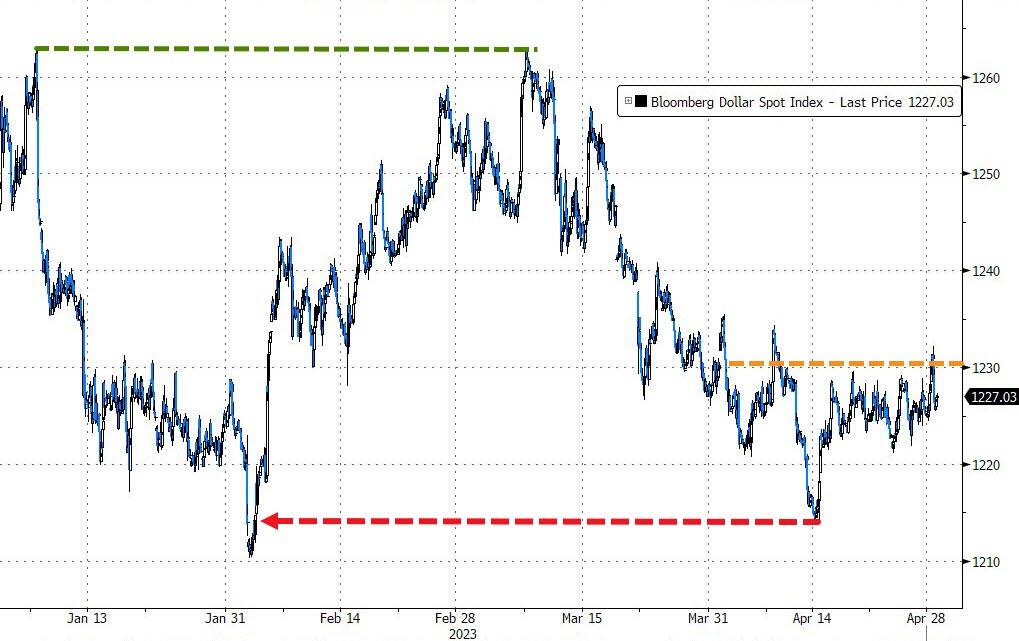
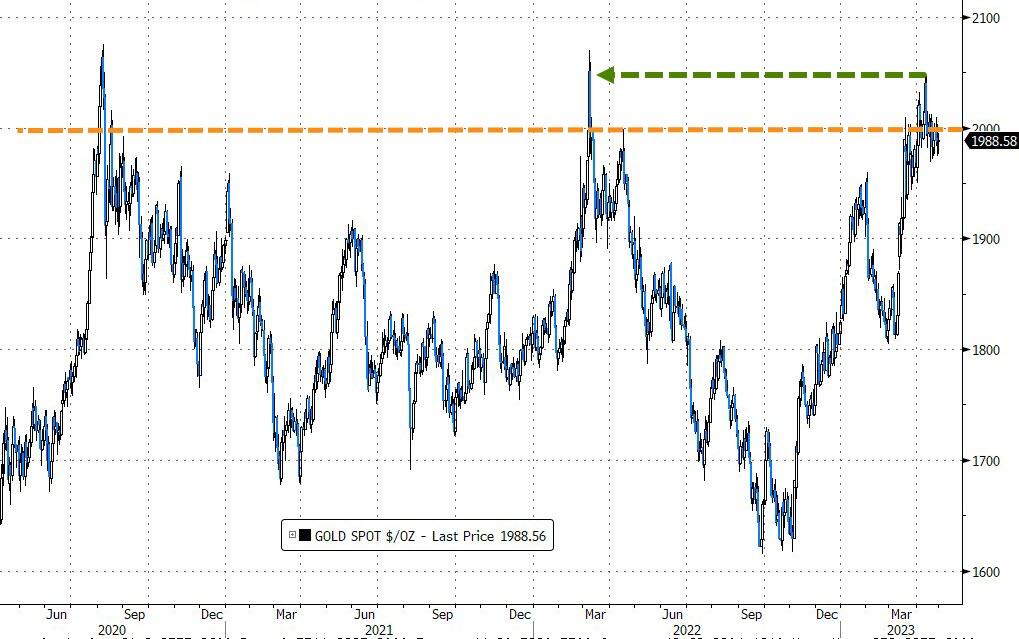
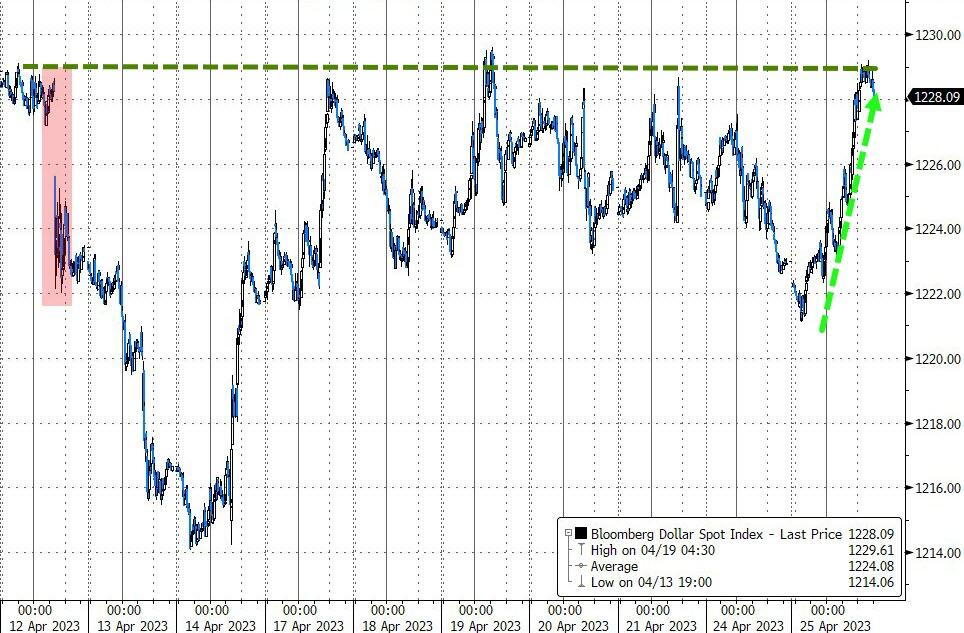
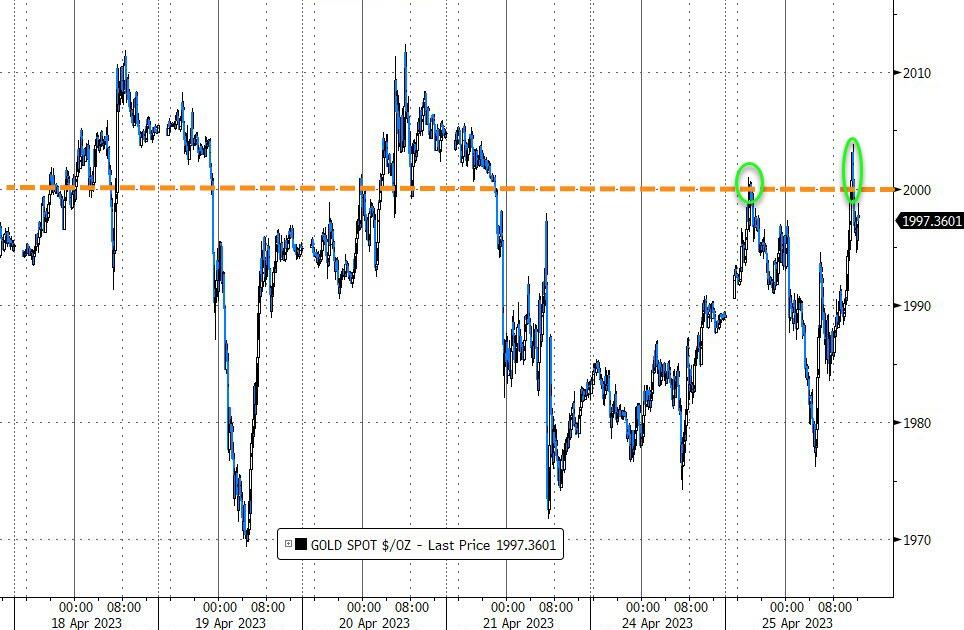
The US Dollar swung wildly during the past 30 days and closed a tad lower, while Gold eked out a tiny gain.
On a personal note, I will be out Monday afternoon, so I won’t be able write the usual market commentary. However, should the markets behave in a way that threatens our current “Buy” mode, I will post a short update by 6 pm PST.
1. From the universe of over 1,800 ETFs, I have selected only those with a trading volume of over $5 million per day (HV ETFs), so that liquidity and a small bid/ask spread are assured.
2. Trend Tracking Indexes (TTIs)
Buy or Sell decisions for Domestic and International ETFs (section 1 and 2), are made based on the respective TTI and its position either above or below its long-term M/A (Moving Average). A crossing of the trend line from below accompanied by some staying power above constitutes a “Buy” signal. Conversely, a clear break below the line constitutes a “Sell” signal. Additionally, I use a 12% trailing stop loss on all positions in these categories to control downside risk.
3. All other investment arenas do not have a TTI and should be traded based on the position of the individual ETF relative to its own respective trend line (%M/A). That’s why those signals are referred to as a “Selective Buy.” In other words, if an ETF crosses its own trendline to the upside, a “Buy” signal is generated. Here too, I recommend trailing sell stop of 12%, or less, depending on your risk tolerance.
If you are unfamiliar with some of the terminology, please see Glossary of Termsand new subscriber information in section 9.
1. DOMESTIC EQUITY ETFs: BUY — since 12/01/2022
Click on chart to enlarge
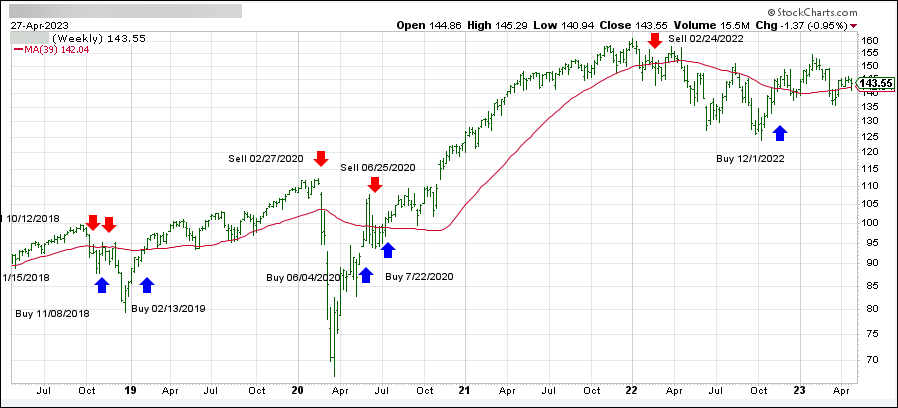
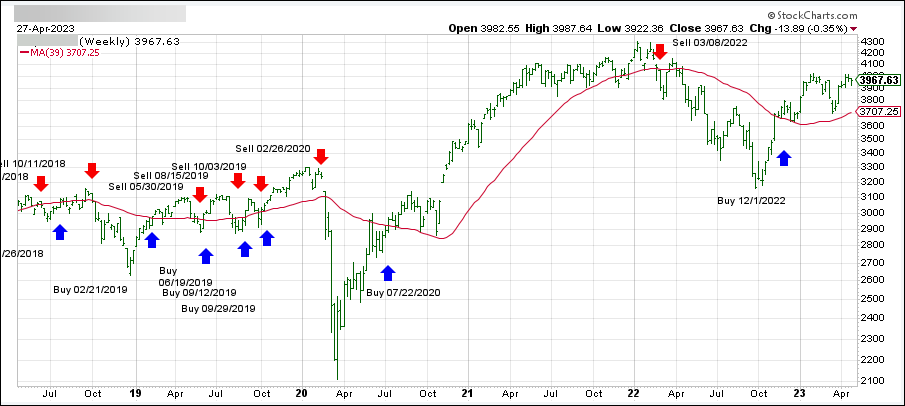
Our main directional indicator, the Domestic Trend Tracking Index (TTI-green line in the above chart) has reclaimed its long-term trend line (red) by +1.03% and remains in “Buy” mode for the time being.
The link below shows all High Volume (HV) Domestic Equity ETFs. The sorting order is by M-Index ranking. Prices in all linked tables below are updated through 04/27/2023, unless otherwise noted. Price data not yet available at publication is indicated with 00.00% or -100.00%. Please note that distributions are not included in the current momentum numbers.
Whenever the TTI is above the trend line, and therefore in “Buy” mode, you can use the tables in the link below to make your selections:
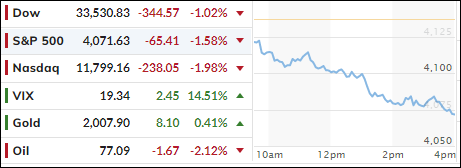
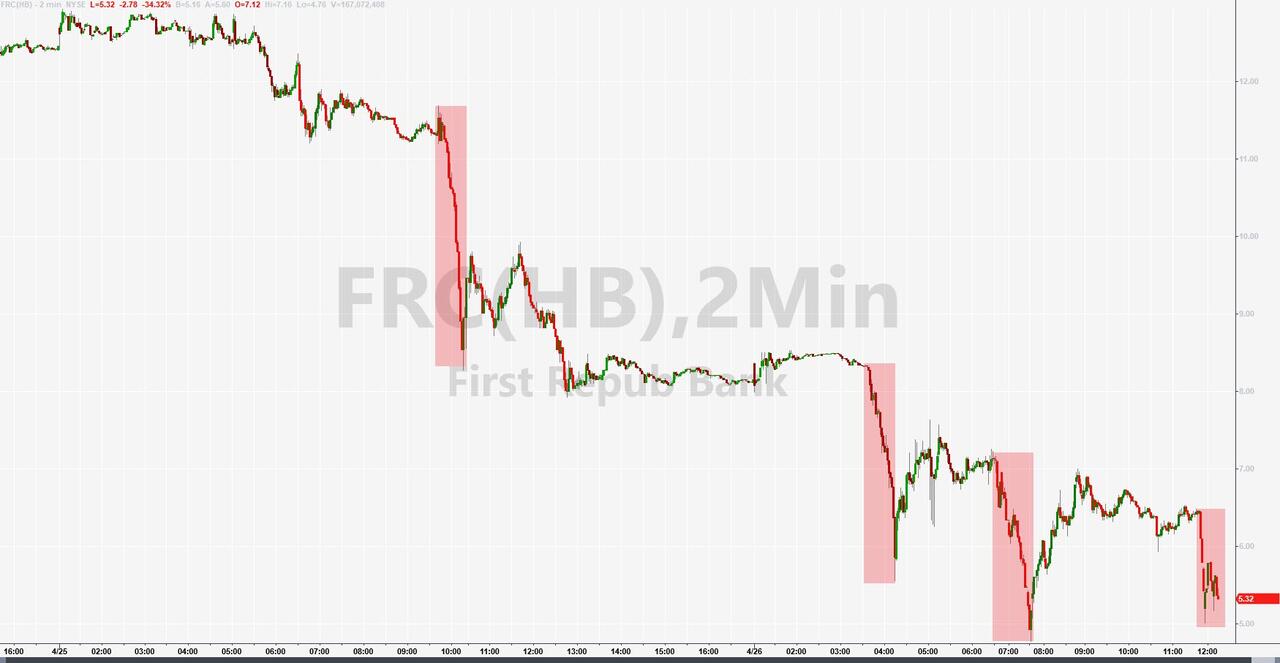
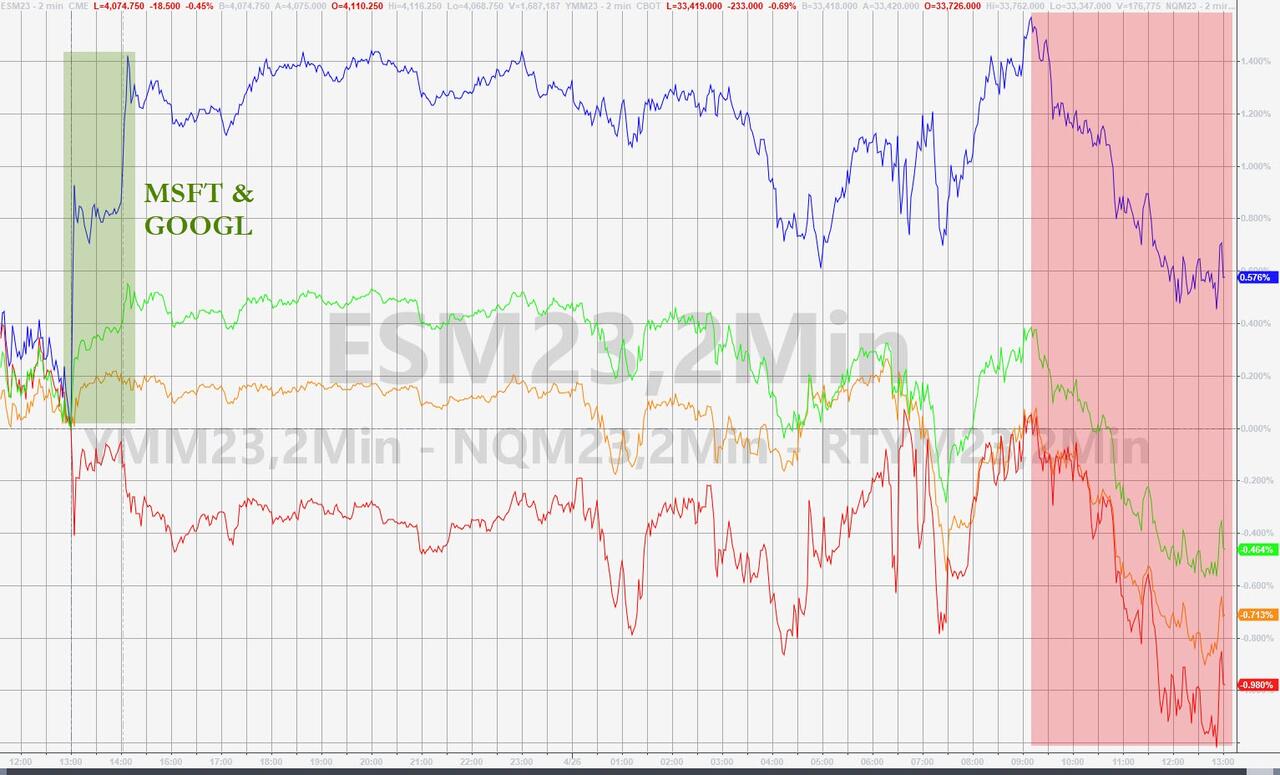
Despite positive earnings from Microsoft and Google after the close yesterday, the troubles of First Republic Bank (FRC) continued today and overshadowed all news with the stock sliding another 30% on top of yesterday’s 50% dump.
As I have repeatedly pointed out, there is never just one cockroach, a theory which appears to be correct again, as concerns about the banking system were moved to the front burner once more. If FRC gets downgraded by regulators, that would impair their ability to borrow from the Fed, which then would pretty much assure its demise.
In the end, the markets closed in the red for the second day, except for the Nasdaq, which eked out a gain thanks to Microsoft and Google.
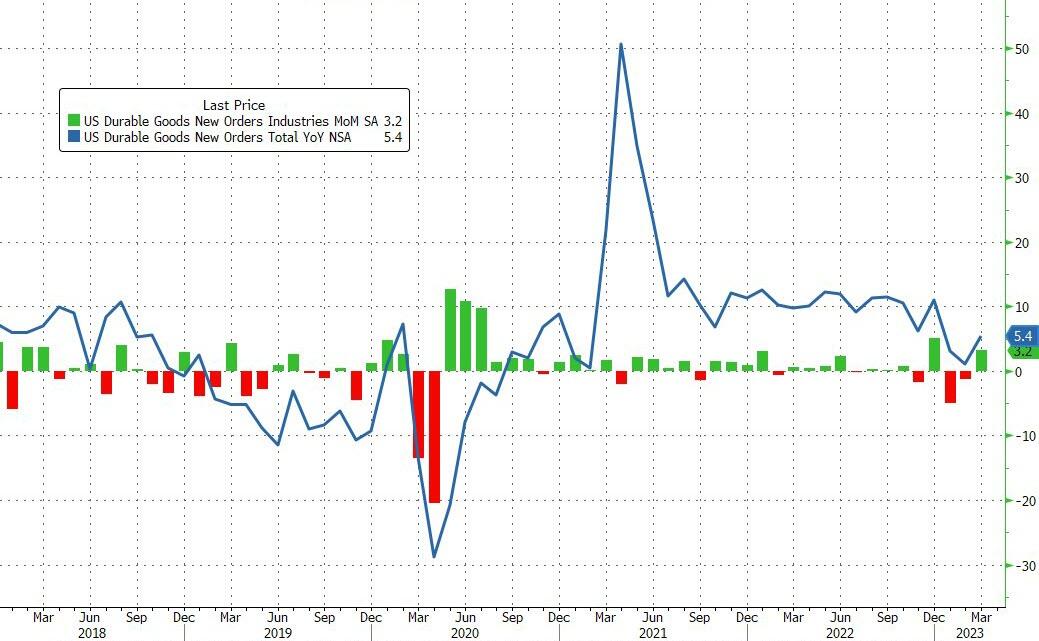
Looking at the big picture, we saw surprisingly better than expected Durable Goods orders, which surged 3.2% MoM, but when looking under the hood, it was not as great as the headline number indicated. Offsetting that was the banking system debacle and the debt ceiling anxiety, all of which combined to sink 2 of the 3 major indexes.
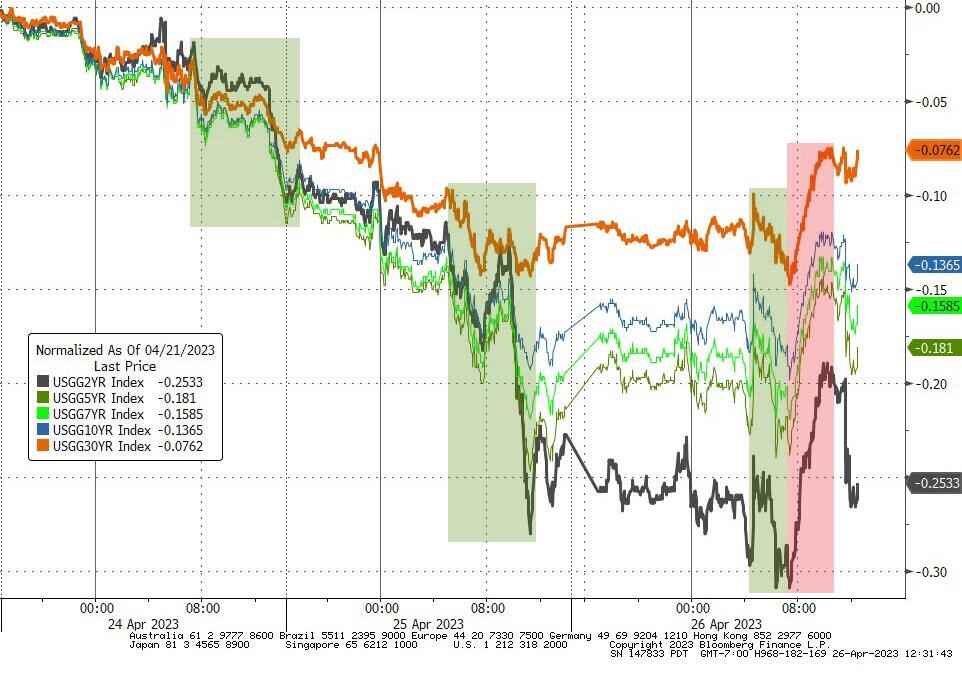
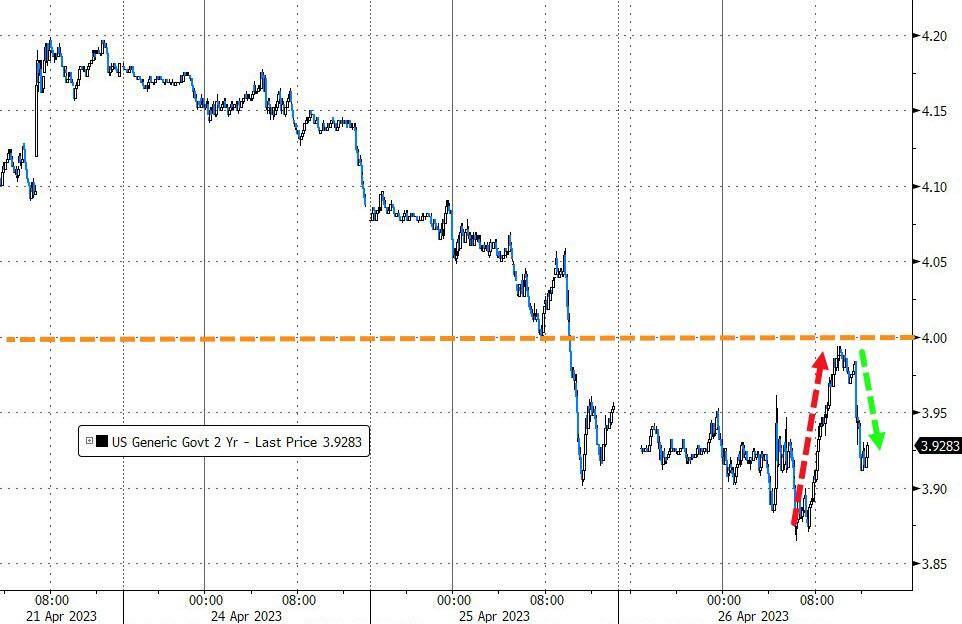
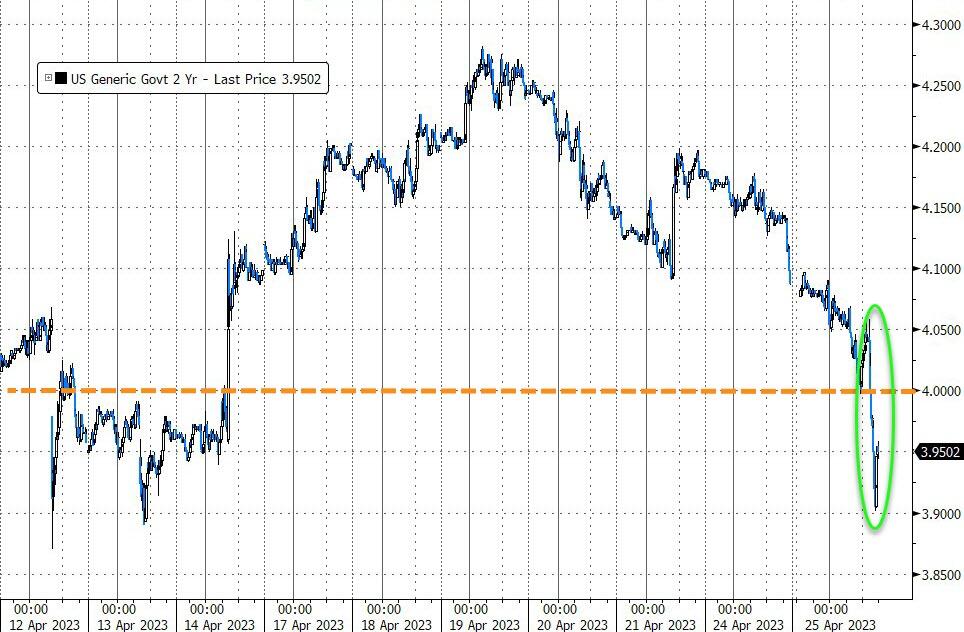
Bond yields were mixed today but rebounded off yesterday’s lows, yet the 2-year was unable to reclaim its much fought-over 4% level.
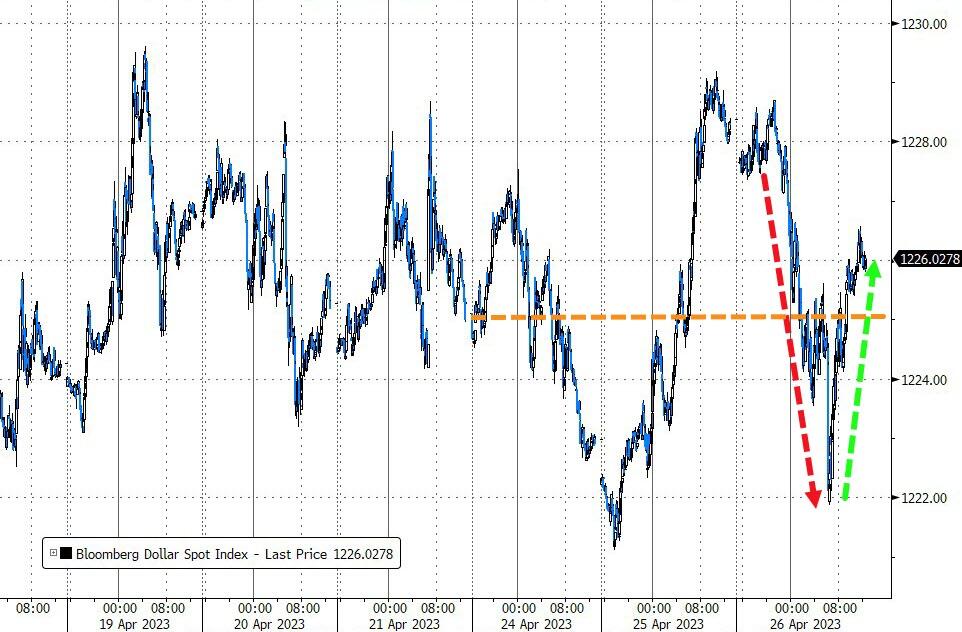
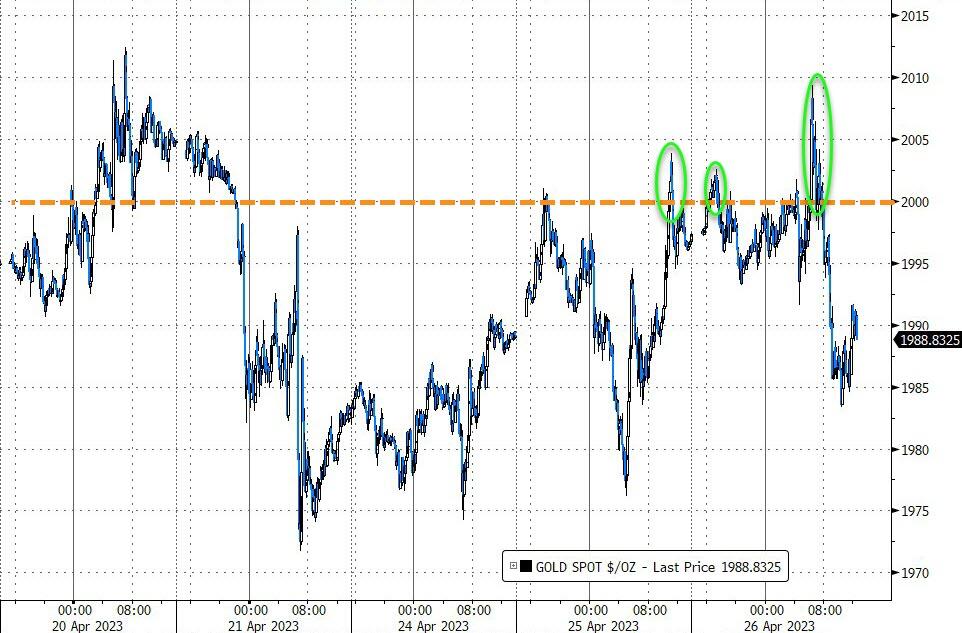
The US Dollar dropped and popped but closed lower, while gold followed suit but was unable to hang on to its mid-day gains.
As we are nearing the end of April, volatility has picked up considerably, which today pulled our Domestic TTI back below its long-term trend line—but only by a small margin. Please see section 3 below for more details.
I was pondering yesterday if, in the absence of a bullish driver, the markets might take the path of least resistance, which would be down. That was the case today, as the major indexes opened in the red, with the bears taking over and manhandling any bullish sentiment with utter ease, thereby assuring a red close.
First Republic Bank’s (FRC) latest earnings set the negative mood and spiked concerns about a broadening of the banking crisis, something that I have posted about since the SVB breakdown.
Shares of FRC got clobbered at the rate of over 49%, after deposits dropped 40% but allegedly have now stabilized. Promises of trimming expenses and slashing headcount did nothing to stem the tide, because investors remained concerned that FRC would experience a similar destiny as Silicon Valley Bank.
Other earnings reports were mixed, but all eyes are now on the report cards of the big boys like Microsoft and Alphabet, which are due out after the close today. Maybe they can restore some bullish sentiment.
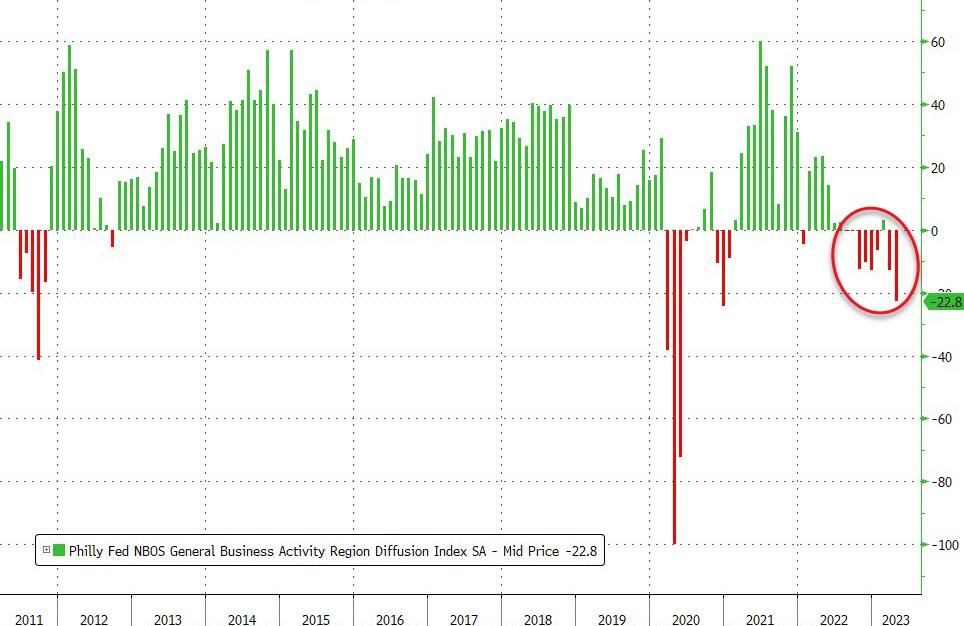
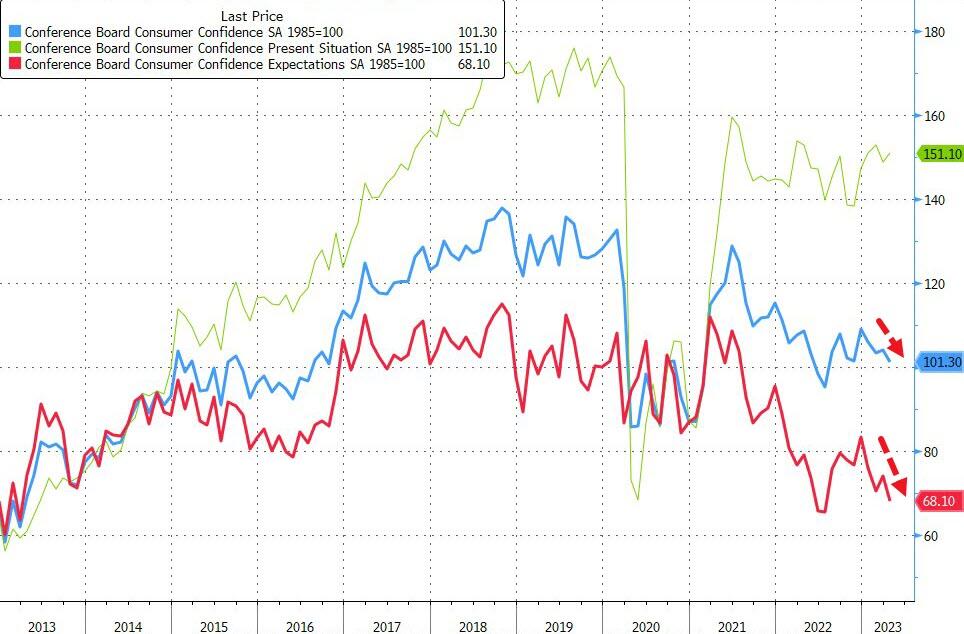
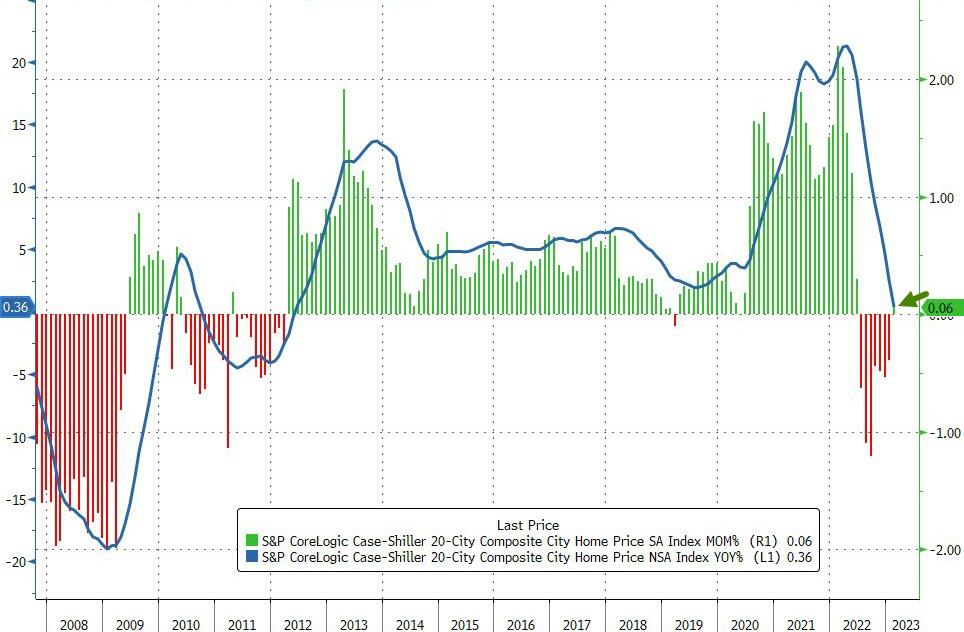
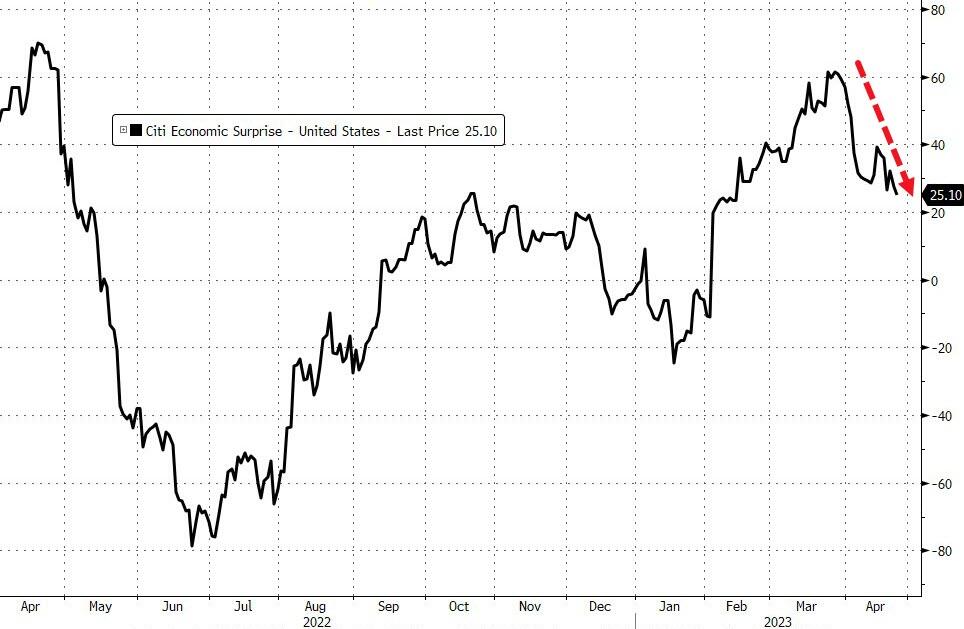
Economic news did nothing to relieve traders of uncertainty, as the Fed’s Services Index dumped to its weakest since Covid, while the Confidence index slumped, and the US Home Growth popped a tad but remained at its slowest in a decade. The combined effect was a further drag on the Citi Surprise Index.
Bond yields plunged with the 2-year again dropping below its 4% level. The US Dollar rebounded despite lower bond yields, and gold made two attempts to reclaim its $2k level but failed. Still, the precious metal gained 0.36% on the session.
I think the markets are too complacent about the upcoming debt ceiling debacle. After all, we are stuck in the middle of an ongoing banking crisis and a deteriorating economy.
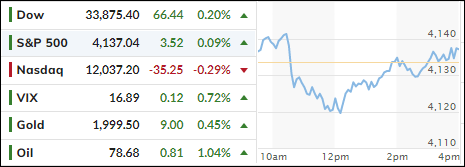
In a repeat of last week’s activity, the major indexes spent most of the session vacillating near their respective unchanged lines but managed to slightly close in the green, with the Nasdaq being the exception.
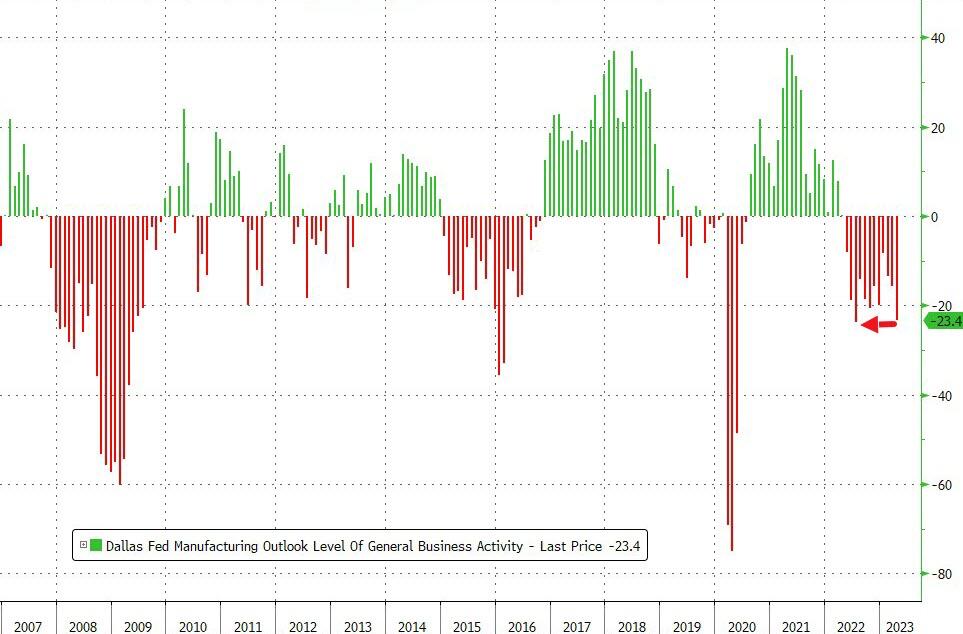
Earnings season, economic data, upcoming Central Bank actions, and geopolitical tensions kept traders and algos on edge causing the indexes again to tread water, as uncertainty reigned supreme. Regarding economic data, manufacturing slumped to post-Covid lows, as the 12th straight month of contraction became a reality.
Data provider FactSet announced that, through this morning, 76% of S&P 500 companies beat sharply reduced earnings estimates, while Refinitiv added that S&P 500 companies overall are projected to decline 5.2% for this past quarter.
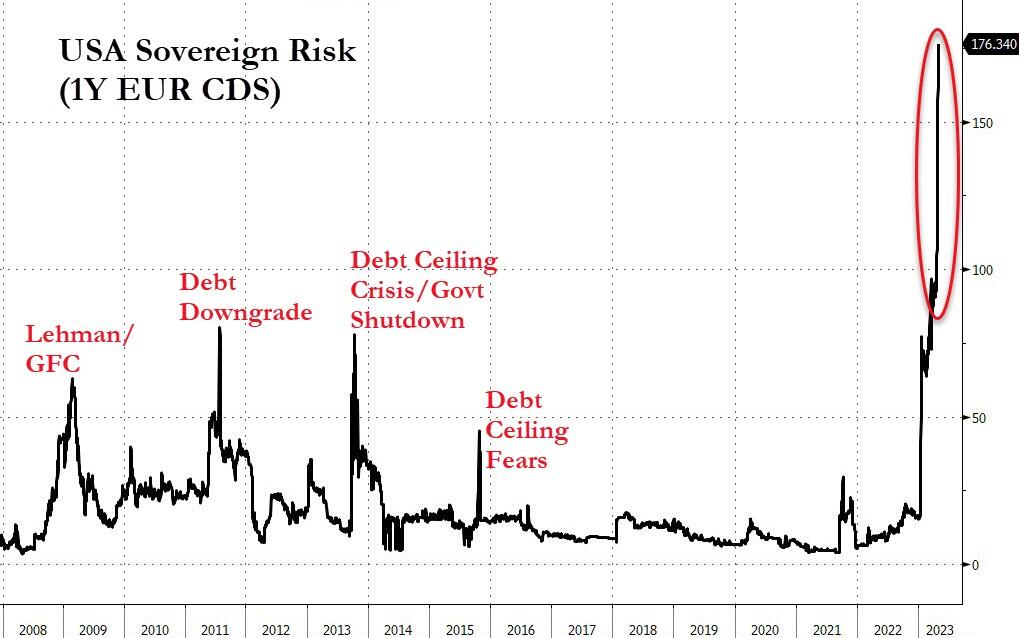
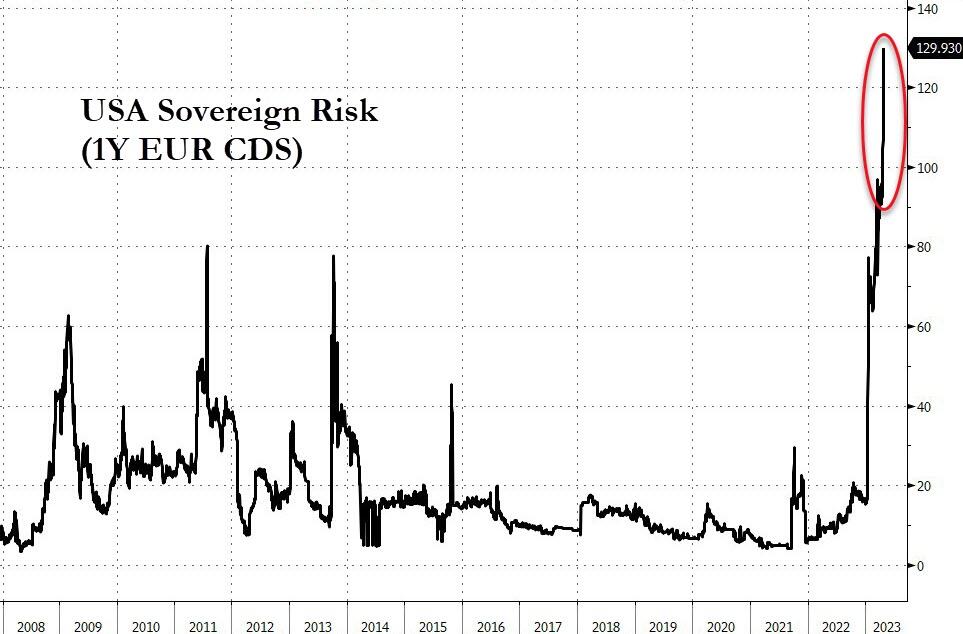
The fact that a technical debt default is a real possibility, according to this chart, has been largely ignored by the financial markets, even though this CDS (Credit Default Swap) has now risen to its highest level ever. Go figure…
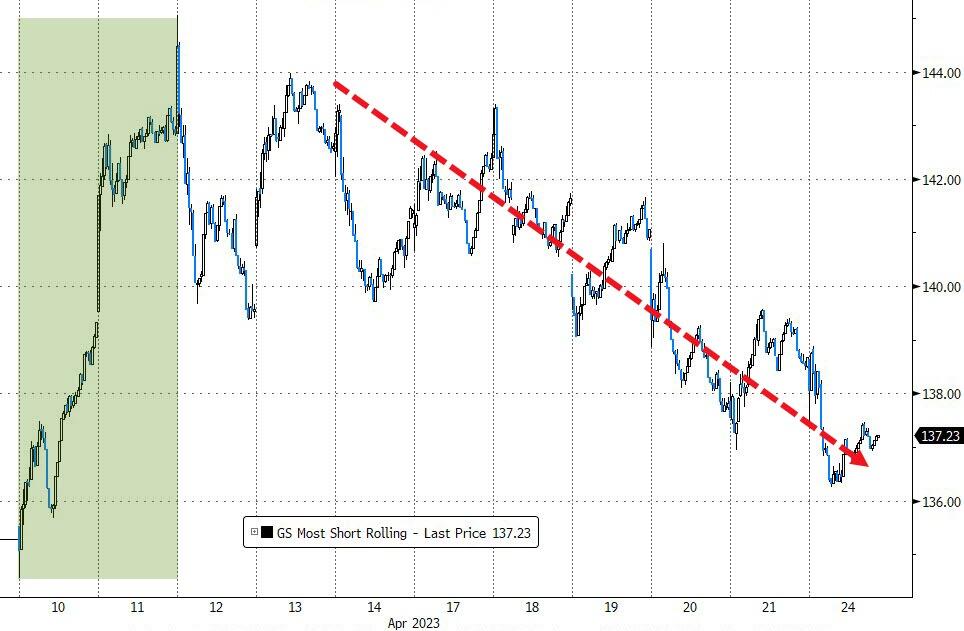
Mid-April’s short squeeze has lost its upward momentum, and the “most shorted” stocks are now acting like they are supposed to, namely drift lower.
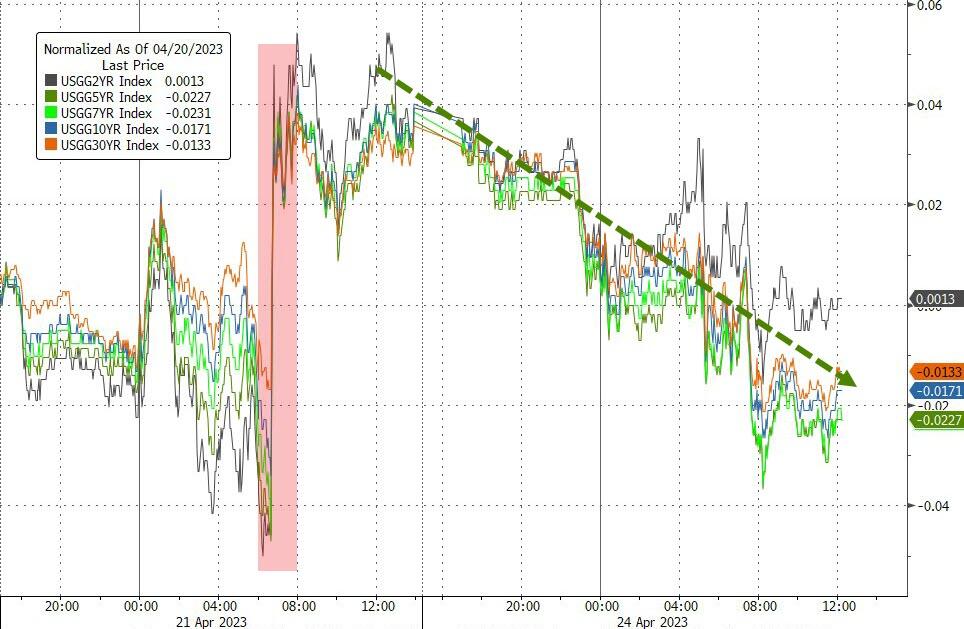
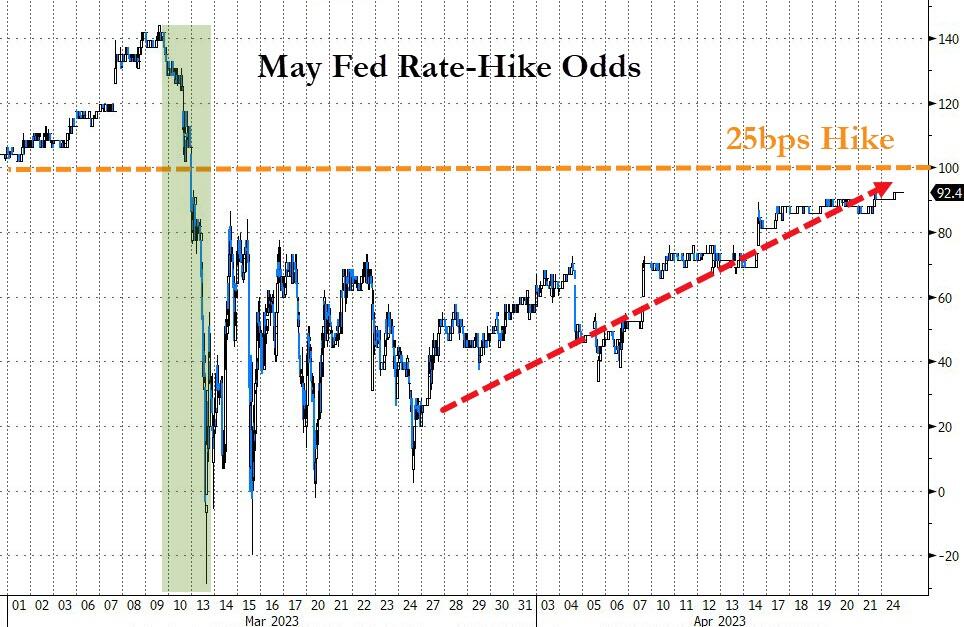
Bond yields retreated from Friday’s high, but May’s rate-hike odds moved higher and are now signaling a 92% chance of a 0.25% hike next week.
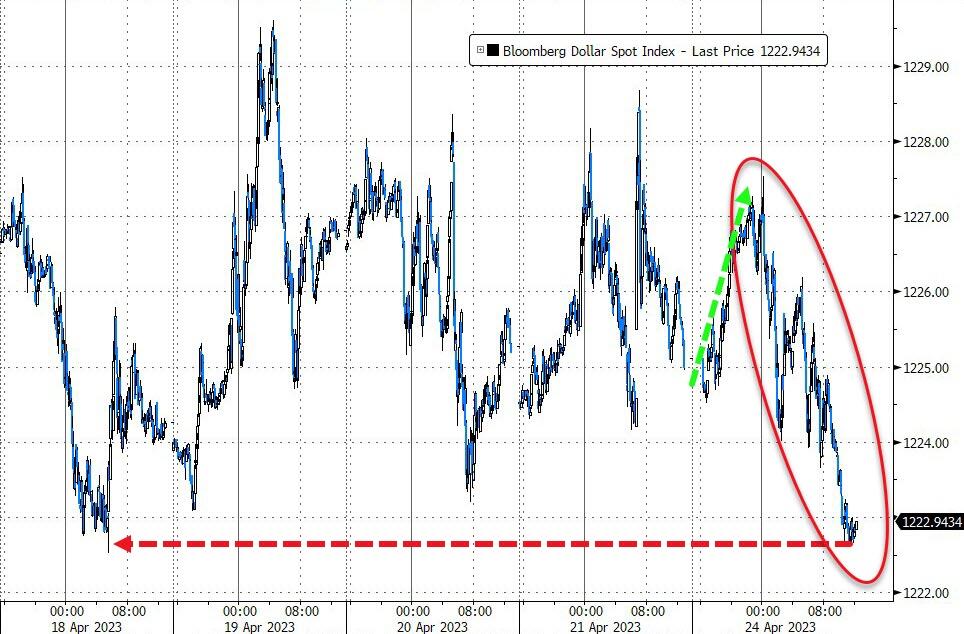
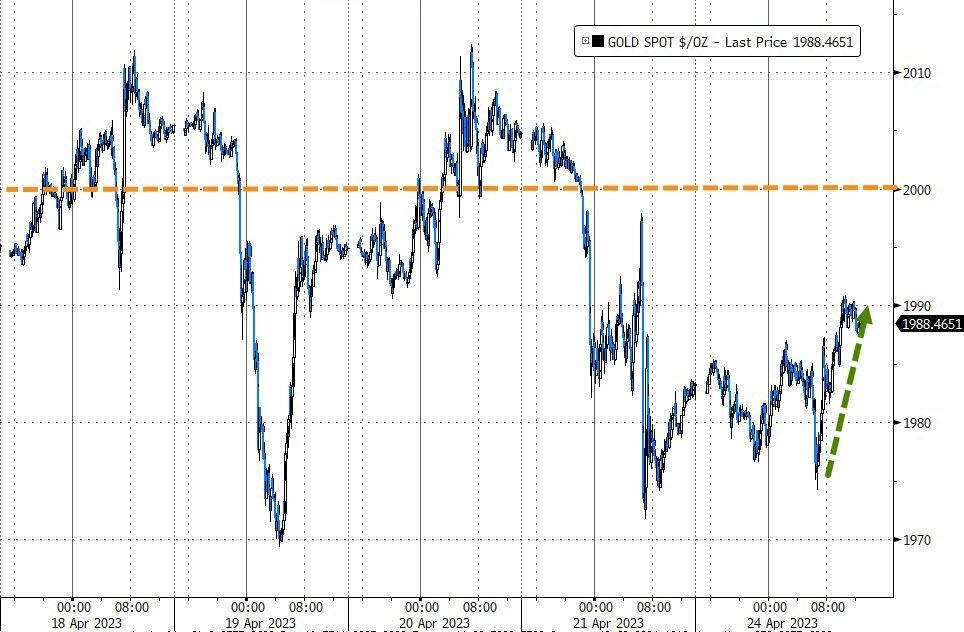
The US Dollar weakened after an early bounce and closed at 4-day lows. That helped gold to rebound, but it was not enough for the precious metal to crack its $2k level.
Observing this directionless behavior over the past week, I am wondering if the next breakout will be to the downside, which appears to be the path of least resistance.