
ETF Tracker StatSheet
You can view the latest version here.
TREADING WATER
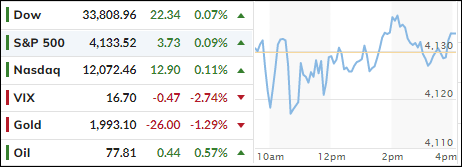
[Chart courtesy of MarketWatch.com]
- Moving the markets
Today’s activity pretty much resembled how the markets fared during this entire week. It was a snooze fest with neither buyers nor sellers being motivated to act, with the result that the S&P 500 lost 4 points, or 0.1%.
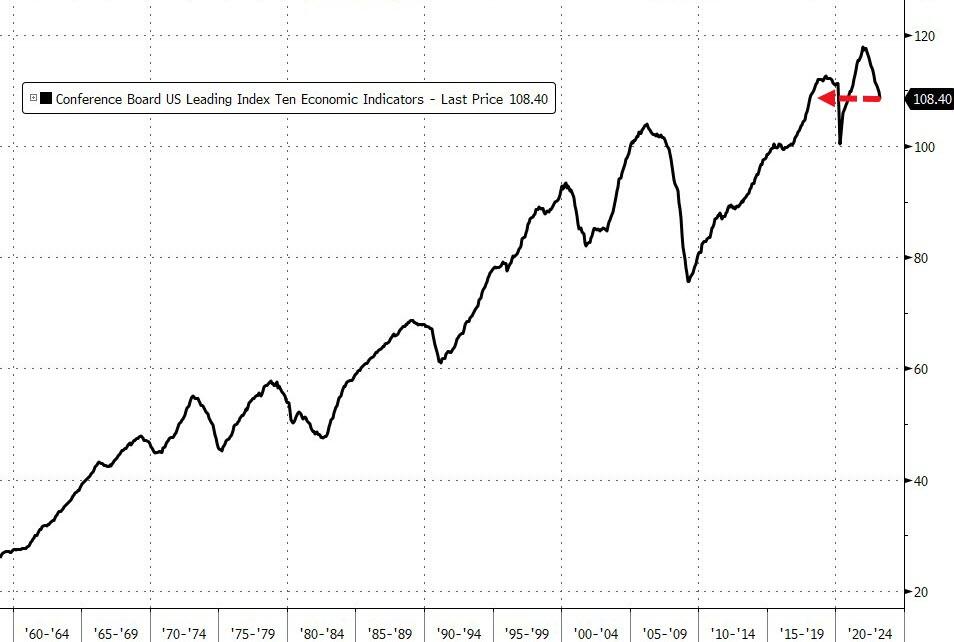
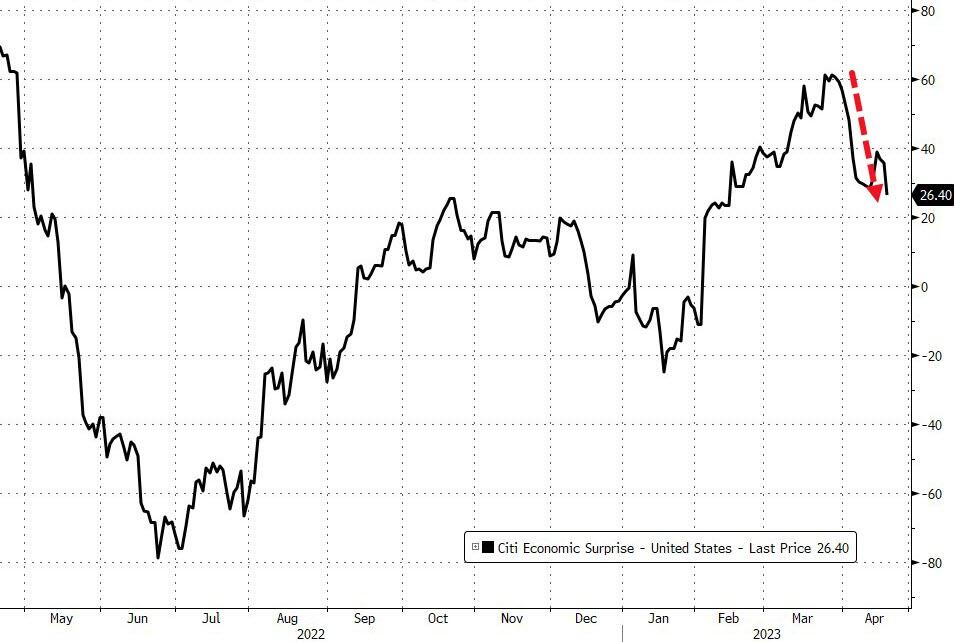
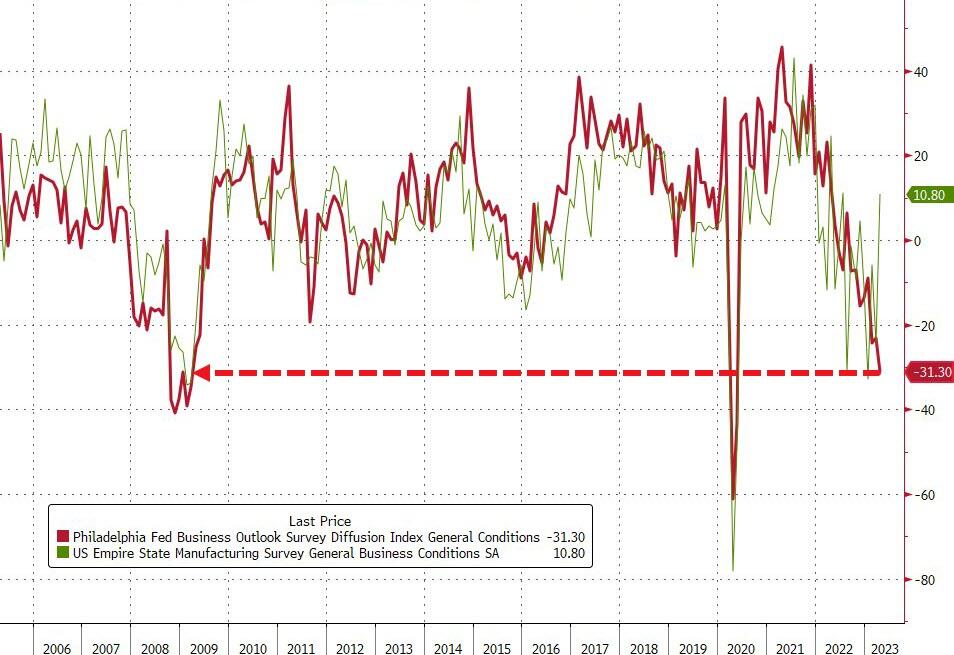
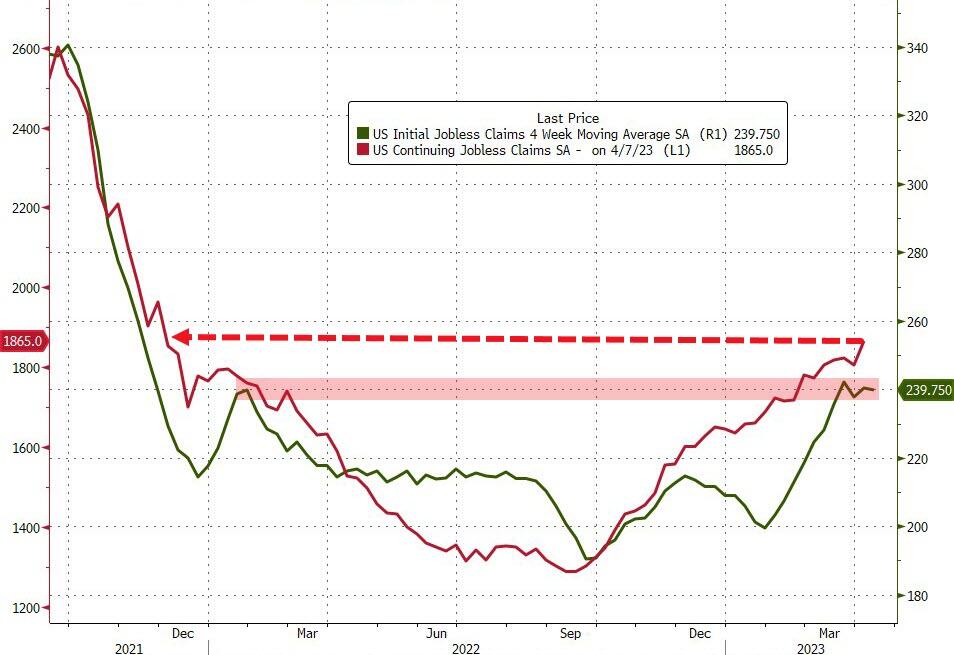
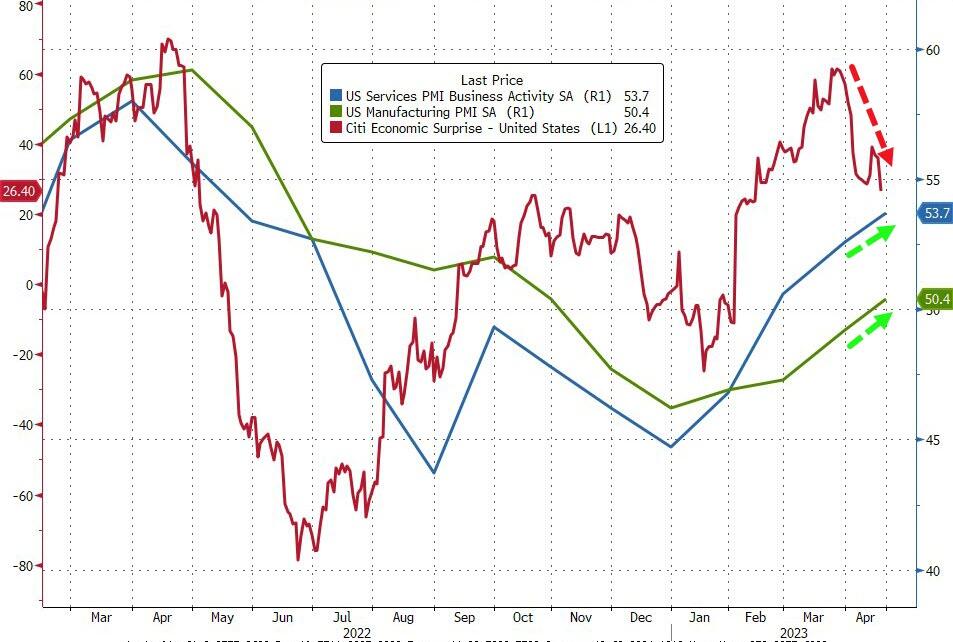
Yesterday, we confronted a host of poor economic data points: The US Leading Indicator tumbled, the debt ceiling fears pulled down the Economic Surprise Index, the Philly Fed Business Survey slumped, the number of Americans claiming jobless benefits hit a 17-monht high, but US Manufacturing was the only green shoot and unexpectedly soared in April, as ZeroHedge reported.
The tug-of-war between bulls and bears ended in a draw this week, with direction lacking. That may continue until it becomes clear if the restrictive Fed monetary policy can overwhelm the case made by many that the economy is more resilient due to stronger-than-expected corporate earnings, which were achievable only due to a much-lowered bar.
For sure, the markets appear stressed in view of the upcoming debt-ceiling debate. Both sides have hardened their views, and just because in the past common ground was found eventually, this time may be different, hence the lack of activity.
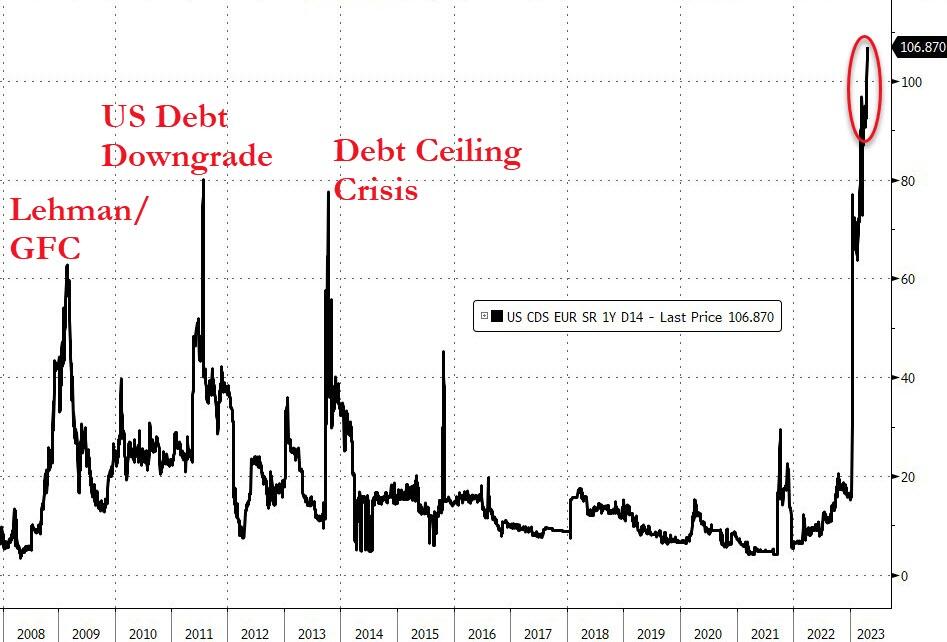
The current high USA risk is reflected by Credit Default Swaps (CDS) hitting their highest in 15 years and surpassing past crisis events.
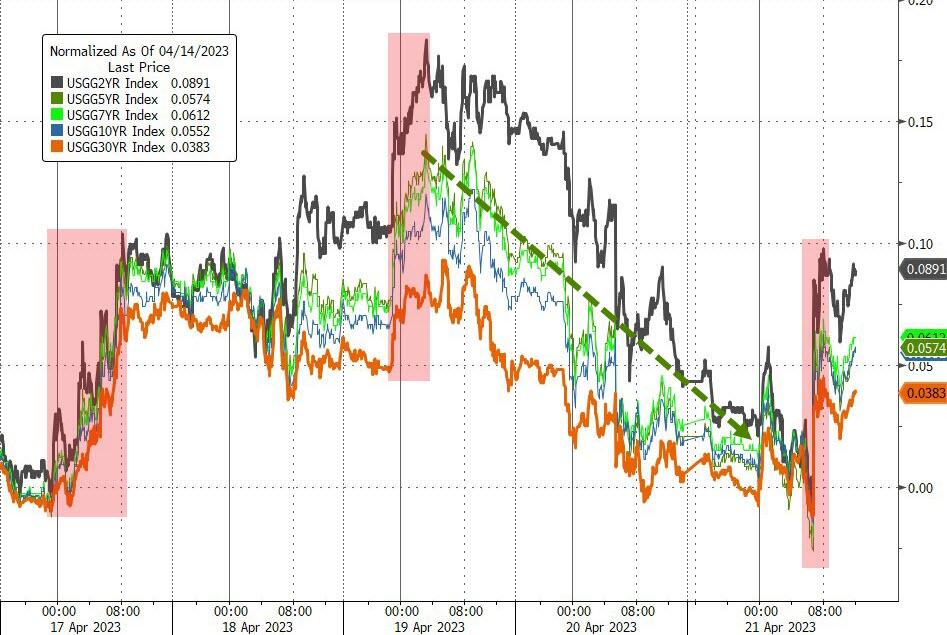
Bond yields rode a roller coaster and ended the week a tad higher, while rate hike expectations continued to rise, with the odds now being 92% that the Fed will hike by 0.25% at the beginning of May.
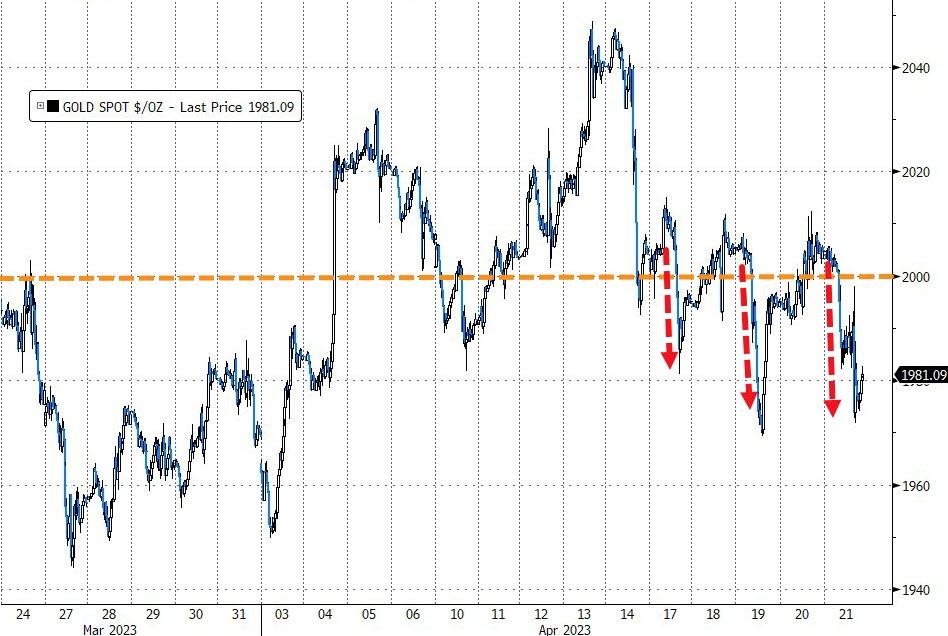
The US Dollar closed out a volatile week to the upside, which caused Gold to lose its $2k level.
Besides 42% of the S&P’s market cap reporting earnings next week, the debt ceiling battle will likely be the focus point for traders and algos alike.
2. “Buy” Cycle Suggestions
For the current Buy cycle, which started on 12/1/2022, I suggested you reference my then current StatSheet for ETF selections. However, if you came on board later, you may want to look at the most recent version, which is published and posted every Thursday at 6:30 pm PST.
I also recommend you consider your risk tolerance when making your selections by dropping down more towards the middle of the M-Index rankings, should you tend to be more risk adverse. Likewise, a partial initial exposure to the markets, say 33% to start with, will reduce your risk in case of a sudden directional turnaround.
We are living in times of great uncertainty, with economic fundamentals steadily deteriorating, which will eventually affect earnings negatively and, by association, stock prices.
In my advisor’s practice, we are therefore looking for limited exposure in value, some growth and dividend ETFs. Of course, gold has been a core holding for a long time.
With all investments, I recommend the use of a trailing sell stop in the range of 8-12% to limit your downside risk.
3. Trend Tracking Indexes (TTIs)
Our TTIs slipped a tad, as this week turned out to be a non-event in terms of market direction.
This is how we closed 04/21/2023:
Domestic TTI: +2.02% above its M/A (prior close +2.11%)—Buy signal effective 12/1/2022.
International TTI: +7.64% above its M/A (prior close +8.06%)—Buy signal effective 12/1/2022.
All linked charts above are courtesy of Bloomberg via ZeroHedge.
———————————————————-
WOULD YOU LIKE TO HAVE YOUR INVESTMENTS PROFESSIONALLY MANAGED?
Do you have the time to follow our investment plans yourself? If you are a busy professional who would like to have his portfolio managed using our methodology, please contact me directly to get more details.
Contact Ulli