Bond Yields Spoil The Market Party

Ulli Uncategorized Contact

[Chart courtesy of MarketWatch.com]

  1. Moving the markets

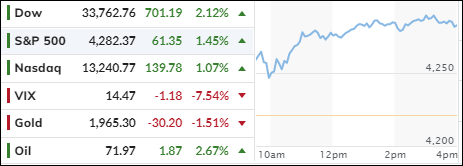
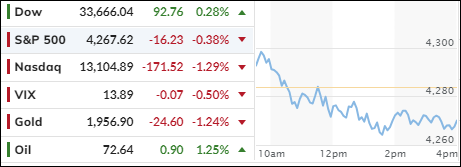
The S&P 500 is still hovering near its highest level since August, but it slipped a bit today. Maybe the market realized that its artificial intelligence stocks can’t keep the party going forever.

After all, we have seen 13 months of declining leading indicators, and the Fed’s hawkish policy will likely bite us in the future. Liquidity issues will become a big problem, especially when the government needs to borrow an estimated $1 trillion to fill its empty coffers. Who will buy all that new debt? The Fed may have to step in and print more money.

Some assets went up, some went down, leaving many investors confused and frustrated. Billionaire hedge fund manager Stan Druckenmiller summed it up well:  

This is the most complicated non-roadmap, unanalyzable situation I’ve ever seen in terms of having a lot of confidence in an economic prediction going forward… I just don’t see a fat pitch right now.

And then he added:

Our central case is there’s more shoes to drop, particularly in addition to the asset markets economically.

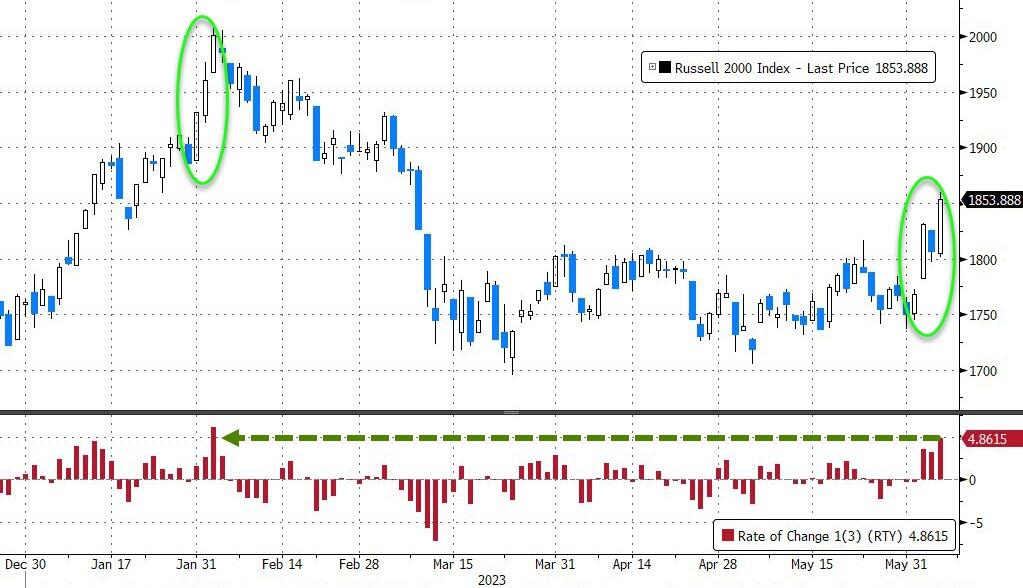
Ouch. That sounds bad. And it shows. The Nasdaq had its worst day since mid-April, while the Russell 2000 (small caps) outperformed it by the most since March 2021.

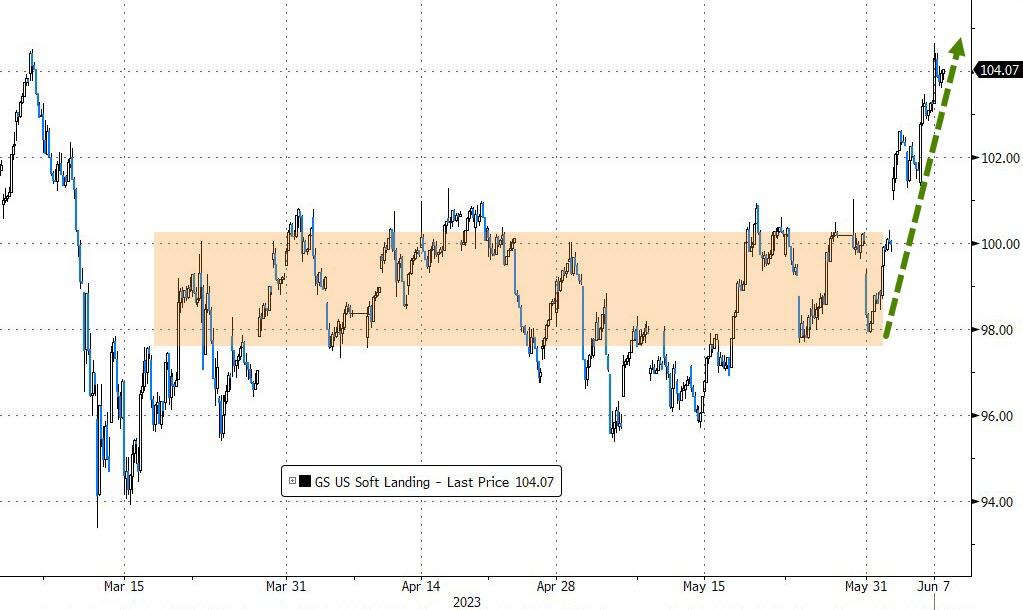
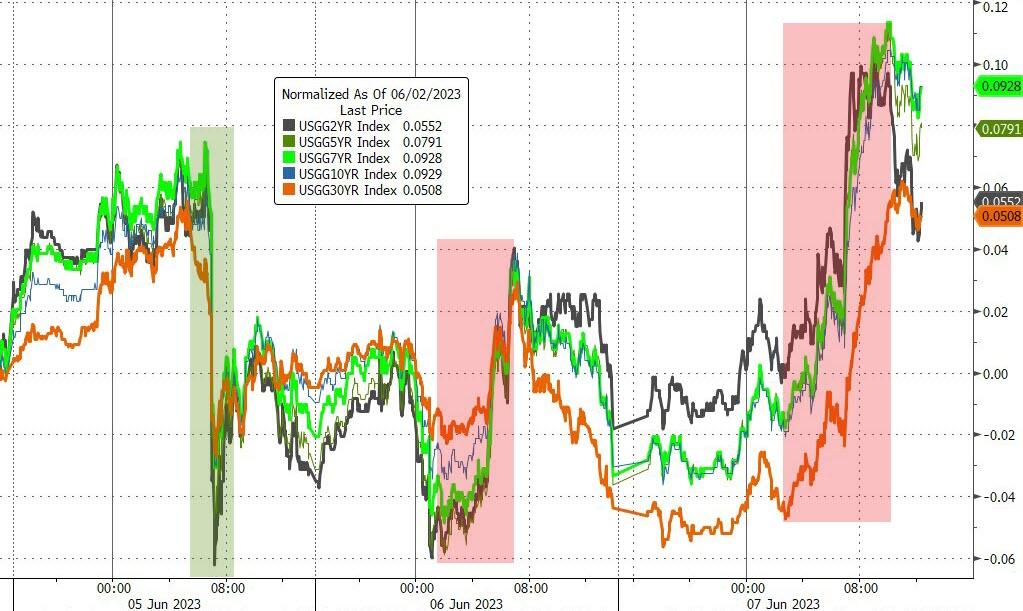
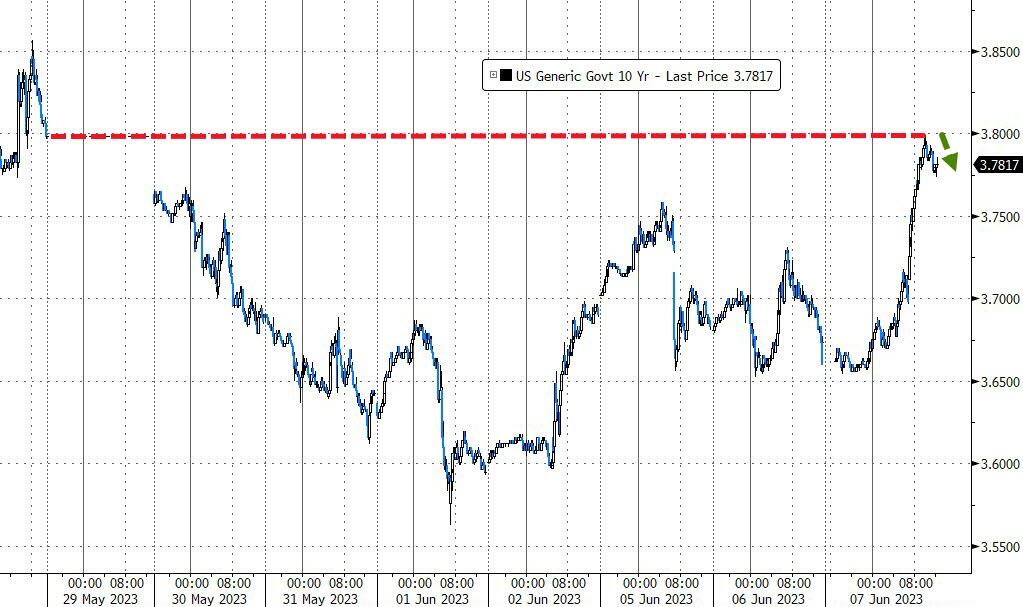
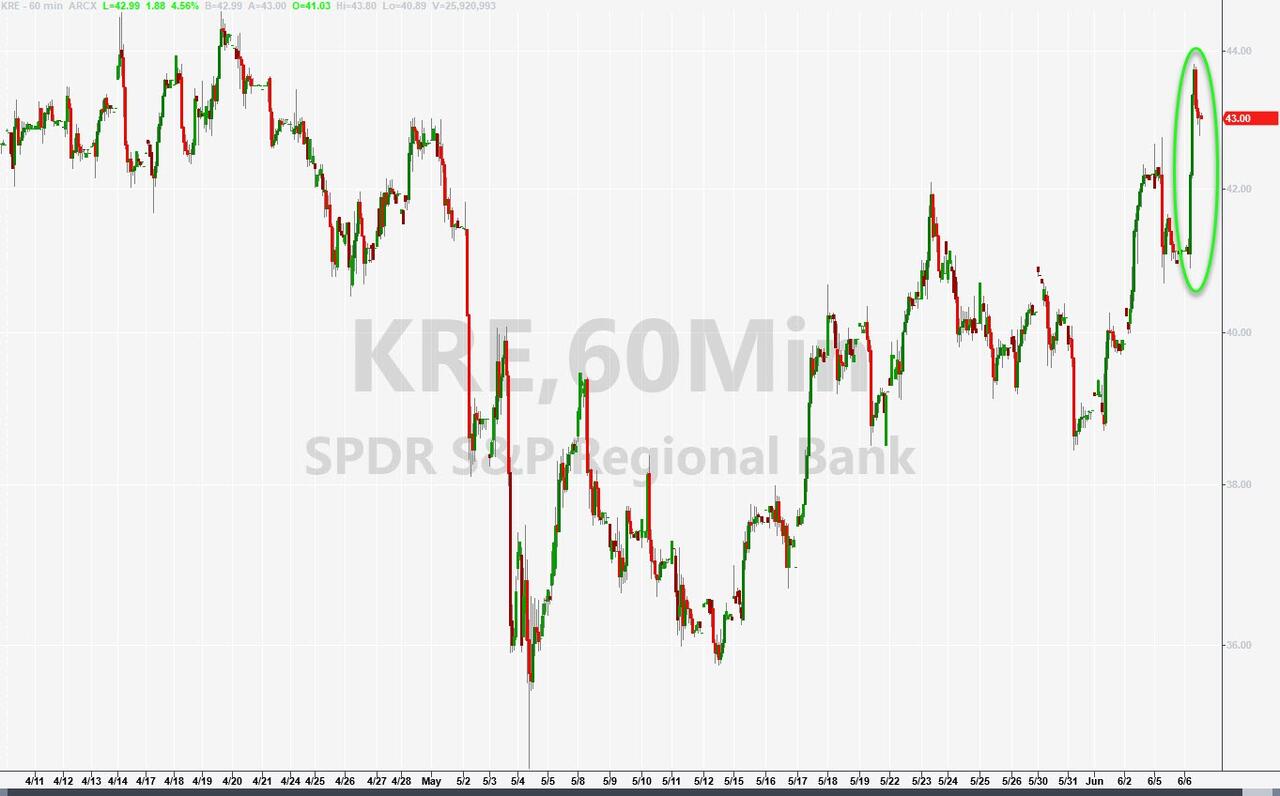
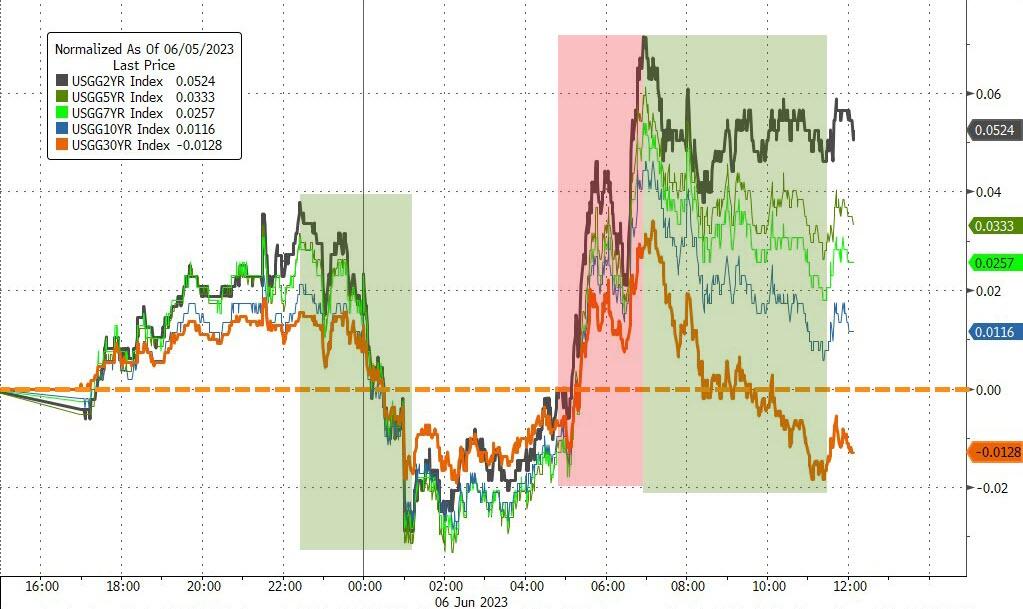
Regional banks kept rising, while Goldman Sachs tried to convince us that everything would be fine, and we would have a “soft landing”. Bond yields soared higher with the 10-year jumping 12 basis points but stopping at the 3.8% resistance level.

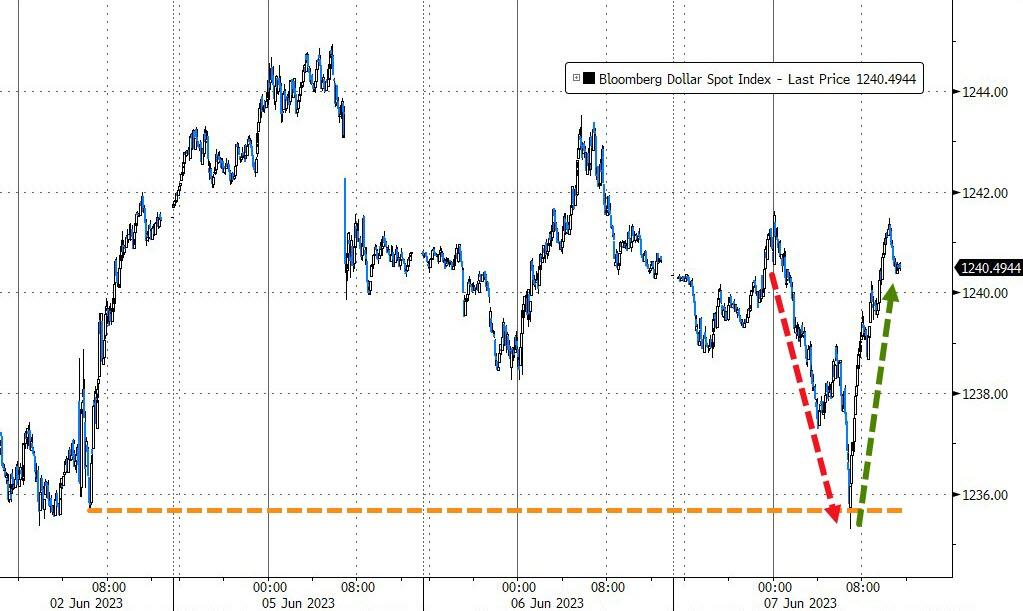
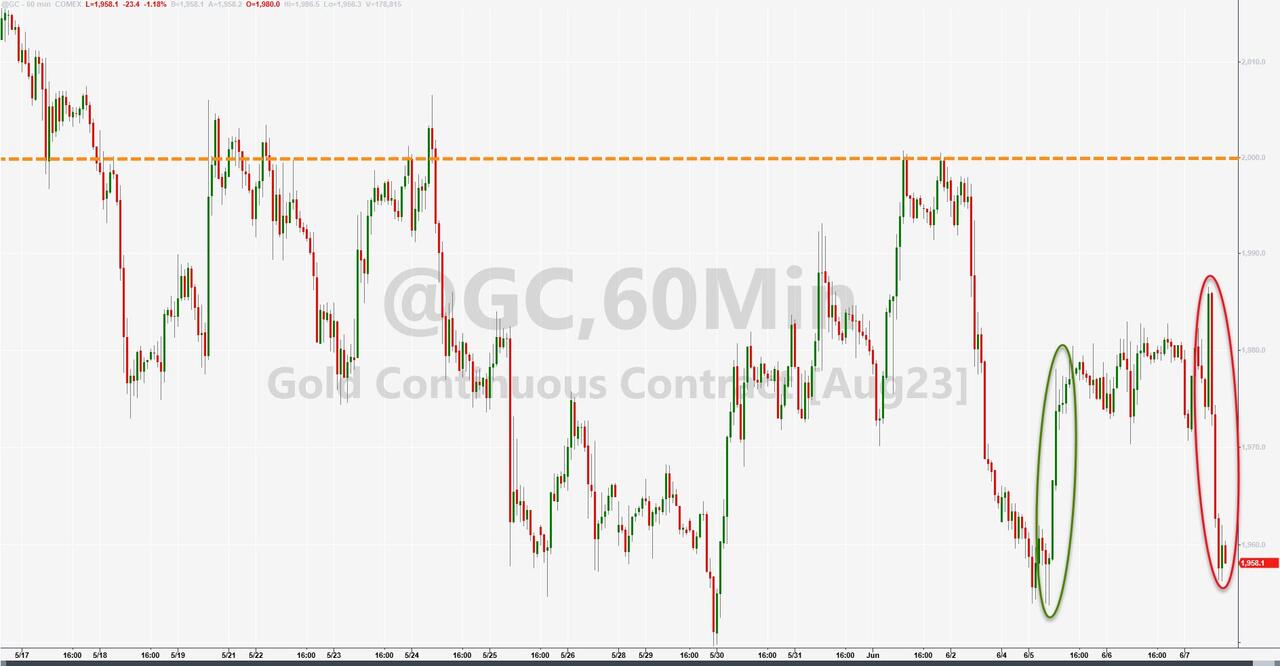
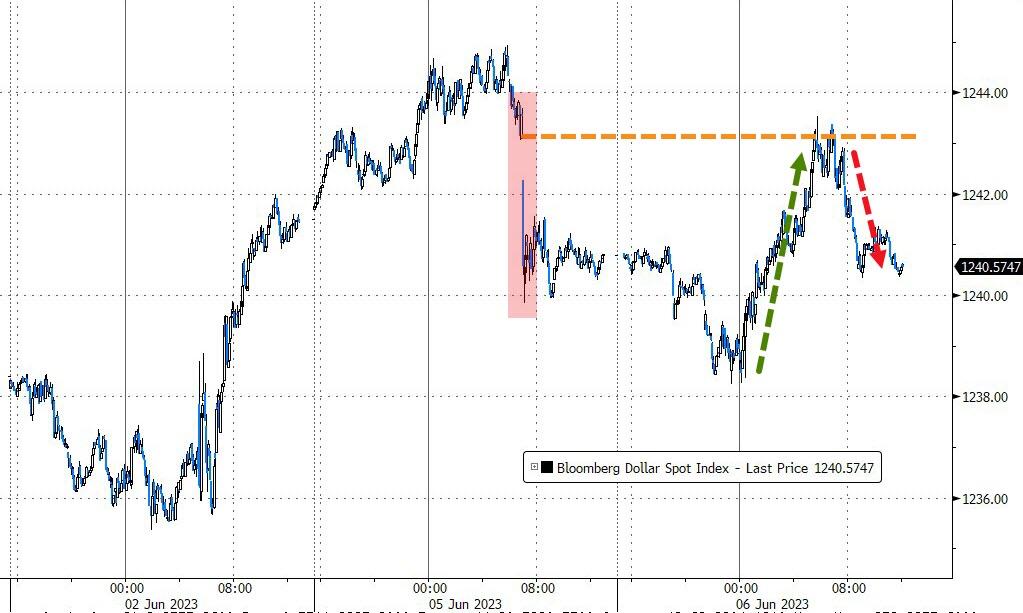
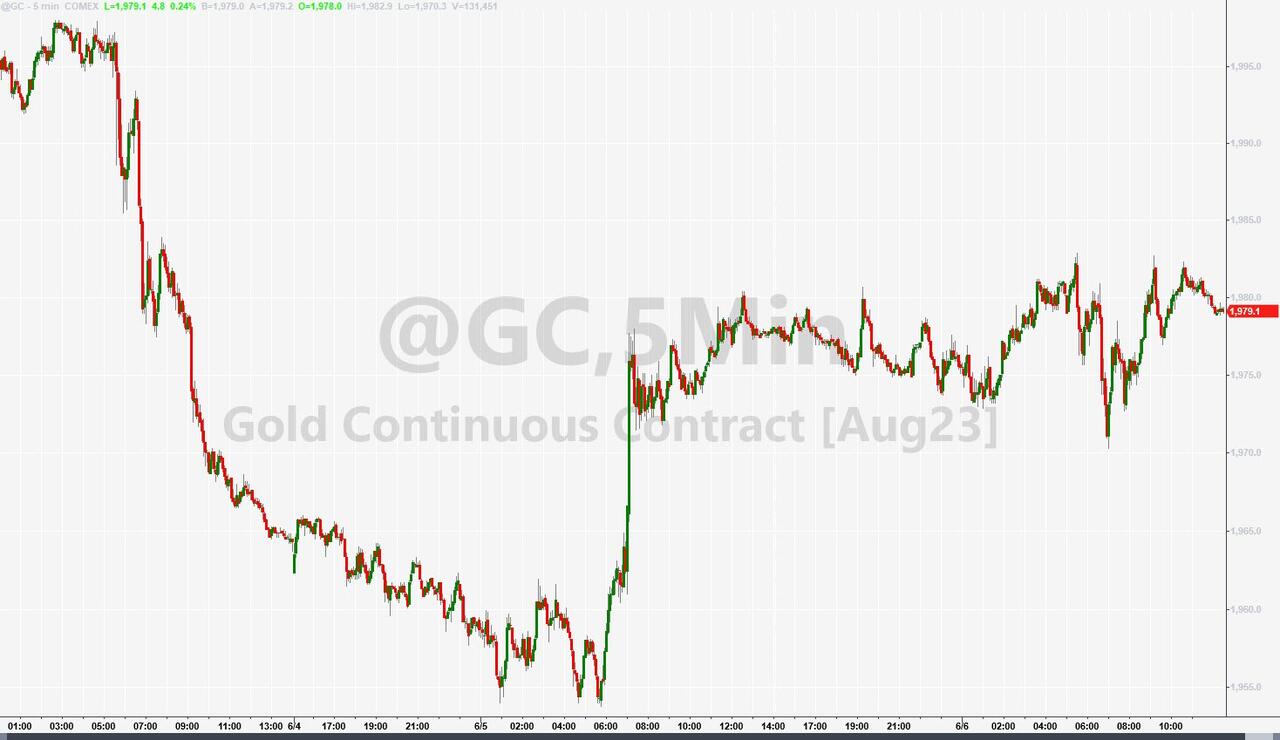
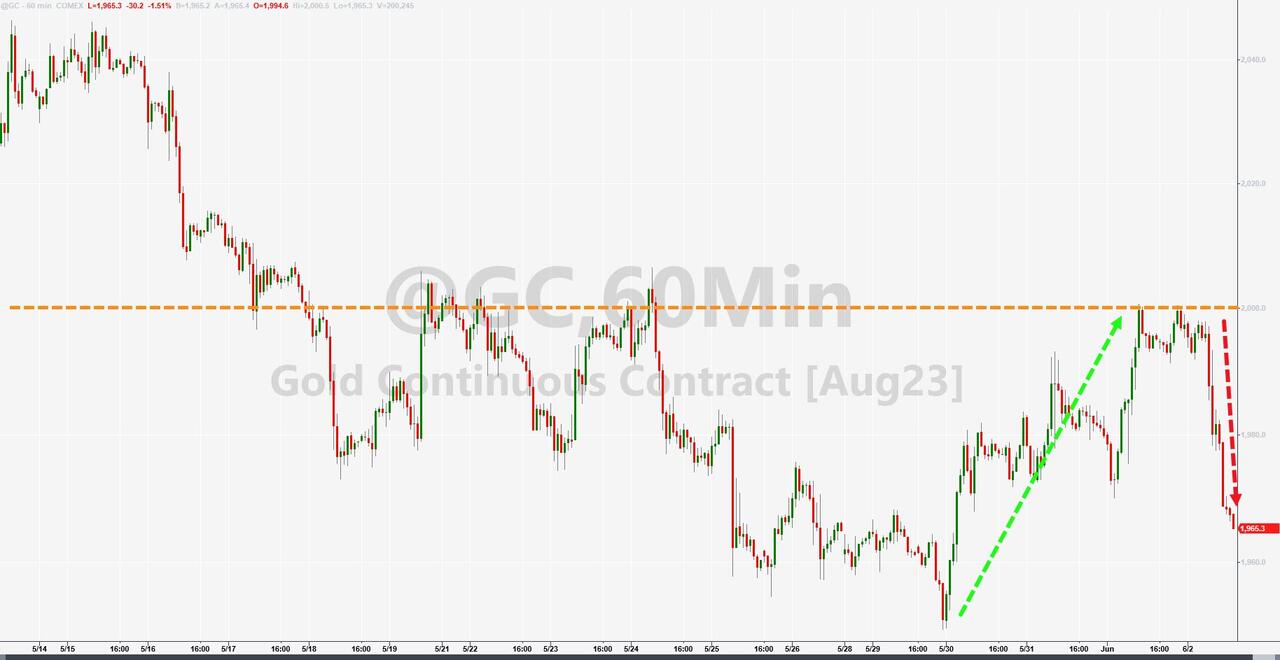
The US Dollar had a wild ride but ended flat. Gold was not so lucky and gave back Monday’s gains as bond yields hurt its appeal. So, what should we do in this bubble? Druckenmiller has some advice:

There are definitely lessons to be learned [from the Dot Com bubble]. Don’t get emotional, don’t get crazy.

Sounds reasonable. But will we listen? Or will we repeat history?

Read More
Beware Of Narrow Breadth: Why This Rally Might Fail

Ulli Market Commentary Contact

[Chart courtesy of MarketWatch.com]

  1. Moving the markets

The S&P 500 is close to its highest level in nine months, but don’t get too excited. This rally is driven by a few big stocks, while most of the market is lagging. That’s a sign of weakness, not strength, according to analyst Lance Roberts. He explains:

Breadth is important. A rally on narrow breadth indicates limited participation, and the chances of failure are above average. The market cannot continue to rally with just a few large-caps (generals) leading the way. Small and mid-caps (troops) must also be on board to give the rally credibility. A rally that “lifts all boats” indicates far-reaching strength and increases the chances of further gains.

So far, investors have ignored the bad news about the economy and kept buying stocks. But that could change soon, especially if the Fed decides to raise interest rates again on June 14th. Until then, we might see some sideways action and low volatility in the market.

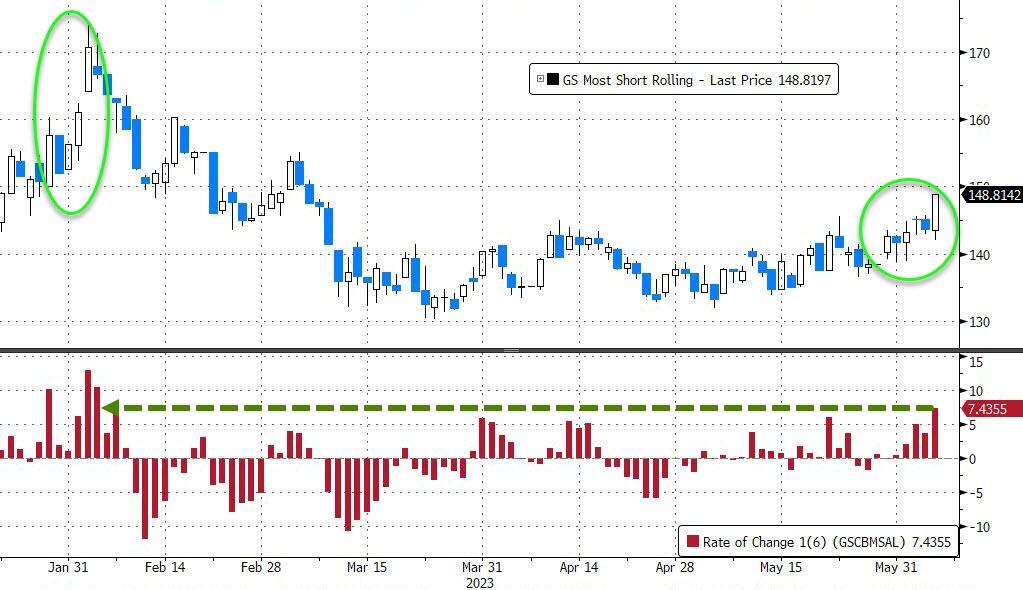
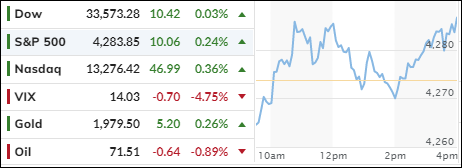
Yesterday, the major indexes barely closed in the green, despite some negative headlines for Coinbase and Apple. The only exception was the small-cap index, which soared for the third day in a row, gaining 5% in total. That sounds impressive, but it might be a false signal. The last time this happened was in early February, right before a big drop. Regional banks also did well, thanks to a 6-day short squeeze.

Bond yields rose early in the session but fell back later. The US dollar had a wild ride but ended up flat. Gold added to its gains from yesterday.

The world is betting against the S&P 500 right now, which makes me wonder if this rally has any legs left. To me, it looks like the market is out of sync and the S&P is on thin ice. It’s sensible to have a sell stop discipline in place.  

Read More
Apple’s “Appulus” Fails To Impress As Market Turns Sour

Ulli Market Commentary Contact

[Chart courtesy of MarketWatch.com]

  1. Moving the markets

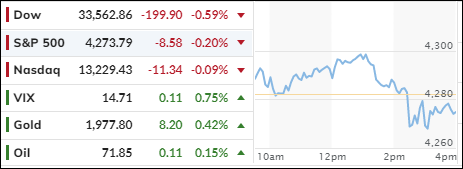
The market rally fizzled out on Monday as the major indexes gave up their early gains and closed nearly flat or lower. The Dow was the biggest loser, while the S&P 500 and Nasdaq barely stayed above water. According to Bespoke Investment Group, the S&P 500 is now more overbought than any time since July 2021. Yikes!

It was a slow day for traders, who had little to cheer about after last week’s debt ceiling drama and the bizarre jobs report that raised more questions than answers. Some analysts wondered if the rally was too narrow and too fragile, relying on a few stocks to prop up the market.

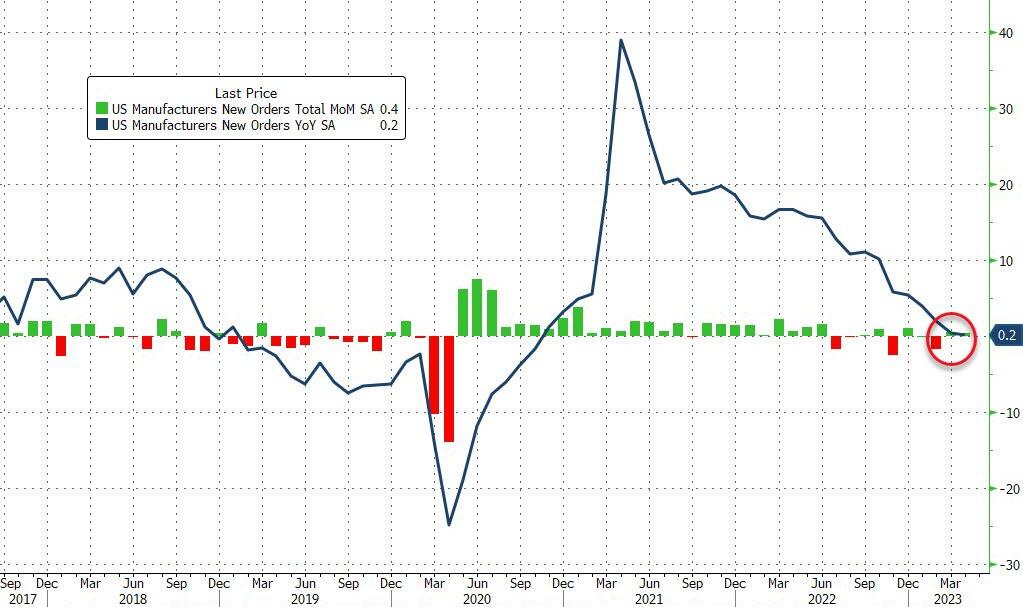
The economic news was not encouraging either. US factory orders grew by a measly 0.4% in April, half of what was expected, and the previous month’s figure was revised down. The services sector also disappointed, showing signs of slowing down. How can anyone still claim that the economy is doing fine and there is no risk of a recession?

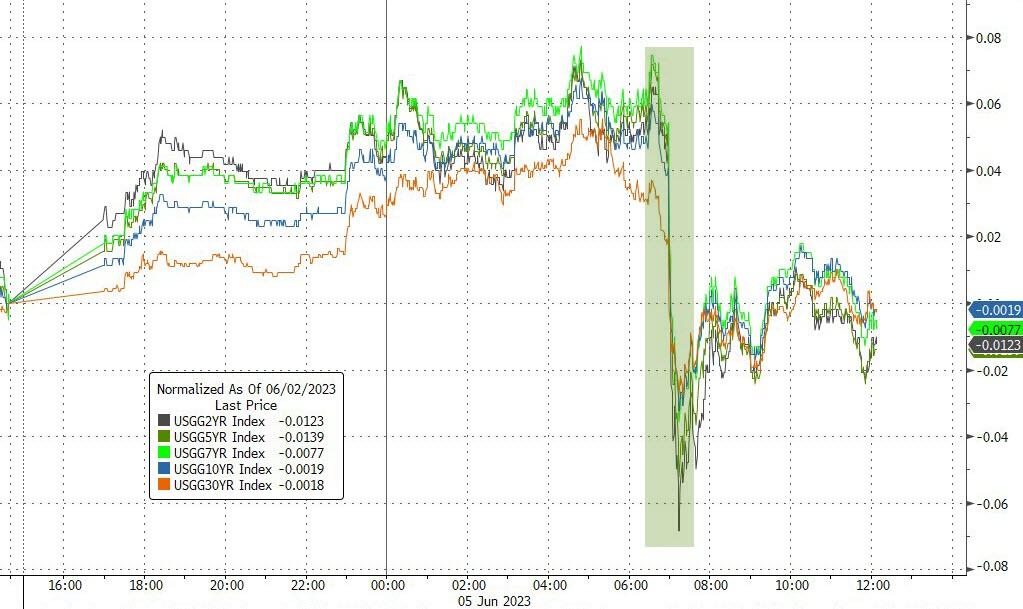
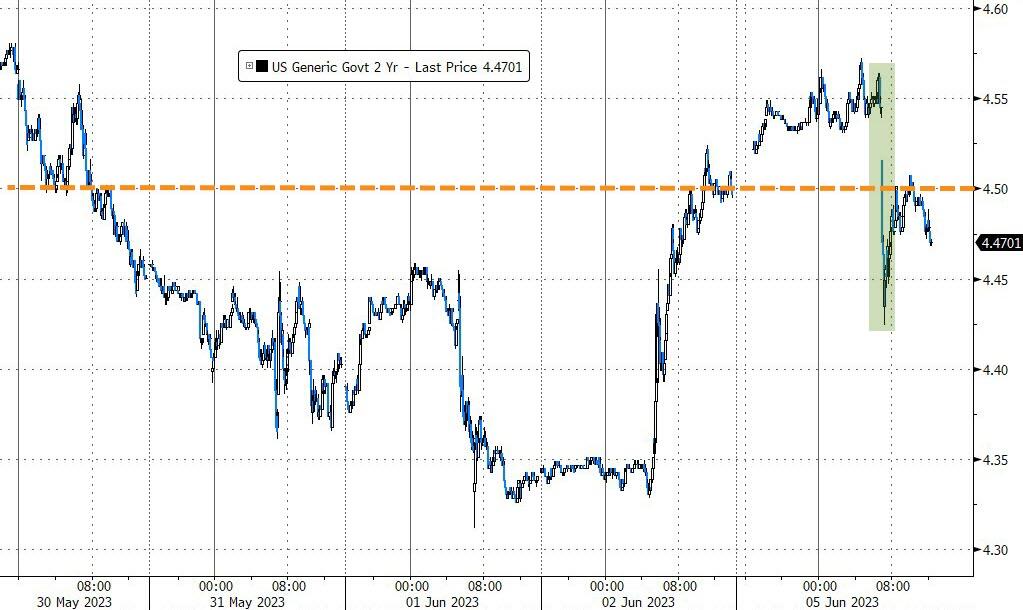
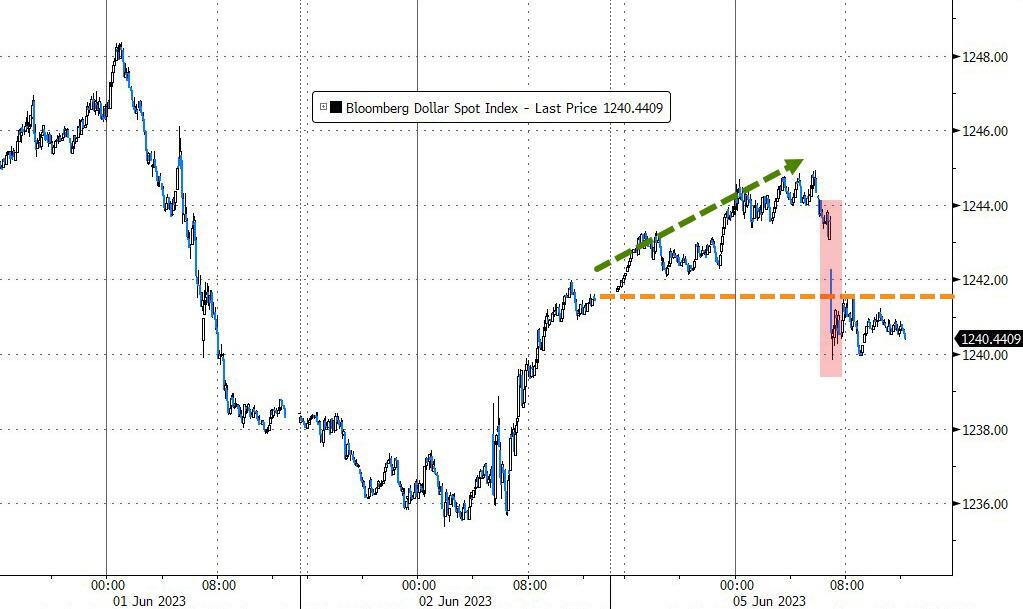
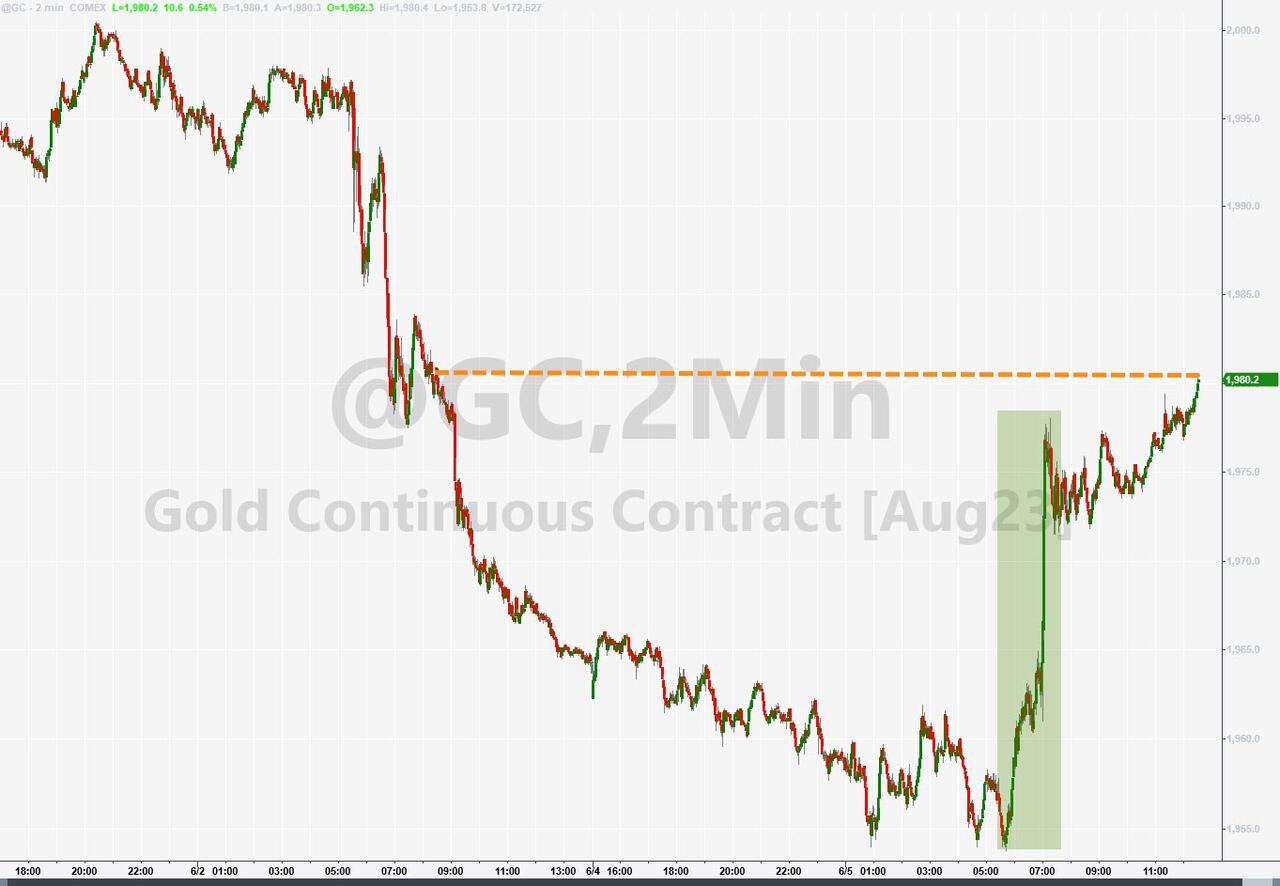
The bond market seemed to agree, as yields dropped sharply, and the 2-year note fell below 4.5% again. The dollar was flat, but gold shone brighter and moved closer to $2k.

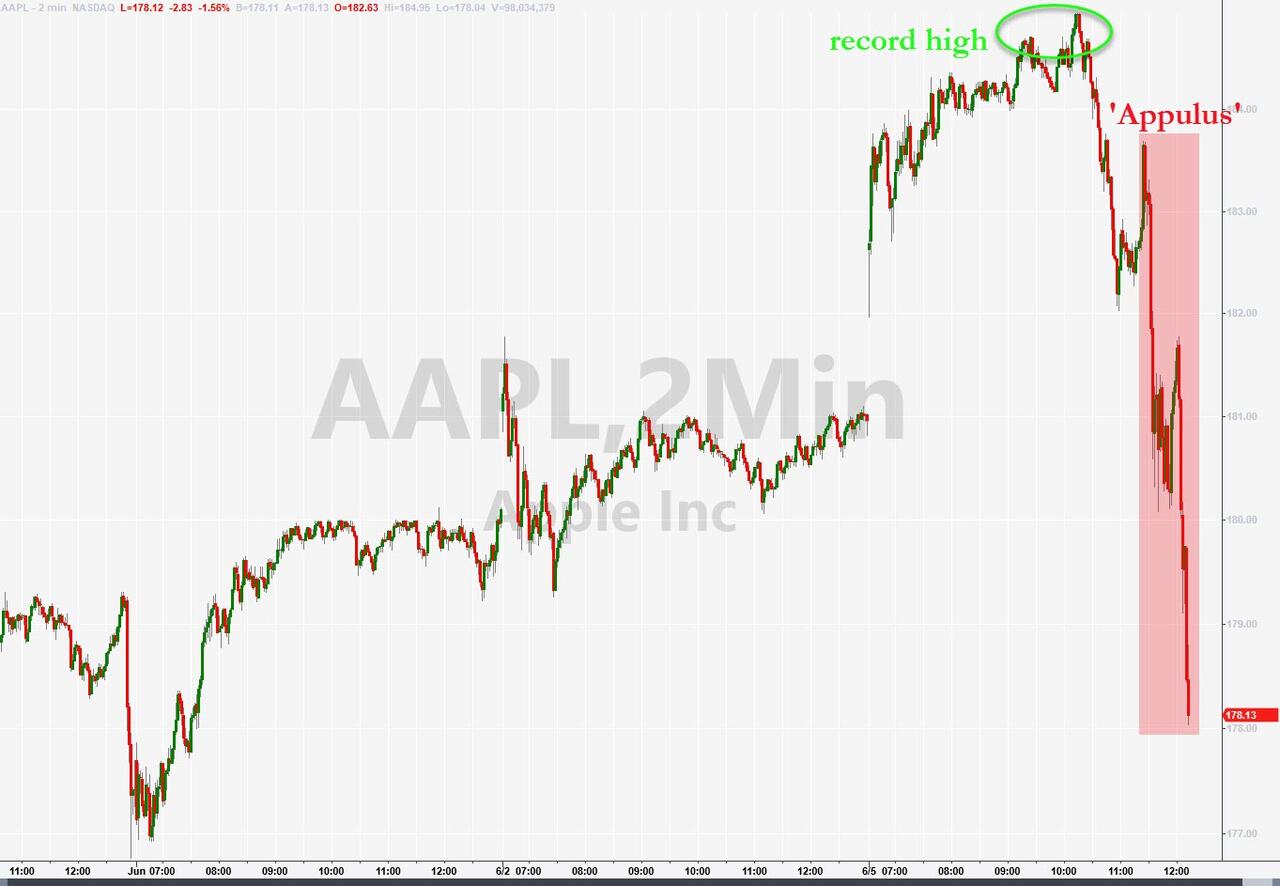
Apple briefly hit a new record high after announcing its futuristic VR/AR headset “Appulus”, which costs an arm and a leg and won’t be available until 2024. But investors quickly realized that they were buying a dream and sold off the stock, dragging the rest of the market with it.

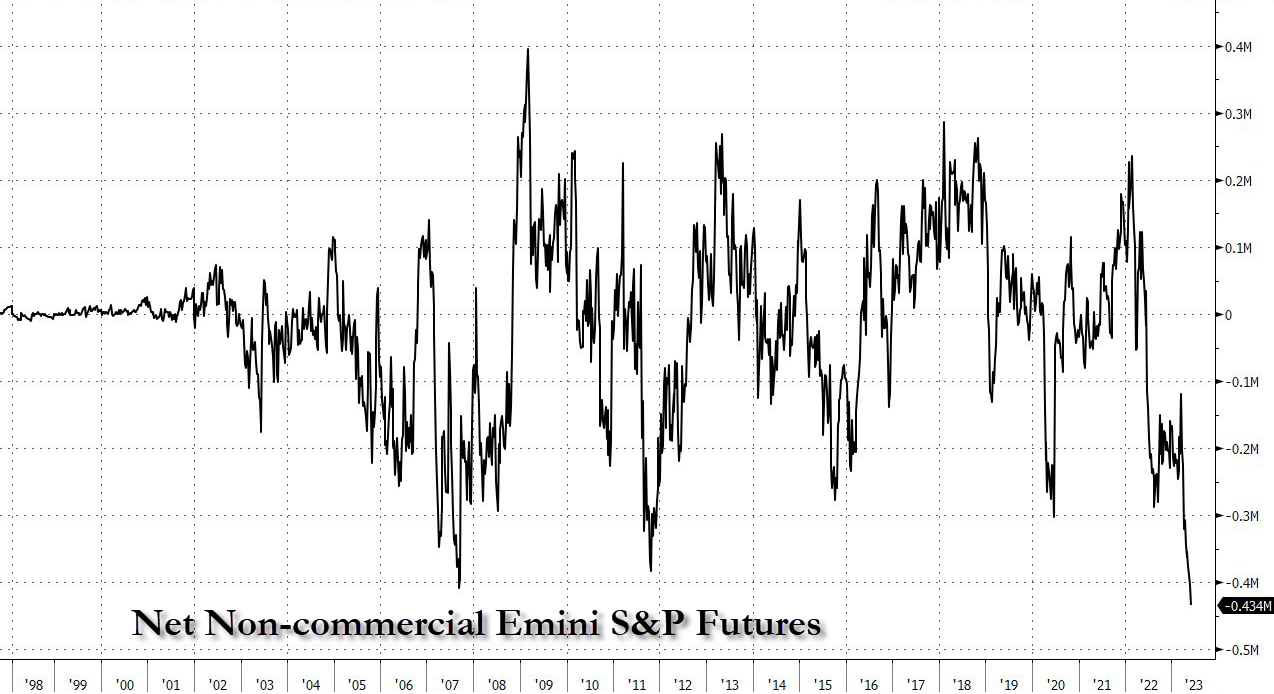
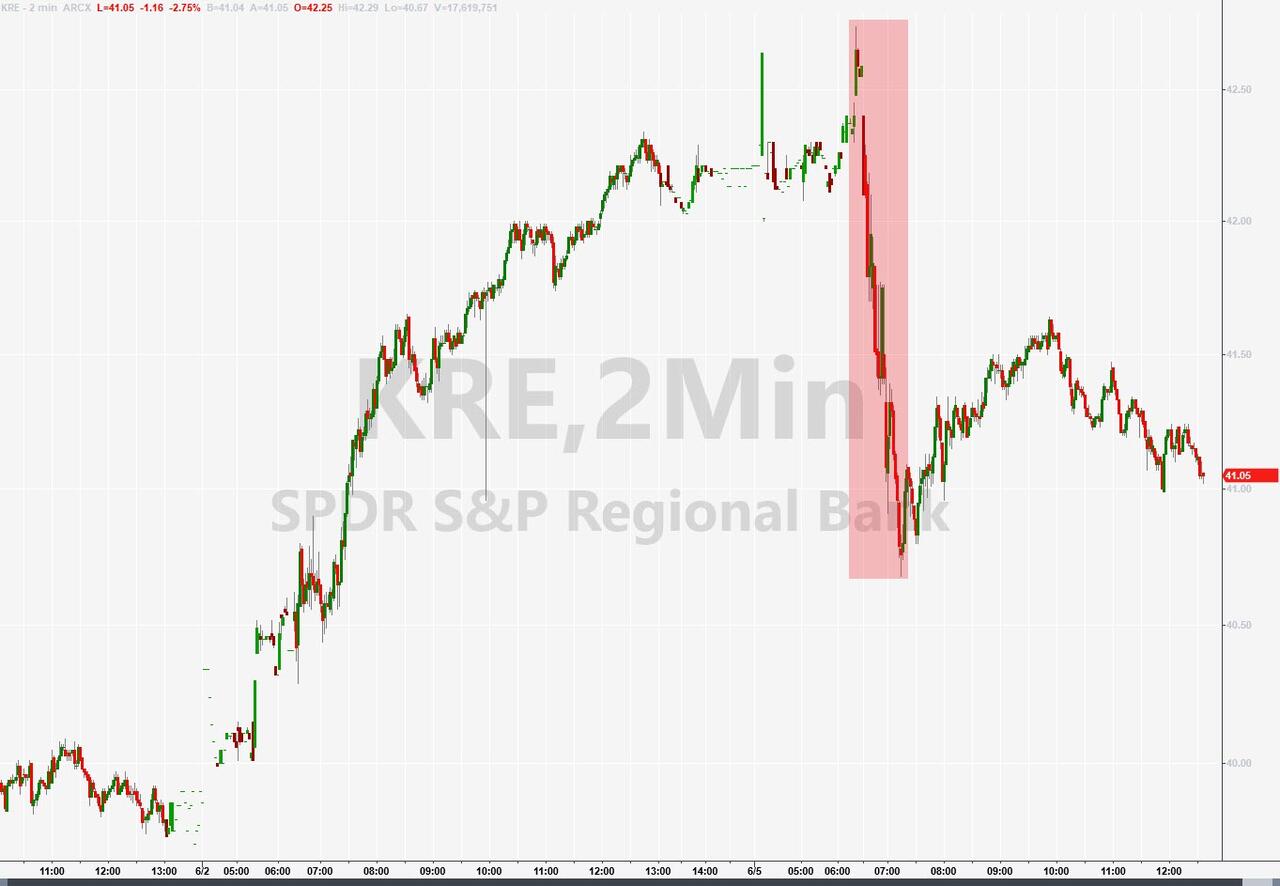
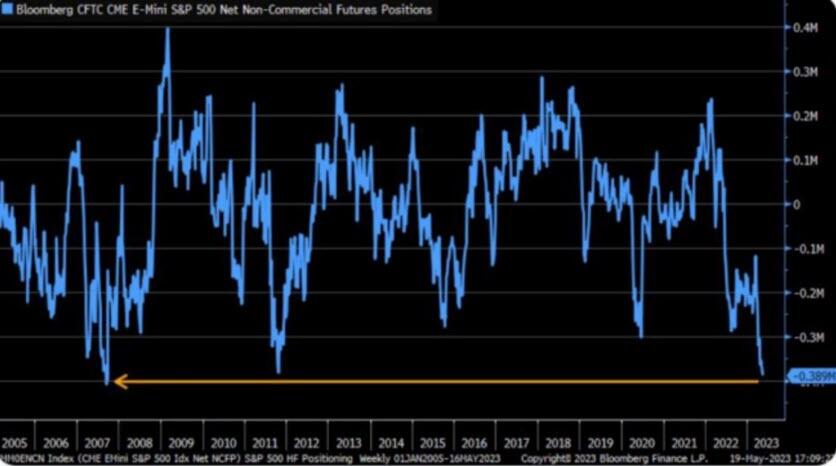
Bank stocks also suffered, especially the regional ones, as the index KRE took a dive. The big picture looked grim, as analyst Mathew Piepenburg pointed out that the S&P 500 futures market is now more bearish than ever since 2011 and almost as bad as late 2007.

We all know what happened next in 2008.

Read More
ETFs On The Cutline – Updated Through 06/02/2023

Ulli ETFs on the Cutline Contact

Do you want to know which ETFs are hot and which ones are not? Then you need my High-Volume ETF Cutline report. It tells you how close or far each of the 312 ETFs I follow is from its long-term trend line (39-week SMA). These are the ETFs that trade more than $5 million a day, so they are not some obscure funds that nobody cares about.

The report is split into two parts: The winners that are above their trend line (%M/A), and the losers that are below it. The yellow line is the line of shame that separates them. You can see how many ETFs are in each group and how they have changed since the last report.

Take a peek:

The HV ETF Master Cutline Report

If you are confused by some of the terms we use, don’t panic. I have a helpful Glossary of Terms for you.

If you want to learn more about the Cutline method and how it can make you rich (or at least less poor), read my original post here.

ETF Tracker Newsletter For June 2, 2023

Ulli ETF Tracker Contact

ETF Tracker StatSheet          

You can view the latest version here.

Bulls Run Wild After Senate Unleashes Money Printing: How Long Can It Last?

[Chart courtesy of MarketWatch.com]

  1. Moving the markets

The market soared today after the Senate cleared the way for more money printing by suspending the debt ceiling until 2025. This means the Fed and the politicians can create trillions of new dollars out of thin air, which will eventually lead to runaway inflation. Ouch!

Some of this new money will flow into the stock market, boosting the bullish mood. But there is a catch: the US Treasury is broke and needs to borrow at least $1 trillion in the next few months, sucking out liquidity from the market. That is a big bearish risk.

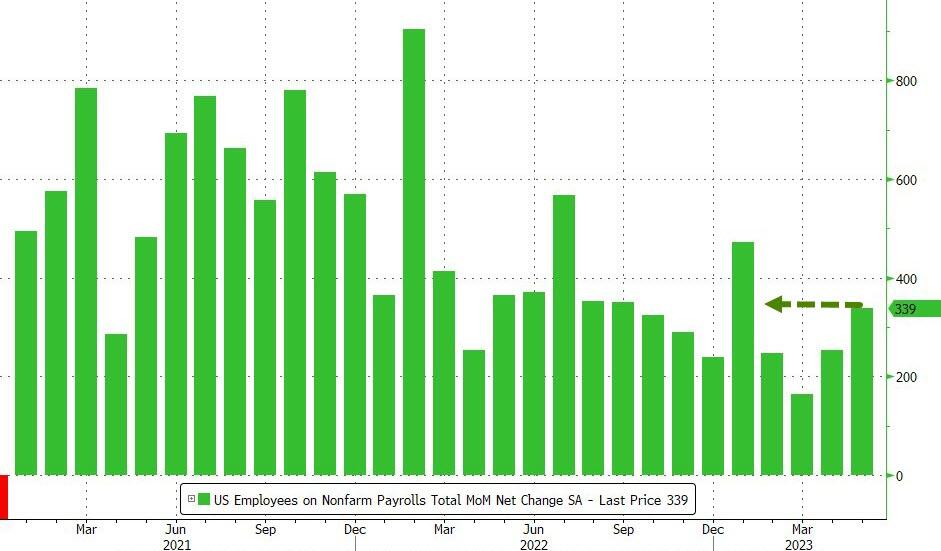
The bulls also cheered the strong May jobs report, which showed a huge jump in payrolls and a slight increase in unemployment. Usually, this would be bad news for the market, as it would signal a tighter Fed policy. But today, the market shrugged off that possibility and focused on the positive side of a robust labor market.

But how reliable are these numbers? Economist Nick Bunker questioned the quality of the payroll data:

The unemployment rate rose for all the wrong reasons. More employed people moving into unemployment and fewer unemployed workers finding jobs.”

ZeroHedge pointed out a possible source of distortion:

The birth death model “added” 231K jobs in March. These are not actual jobs, but merely an assumption by the BLS as to how many new businesses were created and hired workers based on statistical assumptions. Again, these are not actual jobs.

Today’s rally was broad based, with our Domestic Trend Tracking Index (TTI-section 3), finally outperforming the S&P 500. That had not been the case for most of 2023, as only a small segment of the market drove the gains.

These drivers were, and still are, Artificial Intelligence (AI) and General Productivity Tools (GPT).

Without them, the rest of the market would be in negative territory for the year. It is debatable whether this is a bubble, or a genuine technological breakthrough based on fundamentals.

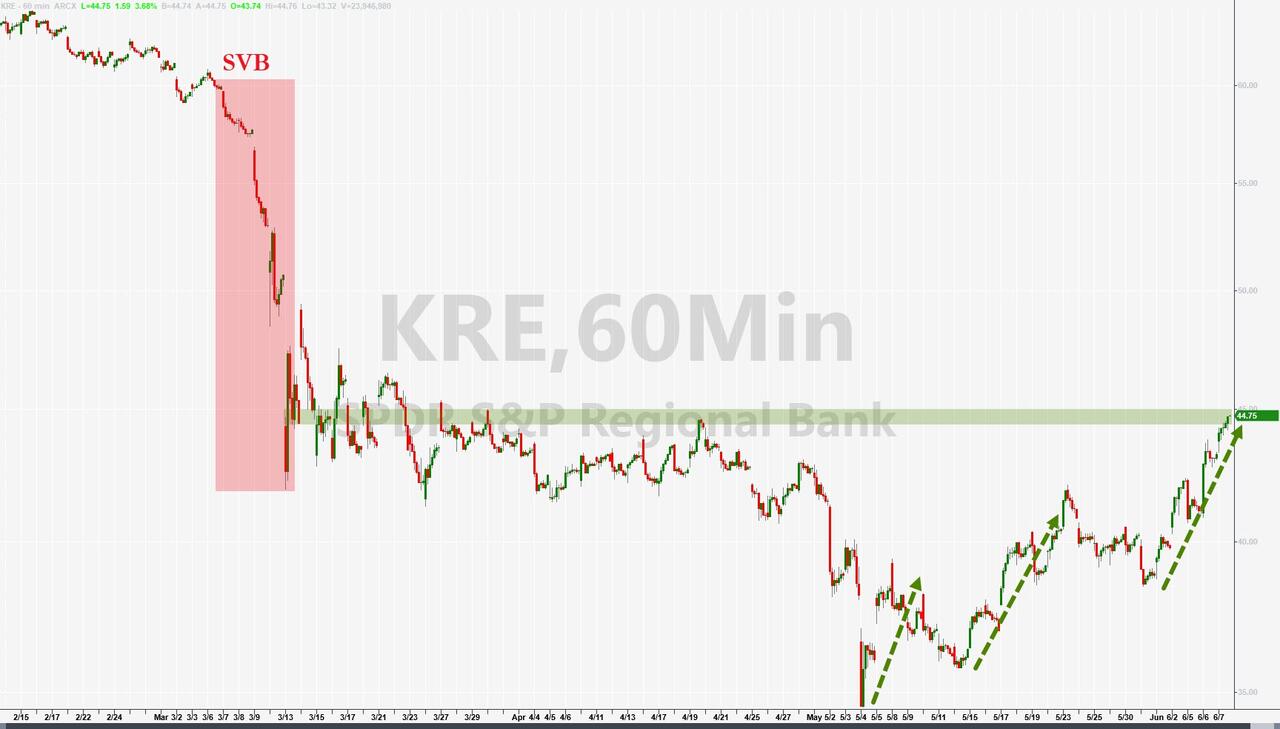
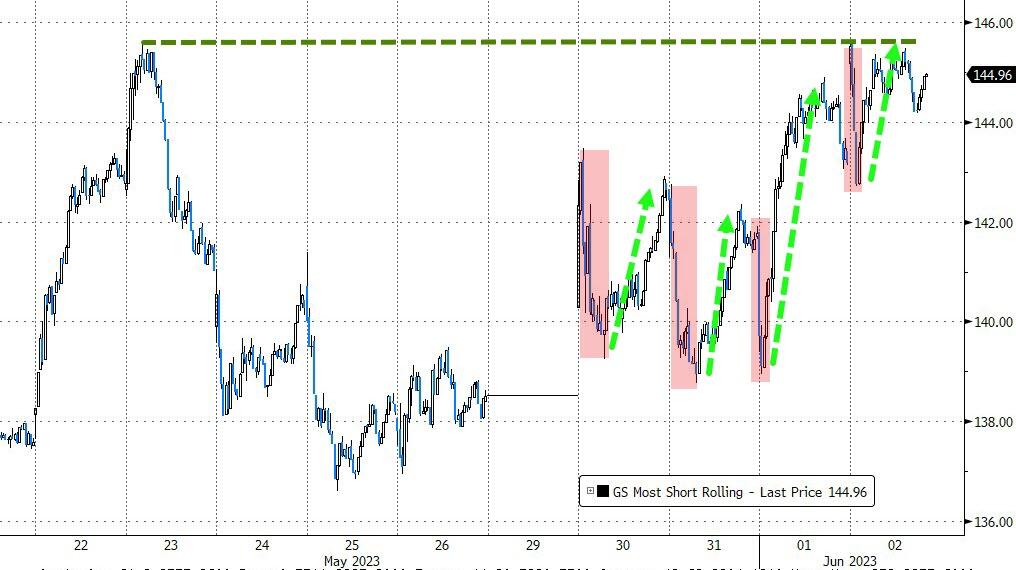
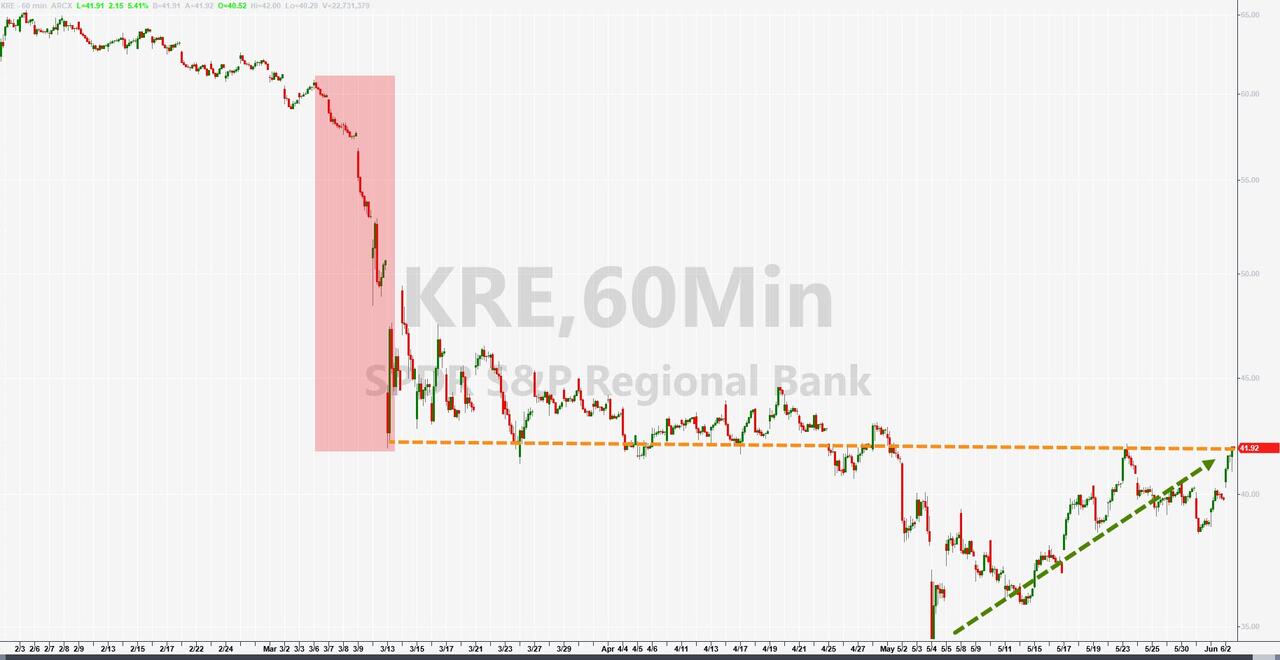
Of course, no rally is complete without a short squeeze. That happened today when yesterday’s squeeze continued in two stages. Regional bank stocks, as represented by KRE, rose for the third week in a row, despite losing deposits.

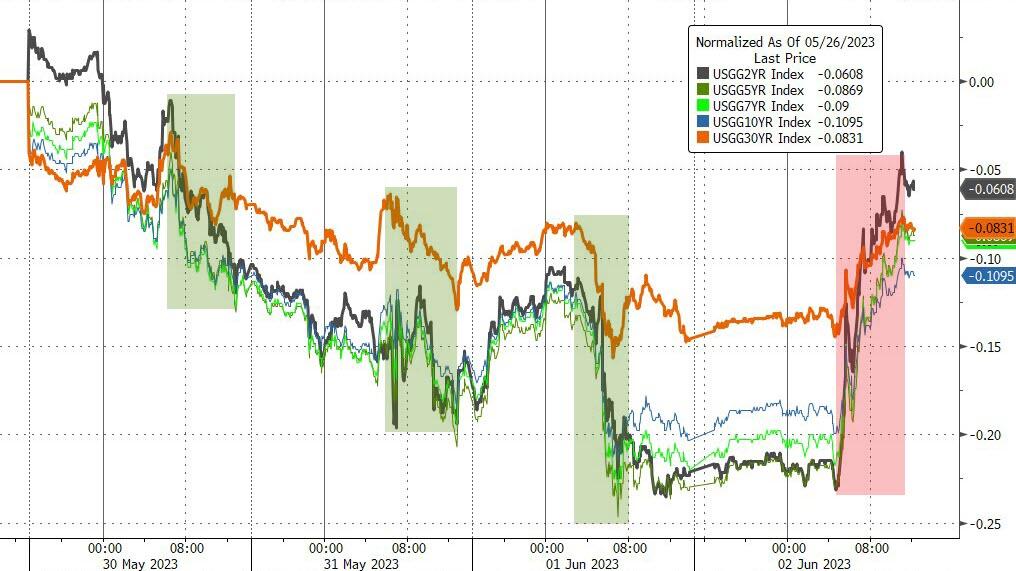
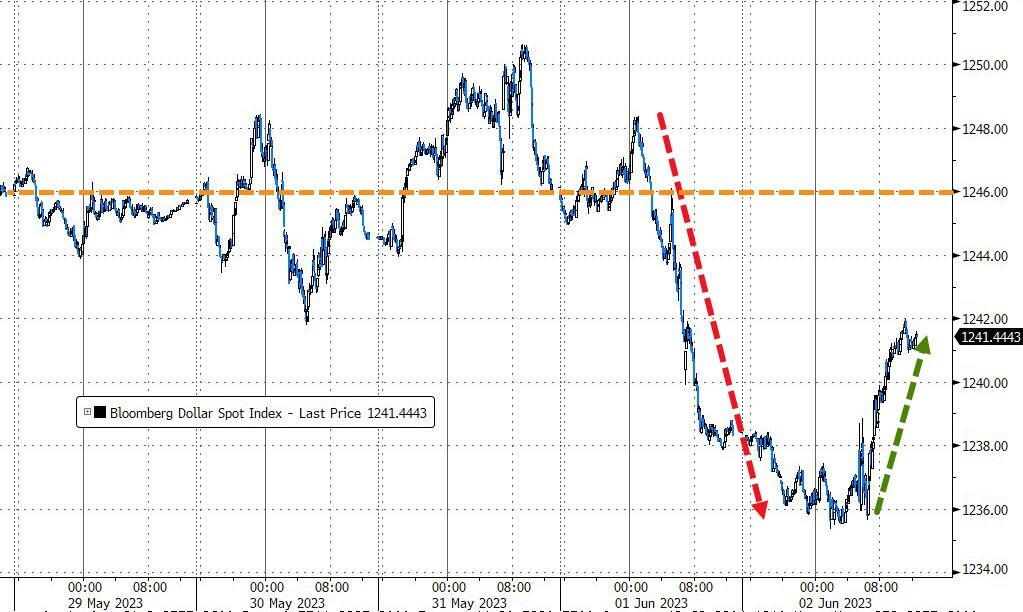
Bond yields climbed, the US dollar fell this week, despite a bounce today, and gold retreated after touching $2k mid-week.

On Wall Street, none of these worries mattered as optimism prevailed. Some traders called this a “Goldilocks” scenario, where inflation is cooling down and the Fed is easing up, creating a soft landing for the economy.

I wouldn’t bet on it.

Read More

Weekly StatSheet For The ETF Tracker Newsletter – Updated Through 06/01/2023

Ulli ETF StatSheet Contact

ETF Data updated through Thursday, June 1, 2023

How to use this StatSheet:

  1. Out of the 1,800+ ETFs out there, I only pick the ones that trade over $5 million per day (HV ETFs), so you don’t get stuck with a lemon that nobody wants to buy or sell.
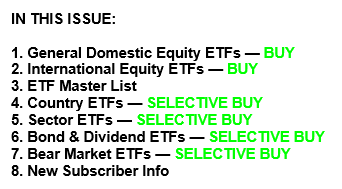
  1. Trend Tracking Indexes (TTIs)

These are the main indicators that tell you when to buy or sell Domestic and International ETFs (section 1 and 2). They do that by comparing their position to their long-term M/A (Moving Average). If they cross above, and stay there, it’s a green light to buy. If they fall below, and keep going, it’s a red light to sell. And to make sure you don’t lose your shirt if things go south, I also use a 12% trailing stop loss on all positions in these categories.

  1. All other investment areas don’t have a TTI and should be traded based on the position of each ETF relative to its own trend line (%M/A). That’s why I call them “Selective Buy.” In other words, if an ETF goes above its own trend line, you can buy it. But don’t forget to use a trailing sell stop of 12%, or less if you’re feeling nervous.

If some of these words sound like Greek to you, please check out the Glossary of Terms and new subscriber information in section 8.

  1. DOMESTIC EQUITY ETFs: BUY— since 12/01/2022

Click on chart to enlarge

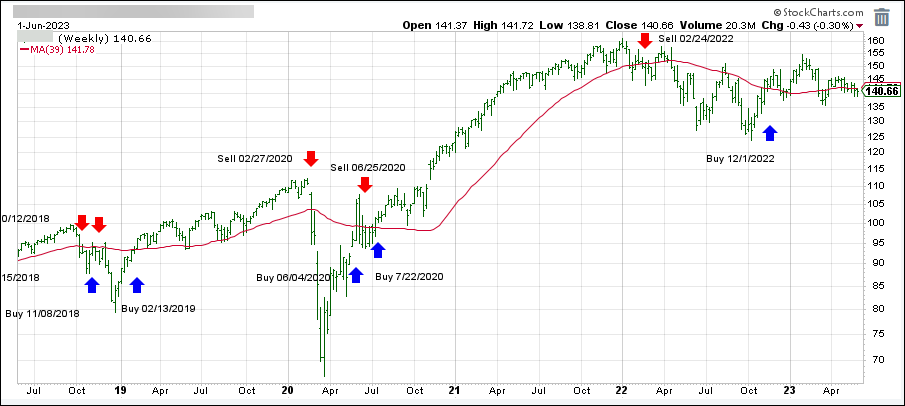
This is our main compass, the Domestic Trend Tracking Index (TTI-green line in the above chart). It just dipped below its long-term trend line (red) by -0.74%, but it’s still in “Buy” mode for now.

Read More