
[Chart courtesy of MarketWatch.com]
- Moving the markets
The S&P 500 is close to its highest level in nine months, but don’t get too excited. This rally is driven by a few big stocks, while most of the market is lagging. That’s a sign of weakness, not strength, according to analyst Lance Roberts. He explains:
Breadth is important. A rally on narrow breadth indicates limited participation, and the chances of failure are above average. The market cannot continue to rally with just a few large-caps (generals) leading the way. Small and mid-caps (troops) must also be on board to give the rally credibility. A rally that “lifts all boats” indicates far-reaching strength and increases the chances of further gains.
So far, investors have ignored the bad news about the economy and kept buying stocks. But that could change soon, especially if the Fed decides to raise interest rates again on June 14th. Until then, we might see some sideways action and low volatility in the market.
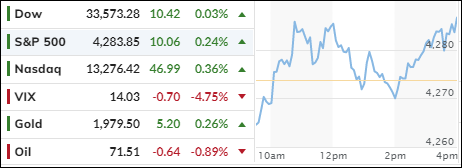
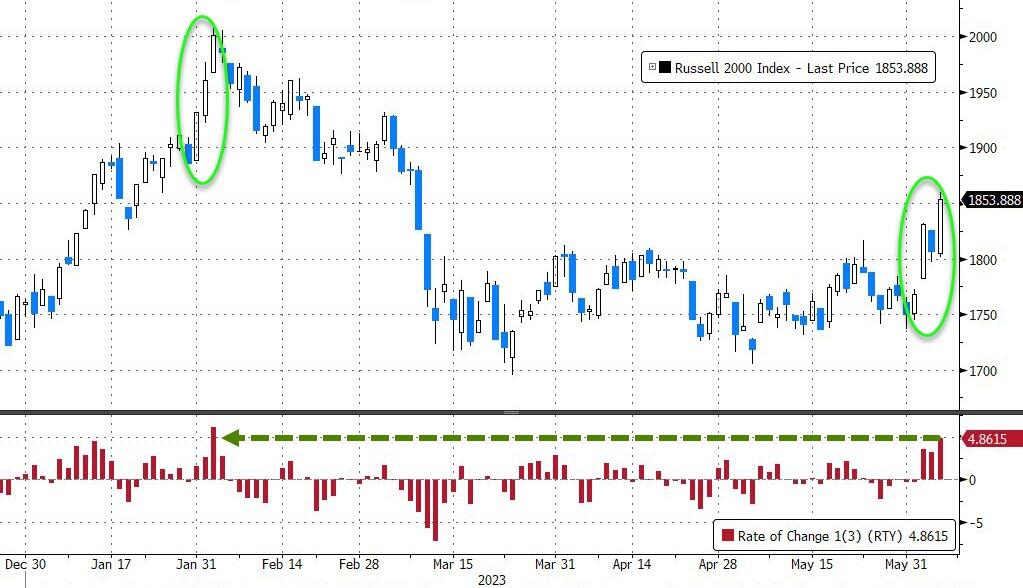
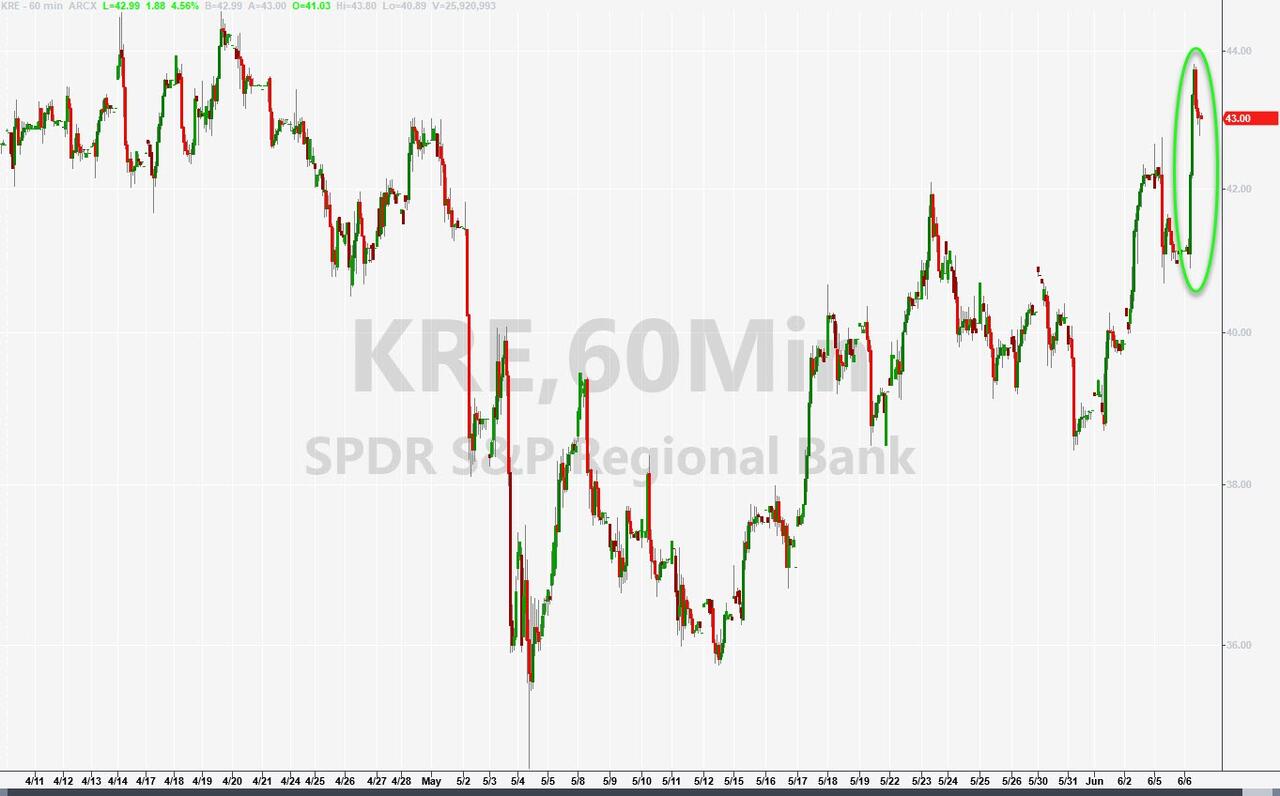
Yesterday, the major indexes barely closed in the green, despite some negative headlines for Coinbase and Apple. The only exception was the small-cap index, which soared for the third day in a row, gaining 5% in total. That sounds impressive, but it might be a false signal. The last time this happened was in early February, right before a big drop. Regional banks also did well, thanks to a 6-day short squeeze.
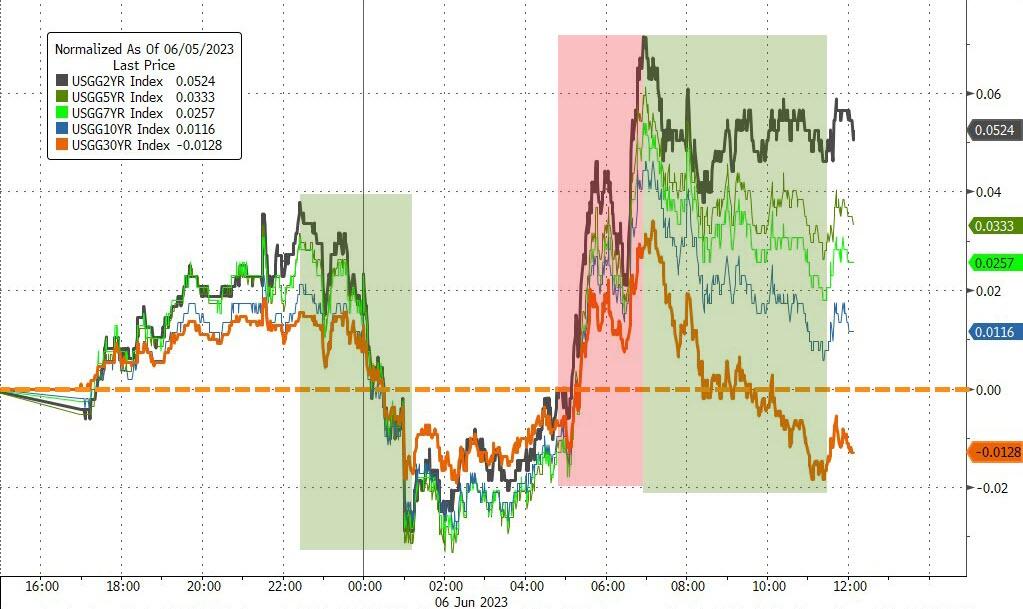
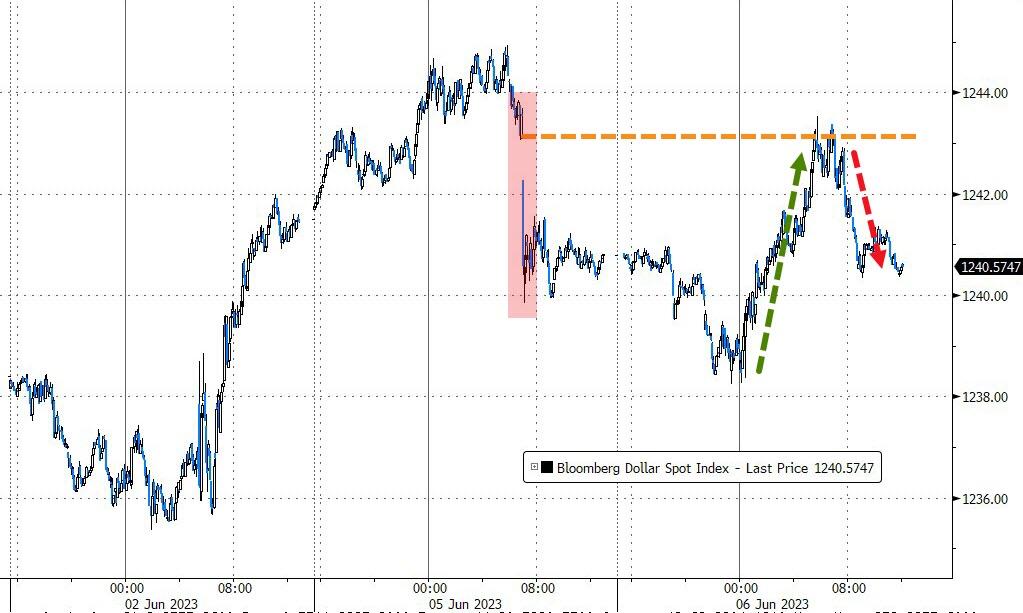
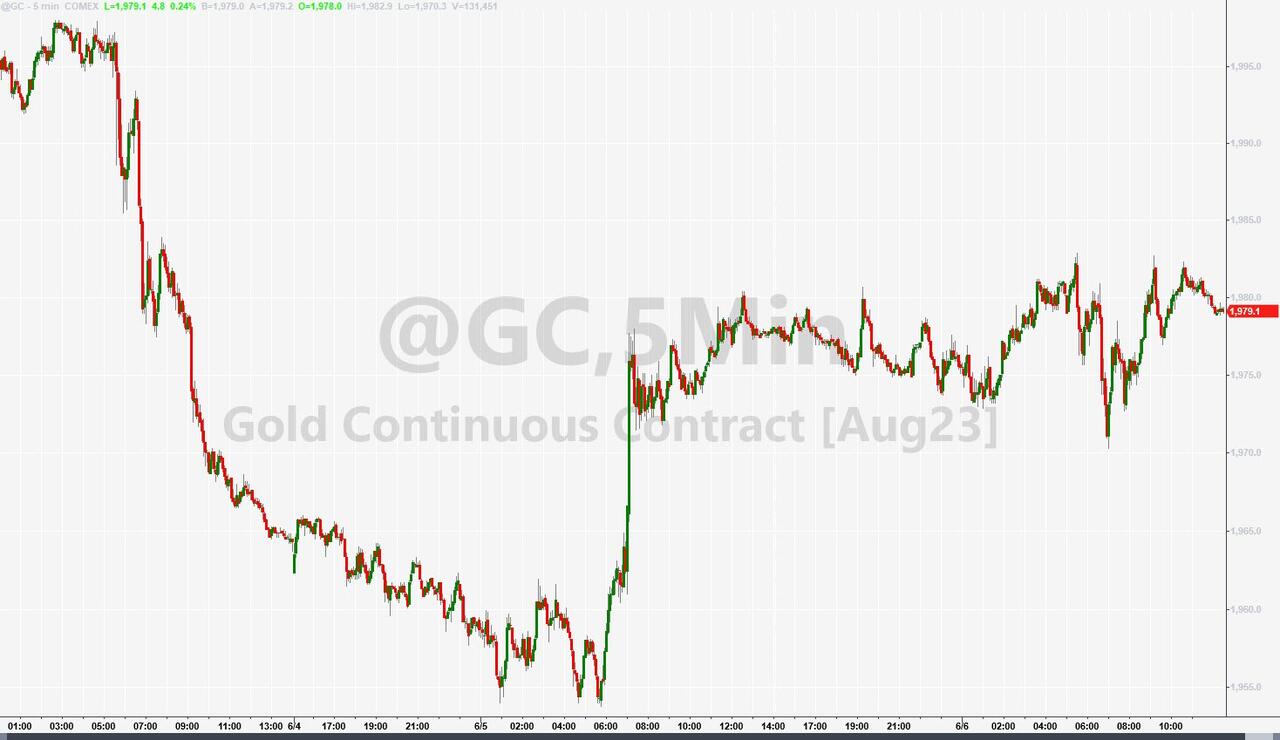
Bond yields rose early in the session but fell back later. The US dollar had a wild ride but ended up flat. Gold added to its gains from yesterday.
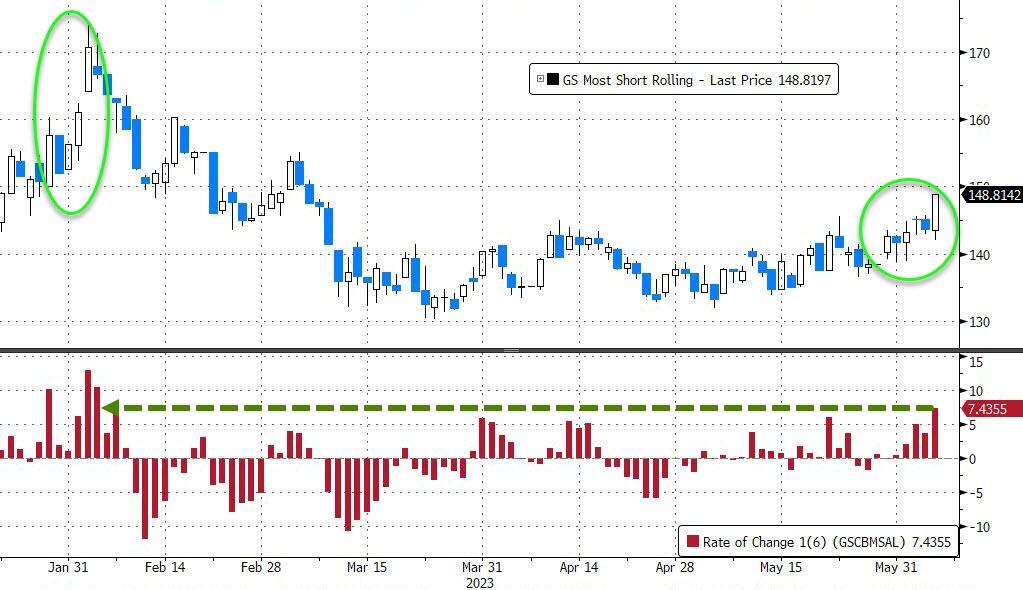
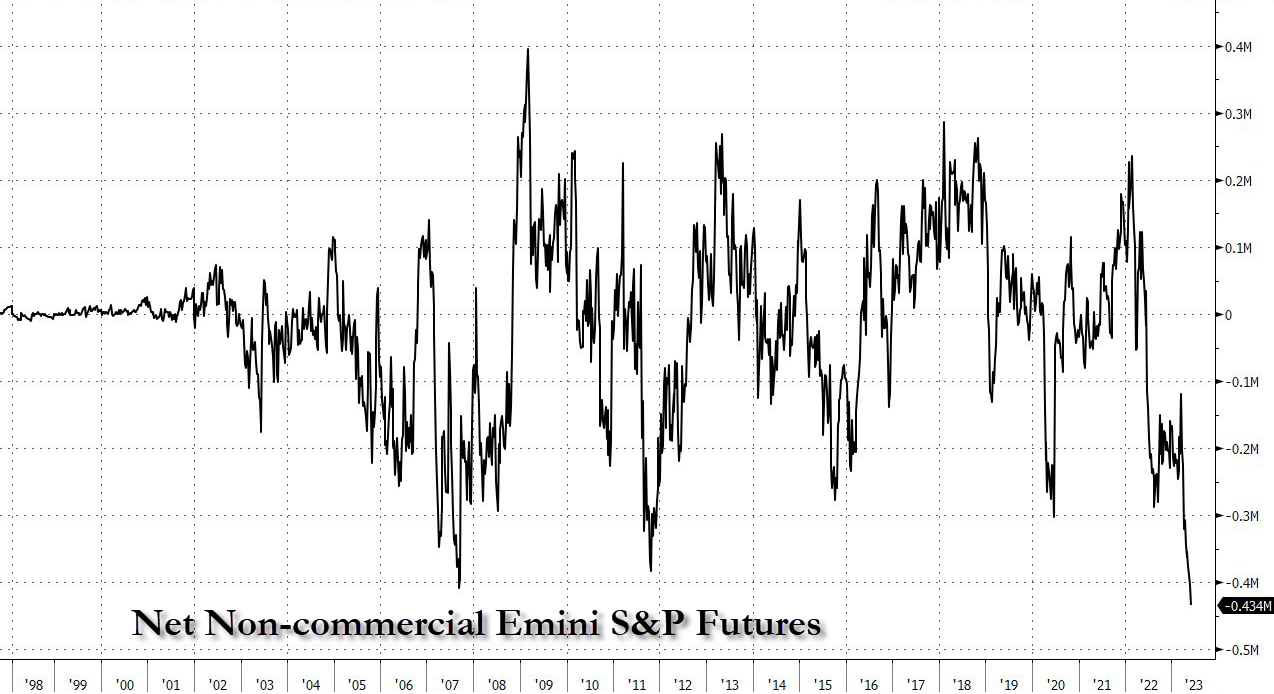
The world is betting against the S&P 500 right now, which makes me wonder if this rally has any legs left. To me, it looks like the market is out of sync and the S&P is on thin ice. It’s sensible to have a sell stop discipline in place.
- “Buy” Cycle Suggestions
The current Buy cycle began on 12/1/2022, and I gave you some ETF tips based on my StatSheet back then. But if you joined me later, you might want to check out the latest StatSheet, which I update and post every Thursday at 6:30 pm PST.
You should also think about how much risk you can handle when picking your ETFs. If you are more cautious, you might want to go for the ones in the middle of the M-Index rankings. And if you don’t want to go all in, you can start with a 33% exposure and see how it goes.
We are in a crazy time, with the economy going downhill and some earnings taking a hit. That will eventually drag down stock prices too. So, in my advisor’s practice, we are looking for some value, growth and dividend ETFs that can weather the storm. And of course, gold is always a good friend.
Whatever you invest in, don’t forget to use a trailing sell stop of 8-12% to protect yourself from big losses.
- Trend Tracking Indexes (TTIs)
Our Domestic TTI rose sharply, even though the S&P only made a small gain. It reached its highest level above its trend line since 5/1/23. However, this does not mean we should increase our exposure.
The market is still very volatile and could change direction quickly. The Fed meeting next week could be a catalyst for a big move, depending on how the market reacts to its decision.
This is how we closed 06/06/2023:
Domestic TTI: +1.66% above its M/A (prior close +0.97%)—Buy signal effective 12/1/2022.
International TTI: +6.03% above its M/A (prior close +5.58%)—Buy signal effective 12/1/2022.
All linked charts above are courtesy of Bloomberg via ZeroHedge.
Contact Ulli