Hawkish Pause: How The Fed Confused The Market

Ulli Market Commentary Contact

[Chart courtesy of MarketWatch.com]

  1. Moving the markets

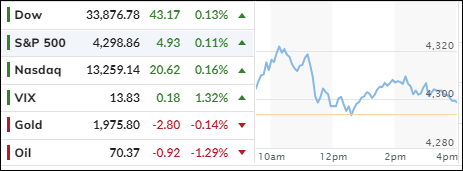
The Fed decided to hold off on raising interest rates this month, despite signs of inflation in the economy. This was good news for traders who were hoping for a pause in the Fed’s tightening cycle. But it also raised some questions about the Fed’s credibility and its ability to fight inflation in the future.

The market got a hint of the Fed’s decision earlier in the day when the Producer Price Index (PPI) came in lower than expected. The PPI measures the change in prices of goods and services sold by producers. It fell by 0.3% in May, compared to a forecast of a 0.1% drop. This brought the annual PPI down to 1.1%, the lowest since December 2020.

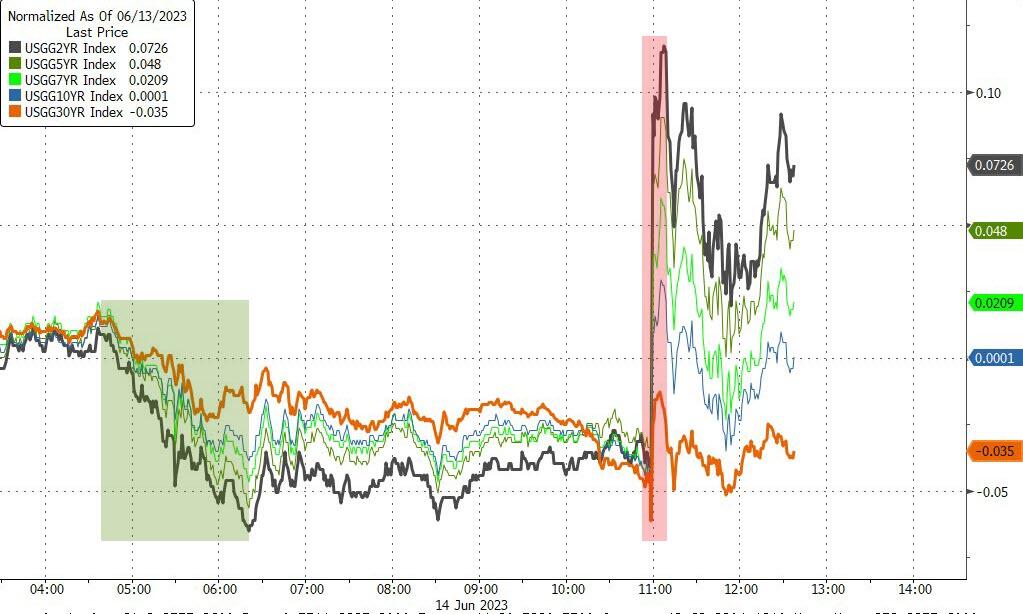
This suggested that inflation pressures were easing, or at least not as bad as feared. Traders took this as a sign that the Fed would not hike rates this month, but rather wait and see how the economy evolves. They were right.

In its statement, the Fed said that it would keep its benchmark rate in the 5%-5.25% range, and that any further rate hikes would depend on the economic data. It also added a new sentence, saying that holding rates steady would allow it to assess more information and its implications for monetary policy.

The Fed also said that it was prepared to adjust its policy stance if risks emerged that could impede its goals of price stability and maximum employment. This was a subtle way of saying that it could cut rates if inflation fell too low or if the economy slowed down significantly.

The Fed’s message was clear: it was not done with hiking rates, but it was not in a hurry either. It was taking a “hawkish pause”, as ZeroHedge put it.

However, not everyone was convinced by the Fed’s logic. Some analysts pointed out that the Fed was ignoring other indicators of inflation, such as consumer prices, wages, and oil prices. They also noted that the Fed was losing credibility by changing its tone from a “dovish hike” in May to a “hawkish pause” in June.

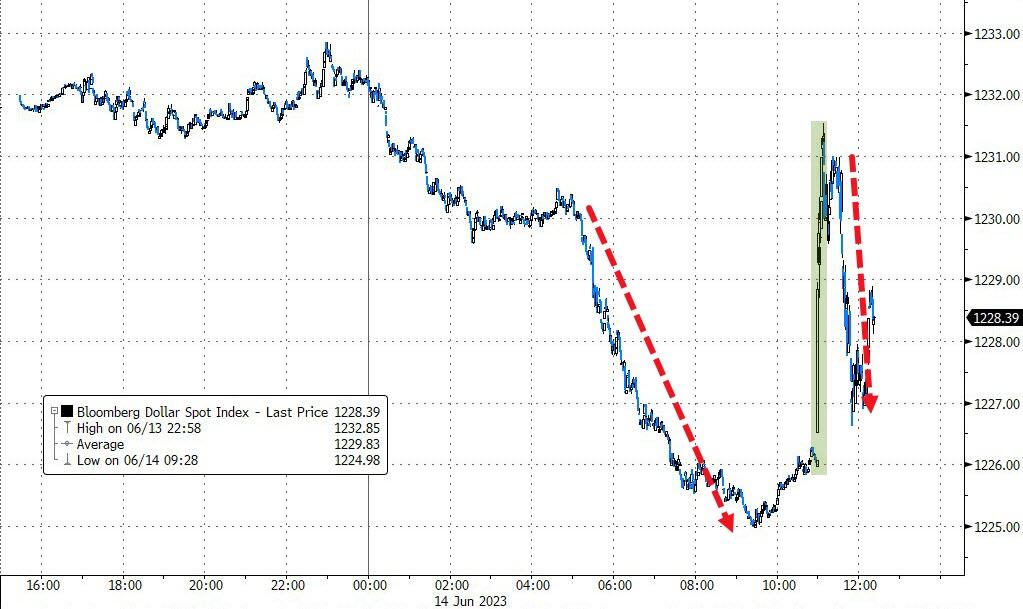
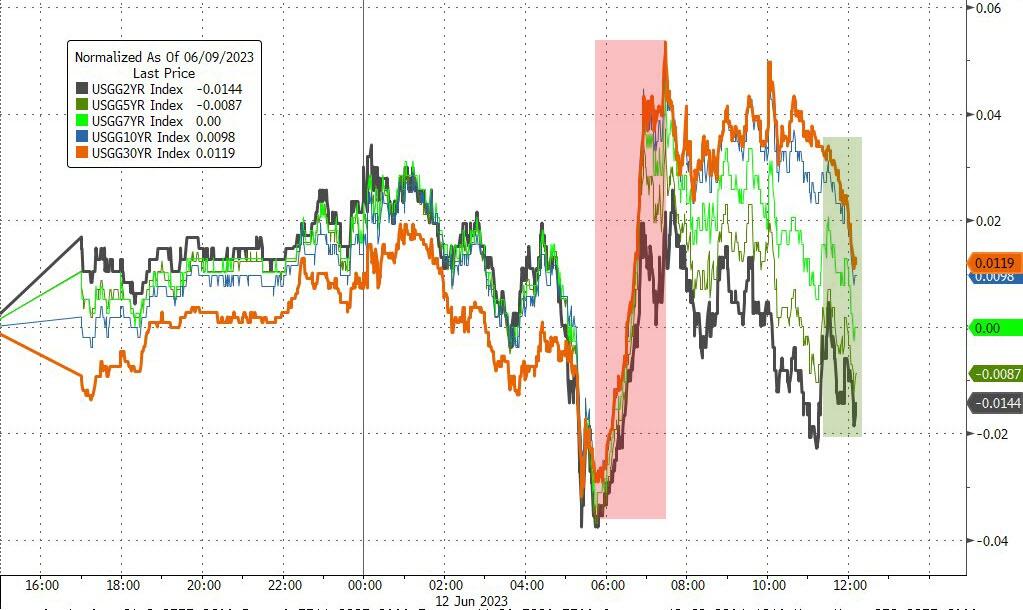
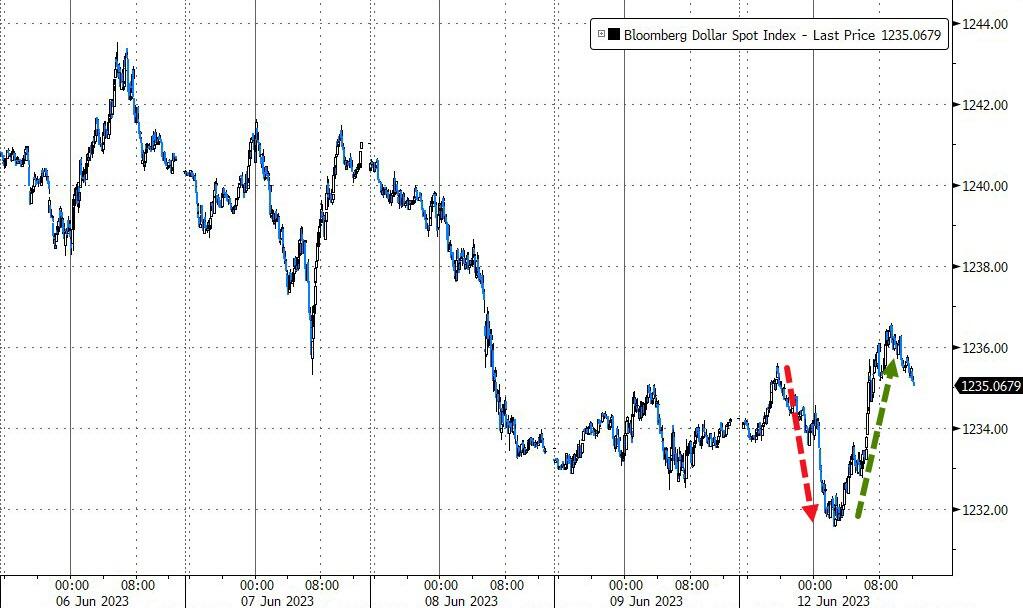
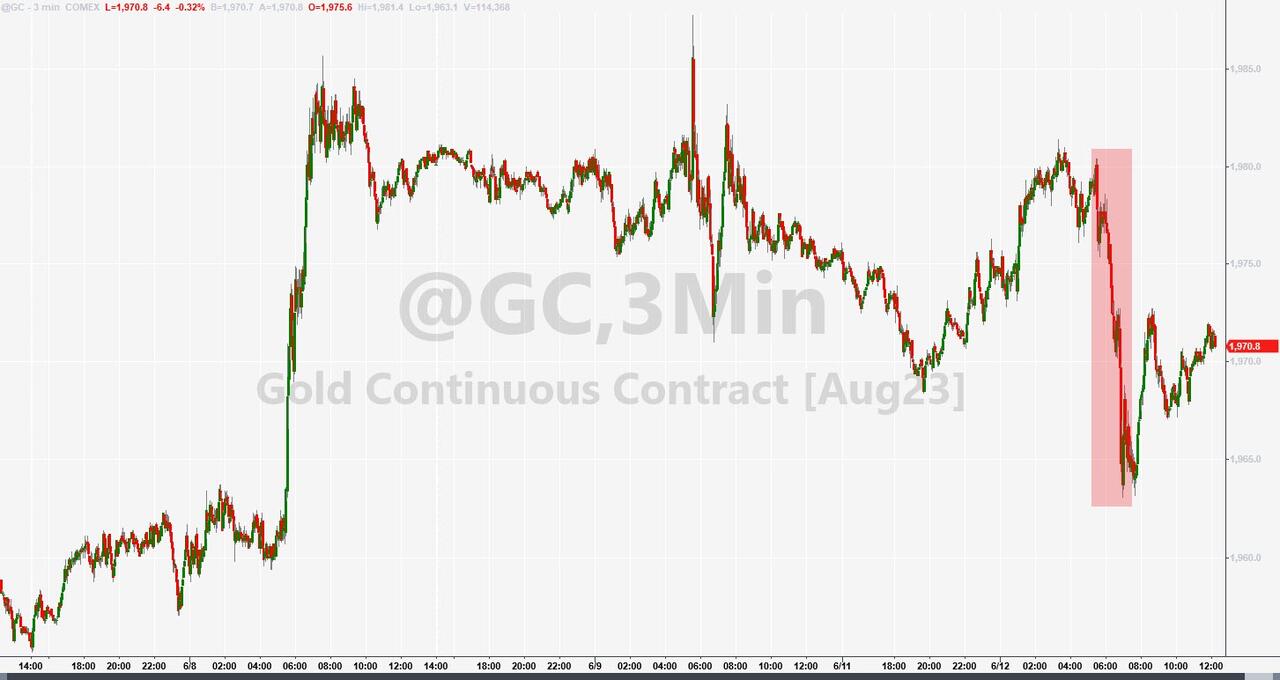
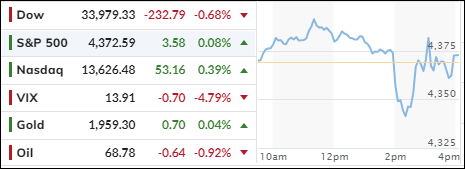
The market reaction was mixed. Stocks initially sold off, but then recovered and ended near flat. Gold also dipped, but then bounced back. Bonds and the dollar fell and stayed low. The Nasdaq was the best performer among the major indexes, as tech stocks benefited from lower interest rates.

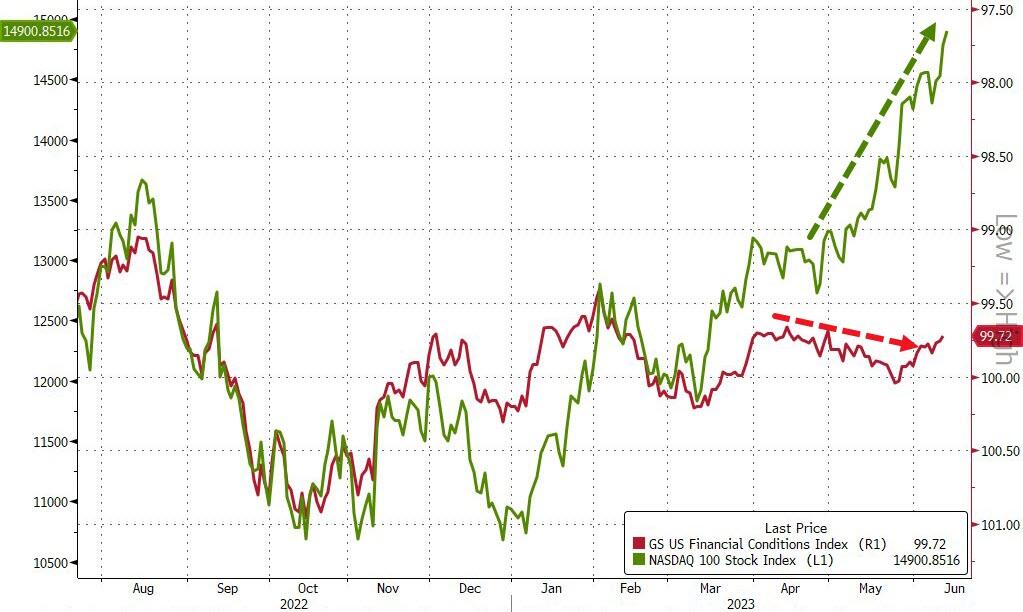
This chart shows the divergence between the Nasdaq and the financial conditions index, which measures how easy or hard it is to borrow money in the market. The index has been rising, indicating tighter financial conditions, while the Nasdaq has been soaring, indicating optimism.

This disconnect suggests that either the Nasdaq is too optimistic, or the financial conditions index is too pessimistic. Either way, something has to give.

The market will be watching closely how the economy performs in the coming months, and how the Fed responds to new data. Will inflation prove to be transitory or persistent? Will growth remain strong or falter? Will the Fed stick to its pause or resume its hikes?

These are the questions that will determine the direction of the market in the second half of 2023.

Read More
Inflation Data Sends Mixed Signals Ahead Of Fed Meeting

Ulli Market Commentary Contact

[Chart courtesy of MarketWatch.com]

  1. Moving the markets

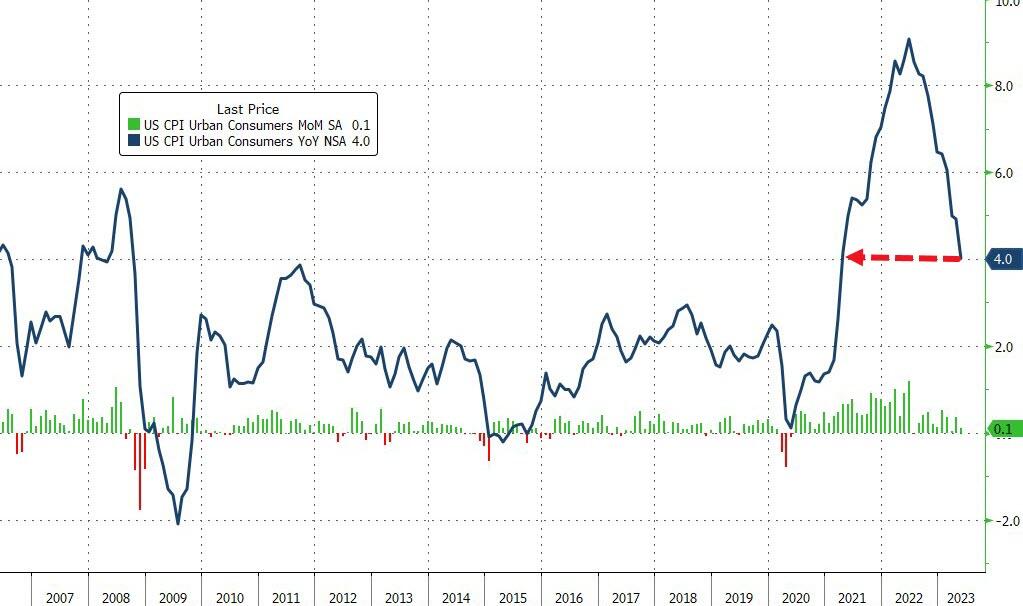
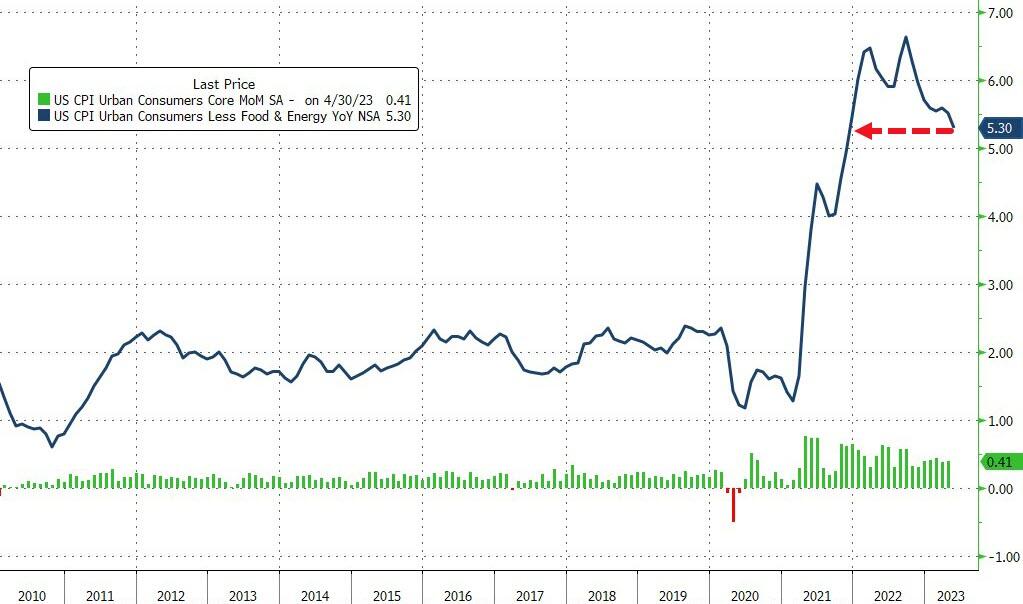
The CPI, which measures the average change in prices of consumer goods and services, rose by 4% in May compared to a year ago. That was the lowest annual increase since March 2021, and in line with what economists had predicted. But the Core CPI, which excludes food and energy prices and is the Fed’s preferred gauge of inflation, jumped by 5.3% over the same period. That was a tad higher than expected but still the lowest rise since November 2021.

You might be wondering how these numbers are calculated, because if you go shopping for anything these days, you’ll notice that prices have gone up much more than these percentages. And to make matters worse, inflation has been growing faster than wages for the last 26 months, which means your purchasing power is shrinking.

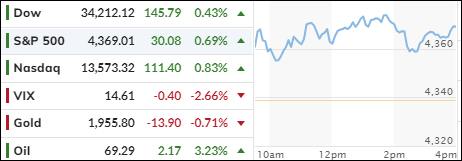
The stock market, however, seemed to like these numbers, and the major indexes closed higher. Investors are betting that the Fed will not raise interest rates too soon or too fast, even though inflation is running hot. Some traders think the Fed might skip a rate hike in June, when it announces its policy decision tomorrow.

But not everyone agrees on what the Fed should do. As ZeroHedge summarized this morning, there are different narratives based on different aspects of the inflation data:

• Headline CPI fell (yay, Fed can relax!).

• Goods inflation rose (Fed can pause as services prices slowed down).

• Core CPI was higher than expected and still high (Fed can’t stop, but maybe skip a hike!).

• SuperCore, which excludes volatile items like food, energy, shelter, and medical care, accelerated (Fed should keep hiking!).

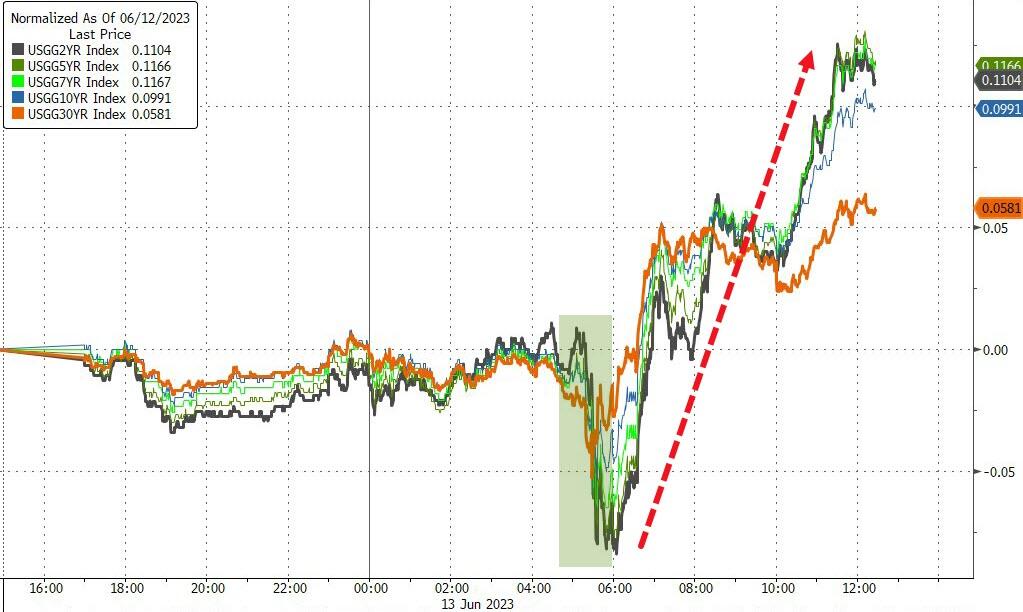
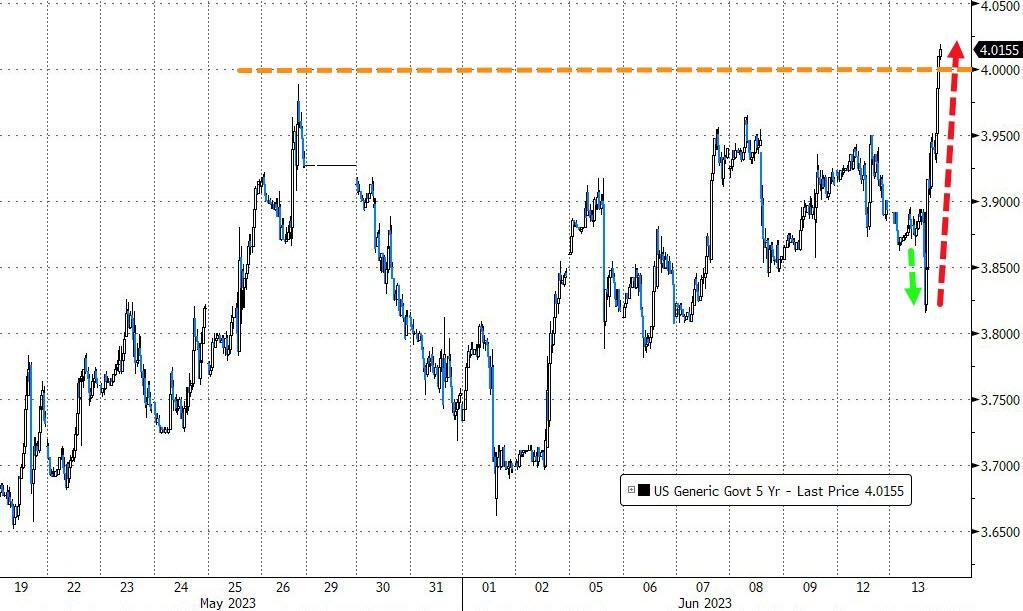
The bond market also reacted to the inflation data. After an initial drop, bond yields rose sharply, with the 2-year yield reaching 4% for the first time since March 10th. The dollar, on the other hand, fell after Treasury Secretary Yellen said she “expects a gradual decline in the dollar’s role as a reserve currency.” Ouch.

Gold also had a wild ride. It surged early on, but then plunged as bond yields went up. Remember, gold and interest rates tend to move in opposite directions.

All eyes are now on the Fed’s meeting tomorrow. Will they signal a change in their stance on inflation and interest rates? The Bespoke Investment Group showed this chart of how the S&P 500 performed after the last six Fed meetings.

Will history repeat itself, or will it be different this time?

Read More

Traders Bet On No Rate Hike This Week, But Will They Regret It?

Ulli Uncategorized Contact

[Chart courtesy of MarketWatch.com]

  1. Moving the markets

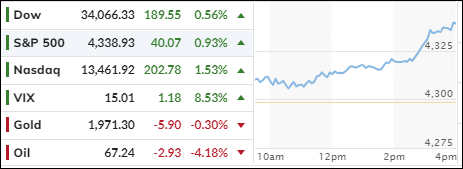
The S&P 500 soared to a 13-month high as traders bet on the Fed holding off on raising interest rates this week. The Fed has already hiked rates 10 times in a row, but now the odds are 74% in favor of a pause.

Maybe tomorrow’s inflation report will confirm that view, as analysts predict a drop from 4.9% to 4% in May. That would be good news for the markets, even if the economy is slowing down. Who cares about earnings when rates are going down, right?

Of course, the Fed won’t admit they are giving in to market pressure. They will still talk tough about fighting inflation and keeping their options open. But the markets are convinced that the tide has turned, and rates will start to fall soon.

That boosted the Nasdaq but left the Small Caps behind. It could be a wild week, though, if inflation surprises to the upside and spoils the party.

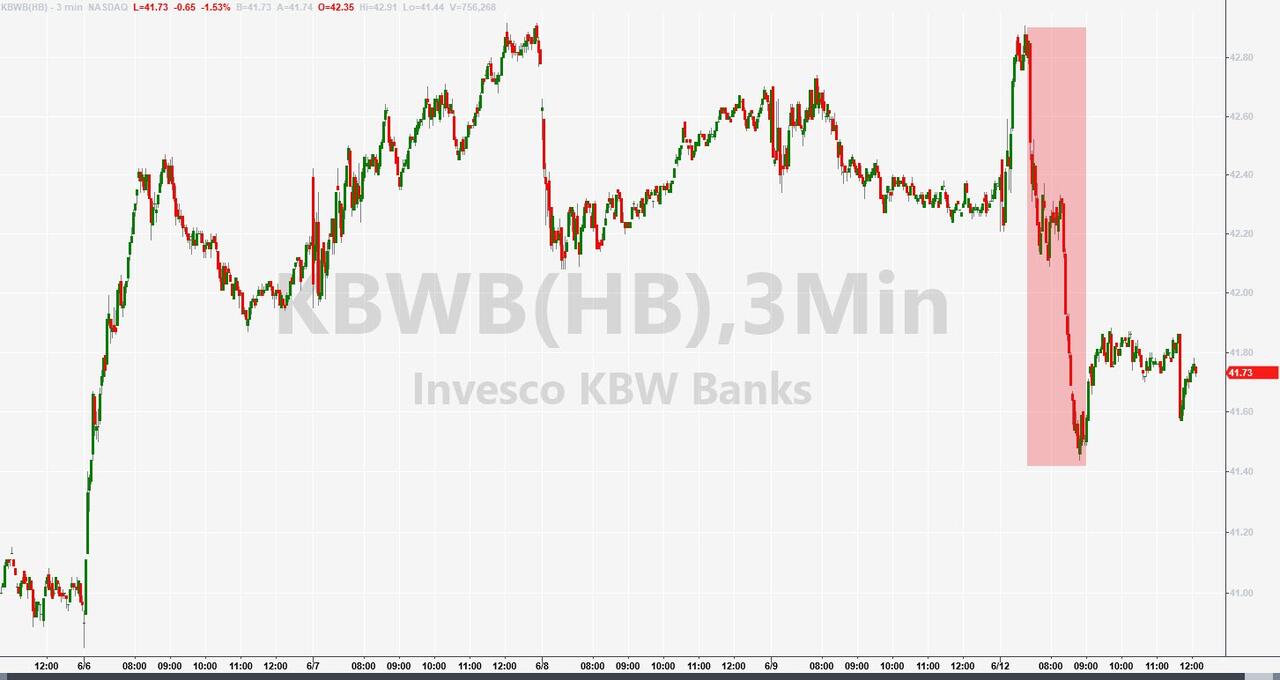
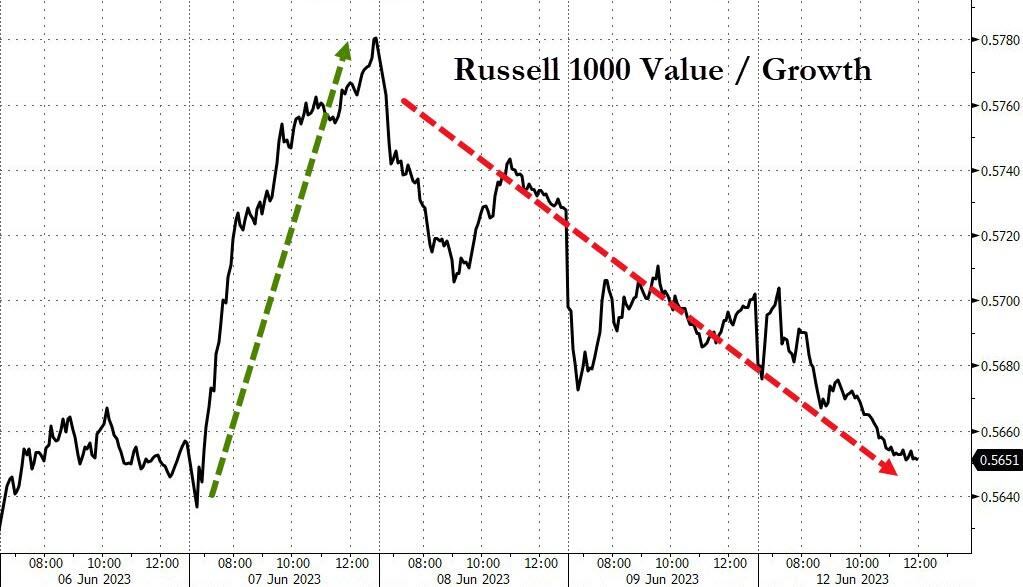
The banks were weak, and the value stocks lost their shine from last week. As ZeroHedge showed with this chart, chasing trends is risky when the markets are so uncertain. One day you’re a winner, the next day you’re a loser.

Bond yields spiked at first but then settled down, leaving the 10-year unchanged. The US Dollar edged up, while Gold swung back and forth and ended slightly lower.

The markets are “hooked on hope” that the Fed will do what they want and keep rates steady. But what if they don’t?

Read More

ETFs On The Cutline – Updated Through 06/09/2023

Ulli ETFs on the Cutline Contact

Do you want to know which ETFs are hot and which ones are not? Then you need my High-Volume ETF Cutline report. It tells you how close or far each of the 312 ETFs I follow is from its long-term trend line (39-week SMA). These are the ETFs that trade more than $5 million a day, so they are not some obscure funds that nobody cares about.

The report is split into two parts: The winners that are above their trend line (%M/A), and the losers that are below it. The yellow line is the line of shame that separates them. You can see how many ETFs are in each group and how they have changed since the last report (182 vs. 183)

Take a peek:

The HV ETF Master Cutline Report

If you are confused by some of the terms we use, don’t panic. I have a helpful Glossary of Terms for you.

If you want to learn more about the Cutline method and how it can make you rich (or at least less poor), read my original post here.

ETF Tracker Newsletter For June 9, 2023

Ulli ETF Tracker Contact

ETF Tracker StatSheet          

You can view the latest version here.

THE STOCK MARKET BUBBLE AND THE TRILEMMA: WHAT’S NEXT?

[Chart courtesy of MarketWatch.com]

  1. Moving the markets

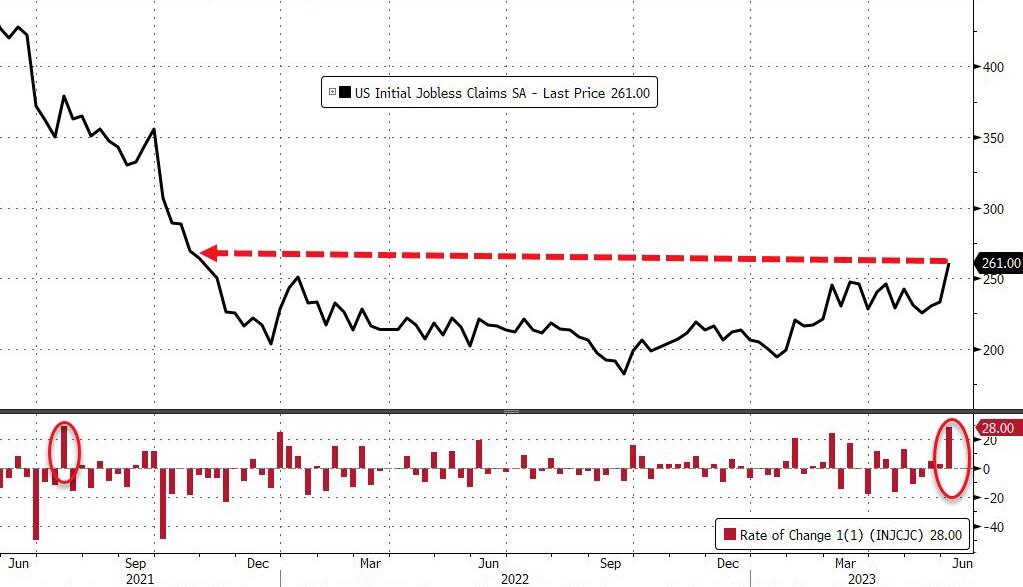
The tech rally seems unstoppable, even as the economy struggles. Just look at the latest jobless claims, which hit a new high since last October. Sure, some people found work and left the benefit rolls, but that’s hardly a sign of recovery.

Meanwhile, the stock market is living in its own bubble, ignoring the bad news and cheering for more stimulus. The S&P 500 reached a new record of 4,300 before retreating slightly, ending the week with a modest gain of 0.4%.

But it’s not all doom and gloom. Some other sectors, like small caps, are joining the party, making the rally more broad-based and sustainable. If this trend continues, investors might become more optimistic and confident.

Of course, a lot depends on what happens next week. We’ll get the latest inflation data, which is expected to show some improvement. And we’ll hear from the Fed, which might pause its rate hikes for a while. That would be music to the ears of the bulls, who are betting on more easy money.

But what if they’re wrong? What if inflation is worse than expected, or the Fed sticks to its hawkish stance? Then we might see a reversal of fortunes, with the bears taking over and the bulls running for cover.

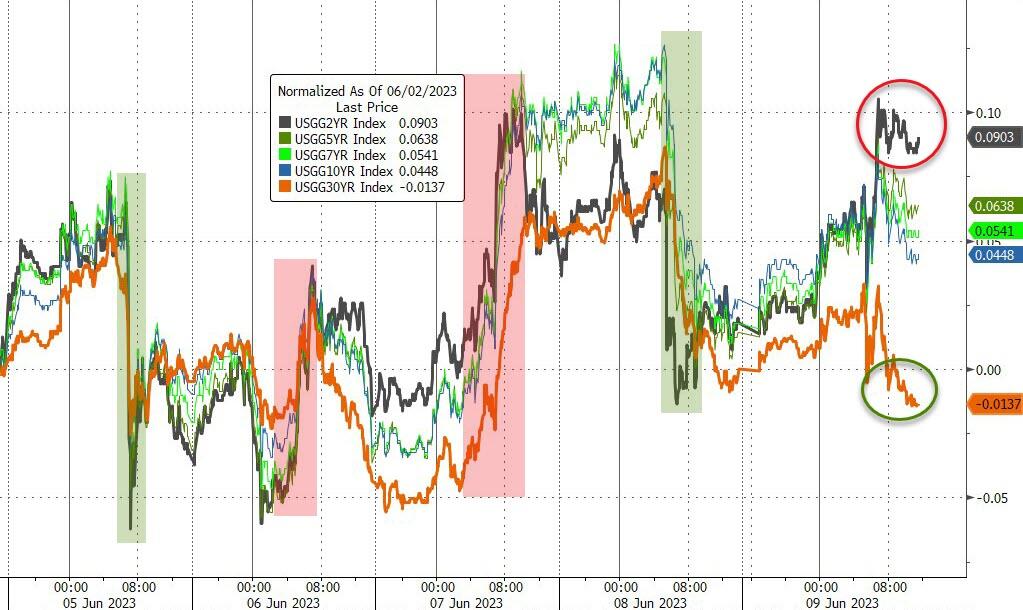
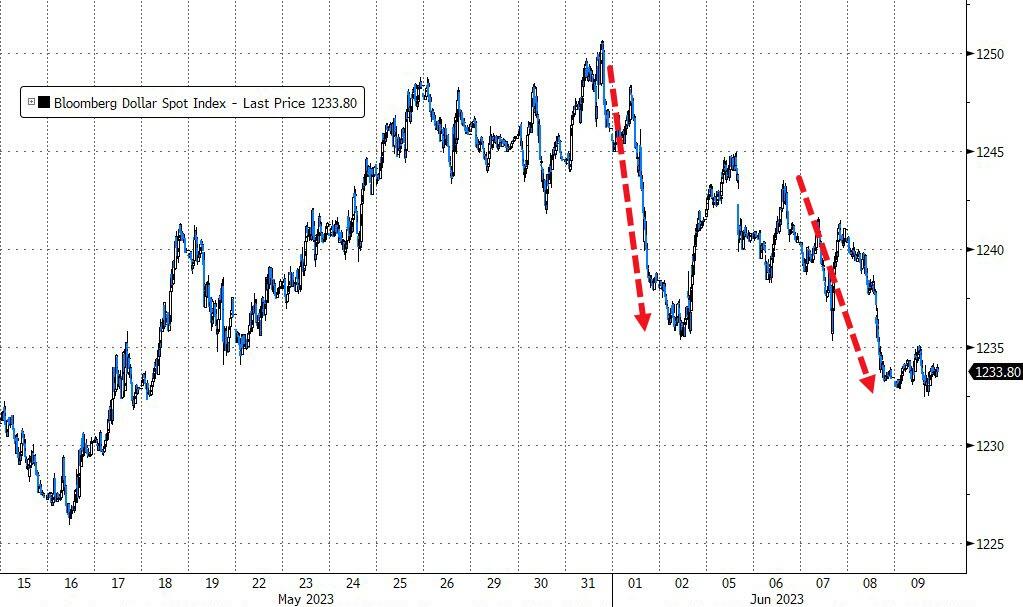
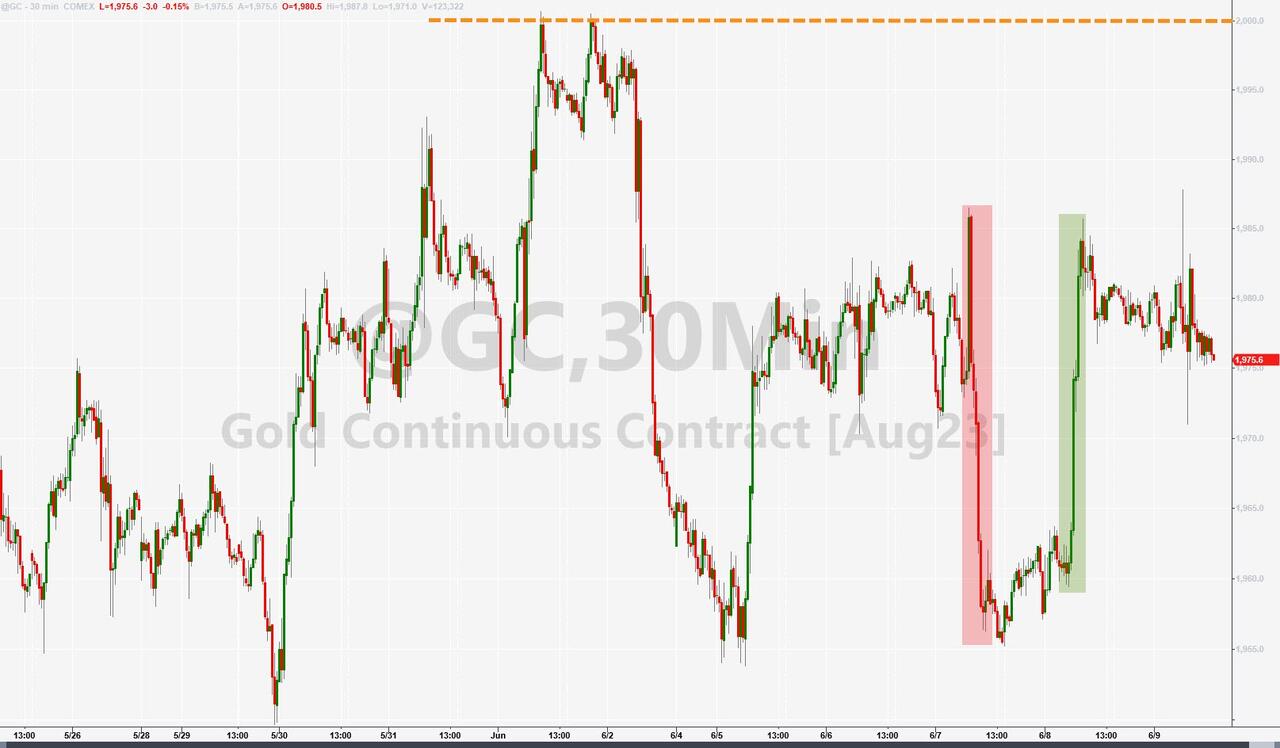
The bond market was mixed this week, with short-term yields rising and long-term yields falling. The dollar weakened for the second week in a row. Gold had a good run but also faced some volatility.

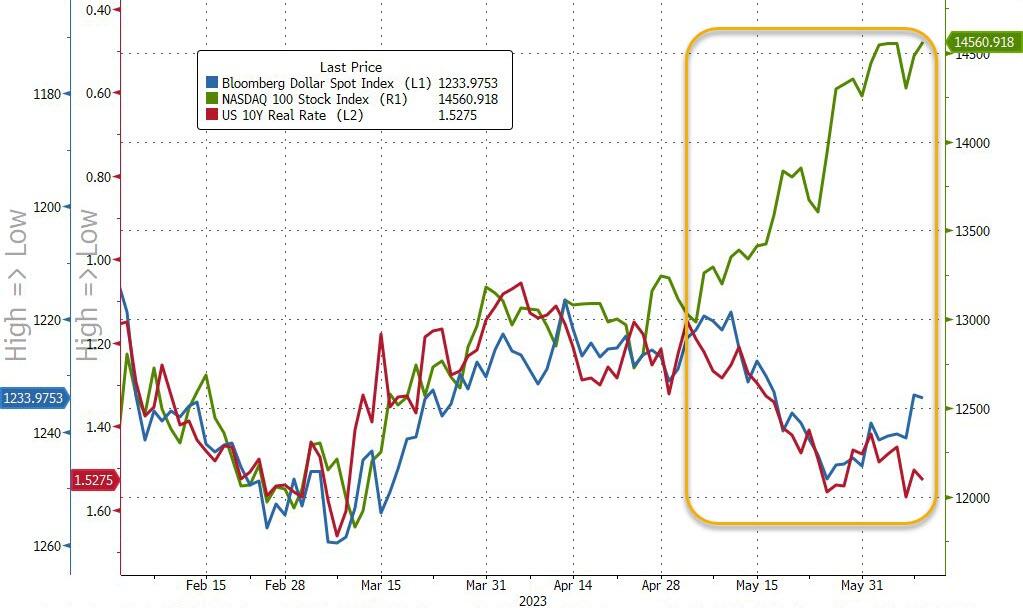
We’re in a tricky situation right now, as ZeroHedge puts it, with three things that don’t make sense together: the dollar, tech stocks and real rates. Can you spot the odd one out in this chart?

Read More

Weekly StatSheet For The ETF Tracker Newsletter – Updated Through 06/08/2023

Ulli ETF StatSheet Contact

ETF Data updated through Thursday, June 8, 2023

How to use this StatSheet:

  1. Out of the 1,800+ ETFs out there, I only pick the ones that trade over $5 million per day (HV ETFs), so you don’t get stuck with a lemon that nobody wants to buy or sell.
  1. Trend Tracking Indexes (TTIs)

These are the main indicators that tell you when to buy or sell Domestic and International ETFs (section 1 and 2). They do that by comparing their position to their long-term M/A (Moving Average). If they cross above, and stay there, it’s a green light to buy. If they fall below, and keep going, it’s a red light to sell. And to make sure you don’t lose your shirt if things go south, I also use a 12% trailing stop loss on all positions in these categories.

  1. All other investment areas don’t have a TTI and should be traded based on the position of each ETF relative to its own trend line (%M/A). That’s why I call them “Selective Buy.” In other words, if an ETF goes above its own trend line, you can buy it. But don’t forget to use a trailing sell stop of 12%, or less if you’re feeling nervous.

If some of these words sound like Greek to you, please check out the Glossary of Terms and new subscriber information in section 9.

  1. DOMESTIC EQUITY ETFs: BUY— since 12/01/2022

Click on chart to enlarge

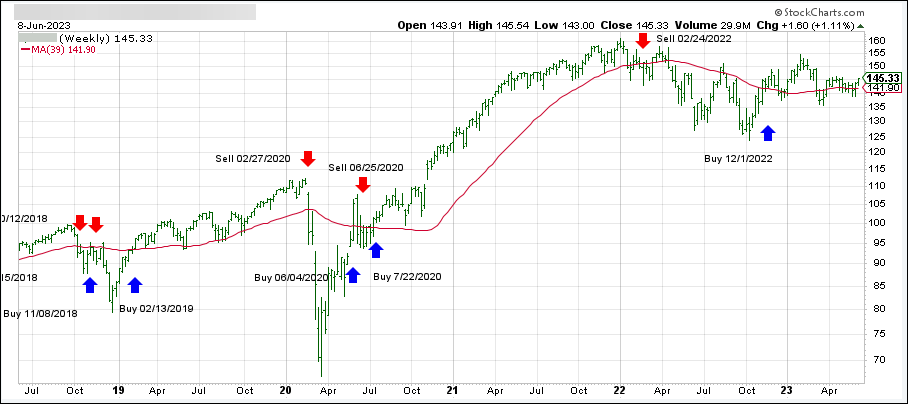
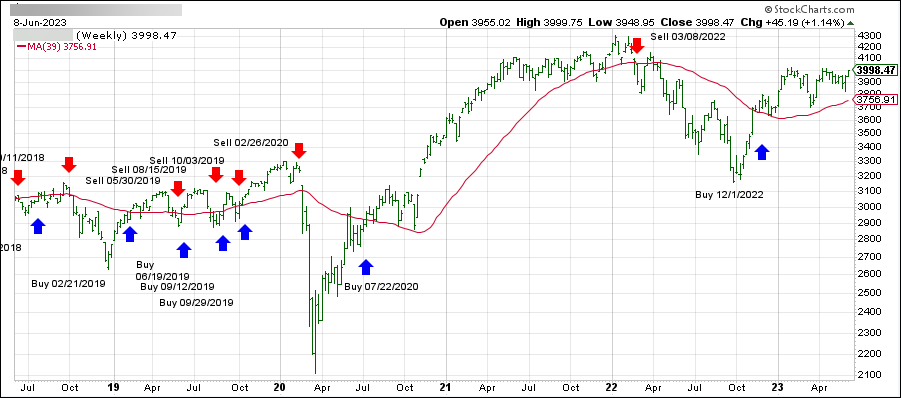
This is our main compass, the Domestic Trend Tracking Index (TTI-green line in the above chart). It just broke back above its long-term trend line (red) by +2.45% and remains in “Buy” mode.

The link below shows all High Volume (HV) Domestic Equity ETFs. They are ranked by M-Index, which is my secret sauce for measuring momentum. Prices in all linked tables below are updated through 06/08/2023, unless otherwise noted. Price data not yet available at publication is indicated with 00.00% or -100.00%. Please note that distributions are not included in the current momentum numbers.

If the TTI is above the trend line, you can use the tables in the link below to pick your winners:

http://www.successful-investment.com/SSTables/HVDomETFs060823.pdf

  1. INTERNATIONAL ETFs: BUY — since 12/01/2022

Click on chart to enlarge

This is our global guide, the International Trend Tracking Index (green). It has moved +6.75% above its long-term trend line (red) and is now in “Buy” mode as posted.

The list in the link below shows the High Volume (HV) International ETFs I track for you during a Buy cycle. They are also ranked by M-Index:

http://www.successful-investment.com/SSTables/HVInternETFs060823.pdf

  1. ETF MASTER LIST

This is the mother of all lists, showing all ETFs I track and how they stack up against each other. The sorting order is by M-Index too. Momentum figures for all ETFs are not adjusted for dividends.

http://www.successful-investment.com/SSTables/HVETFMaster060823.pdf

  1. COUNTRY ETFs: SELECTIVEBUY

This is where you can find HV ETFs for specific countries or regions that I watch every week. Please note that the data in this table does not include adjustments due to distributions. Country funds can be wild beasts, so make sure you use a trailing stop loss (I use 10%) to protect yourself from nasty bites.

http://www.successful-investment.com/SSTables/HVCountryETFs060823.pdf

  1. SECTOR ETFs: SELECTIVEBUY

This is where you can diversify your portfolio by looking for different opportunities in various sectors of the market. The table of HV Sector ETFs in the following link covers a wide range of possibilities. The sorting order is by M-Index:

http://www.successful-investment.com/SSTables/HVSectorETFs060823.pdf

Here too, I recommend using a 10% trailing stop loss to limit your risk.

  1. BOND & DIVIDEND ETFs: SELECTIVE BUY

If you like getting paid for holding ETFs, here’s a list of bond and dividend paying ETFs. But before you buy them, make sure you check their momentum figures first. Then you can visit your favorite financial web site to see their yield and other details.

Please note that the data in this table does not include adjustments due to distributions.

http://www.successful-investment.com/SSTables/HVBond_DivETFs060823.pdf

  1. BEAR MARKET ETFs: SELECTIVE BUY

Below are some of the most popular bear market ETFs and their momentum figures:

http://www.successful-investment.com/SSTables/HVBearETFs060823.pdf

Please note that some of these funds try to beat the index they are tied to by a certain percentage. This can boost your returns, but it can also magnify your losses. So be careful and use a trailing sell stop (I suggest 10%) and be ready for some bumps along the way.

  1. NEW SUBSCRIBER INFORMATION

To get a head start on more successful investing, please click on:

http://www.successful-investment.com/SellStopDiscipline.pdf

In case you missed it, you can download my latest e-book “How to beat the S&P 500…with the S&P 500,” here. If you are investing your 401k and must use mutual funds, I suggest you mainly stick with the S&P 500 as described in my book. Of course, you can always use the above tables to find sector or country ETFs that suit your taste and use the equivalent mutual funds as offered by your custodian.

Disclosure:

I must tell you that I, as well as my advisory clients, own some of the ETFs listed in the above table. Also, they are not meant to be specific investment recommendations for you, they just show which ETFs from my universe are doing well right now.