
ETF Tracker StatSheet
You can view the latest version here.
Bulls Run Wild After Senate Unleashes Money Printing: How Long Can It Last?
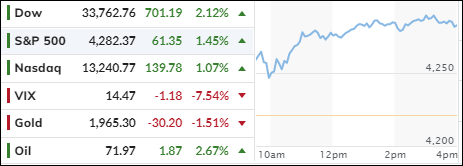
[Chart courtesy of MarketWatch.com]
- Moving the markets
The market soared today after the Senate cleared the way for more money printing by suspending the debt ceiling until 2025. This means the Fed and the politicians can create trillions of new dollars out of thin air, which will eventually lead to runaway inflation. Ouch!
Some of this new money will flow into the stock market, boosting the bullish mood. But there is a catch: the US Treasury is broke and needs to borrow at least $1 trillion in the next few months, sucking out liquidity from the market. That is a big bearish risk.
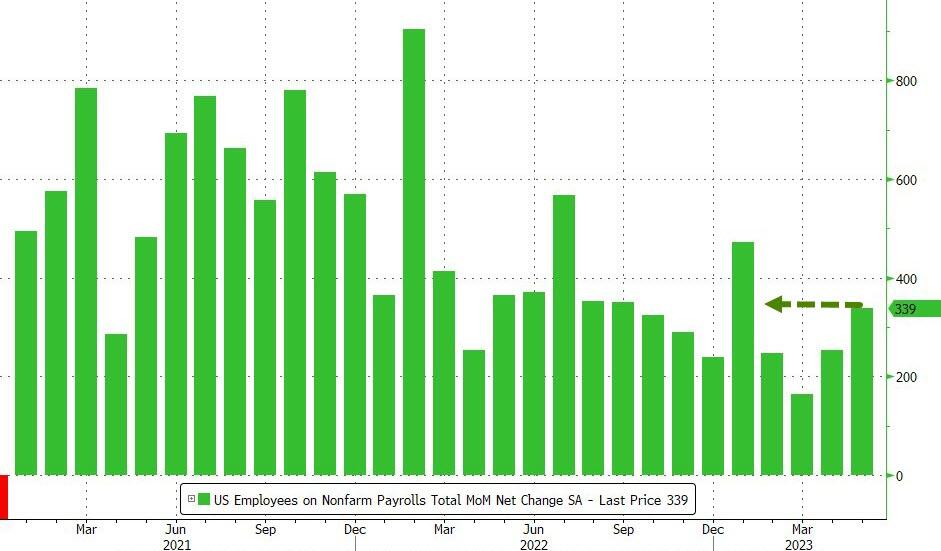
The bulls also cheered the strong May jobs report, which showed a huge jump in payrolls and a slight increase in unemployment. Usually, this would be bad news for the market, as it would signal a tighter Fed policy. But today, the market shrugged off that possibility and focused on the positive side of a robust labor market.
But how reliable are these numbers? Economist Nick Bunker questioned the quality of the payroll data:
The unemployment rate rose for all the wrong reasons. More employed people moving into unemployment and fewer unemployed workers finding jobs.”
ZeroHedge pointed out a possible source of distortion:
The birth death model “added” 231K jobs in March. These are not actual jobs, but merely an assumption by the BLS as to how many new businesses were created and hired workers based on statistical assumptions. Again, these are not actual jobs.
Today’s rally was broad based, with our Domestic Trend Tracking Index (TTI-section 3), finally outperforming the S&P 500. That had not been the case for most of 2023, as only a small segment of the market drove the gains.
These drivers were, and still are, Artificial Intelligence (AI) and General Productivity Tools (GPT).
Without them, the rest of the market would be in negative territory for the year. It is debatable whether this is a bubble, or a genuine technological breakthrough based on fundamentals.
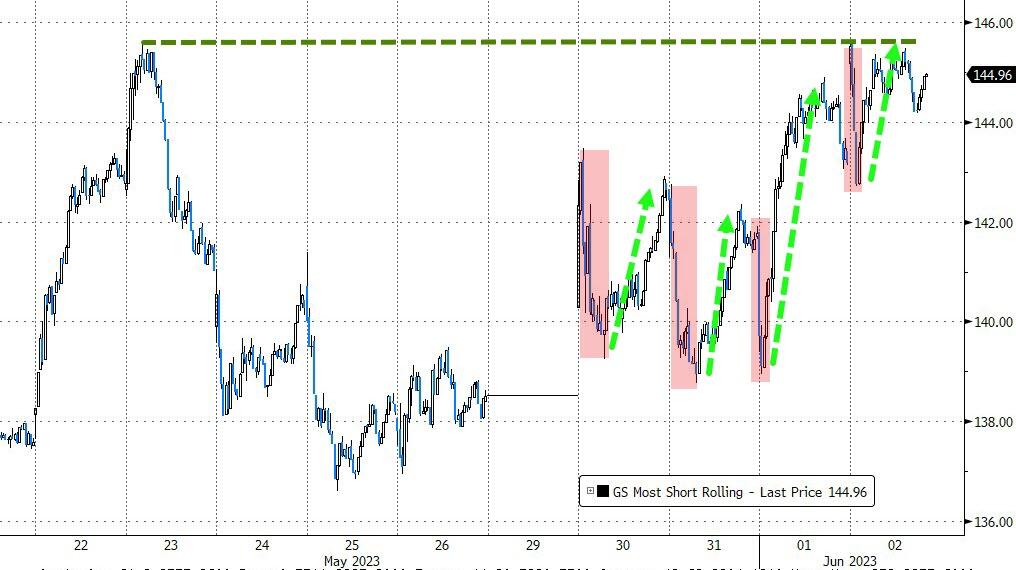
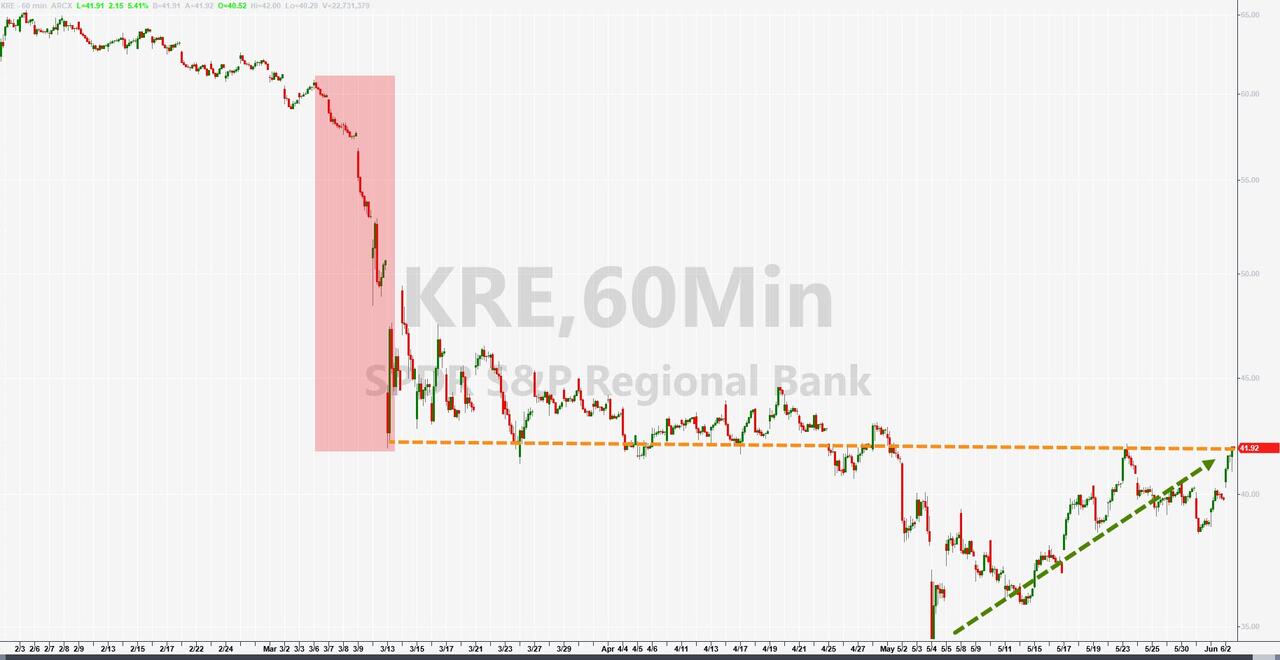
Of course, no rally is complete without a short squeeze. That happened today when yesterday’s squeeze continued in two stages. Regional bank stocks, as represented by KRE, rose for the third week in a row, despite losing deposits.
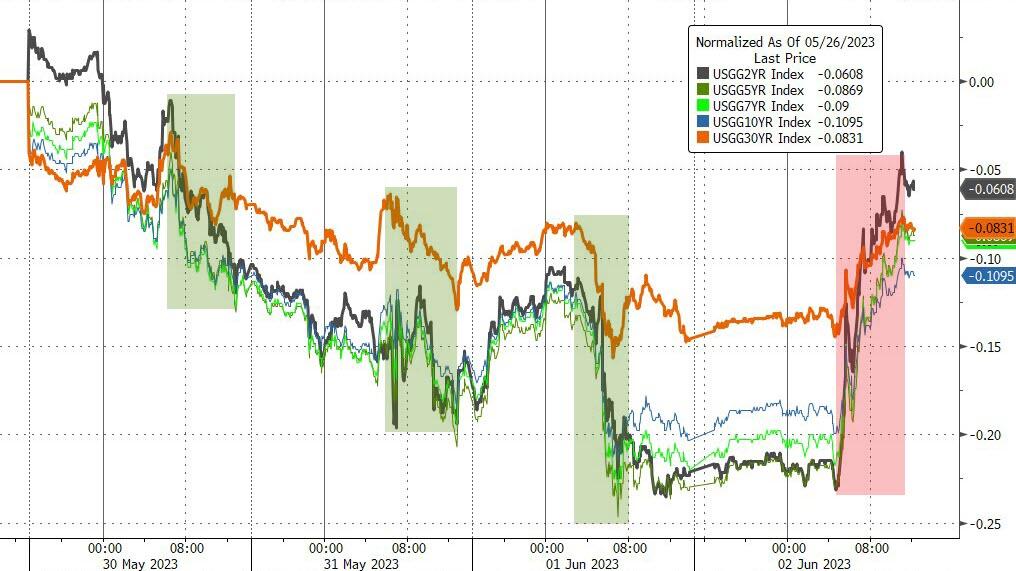
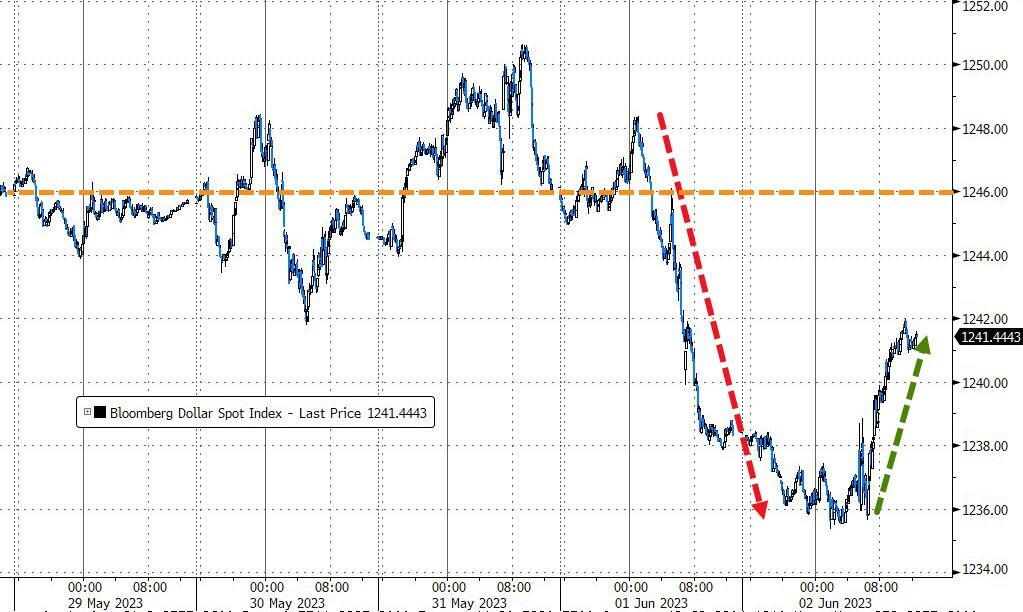
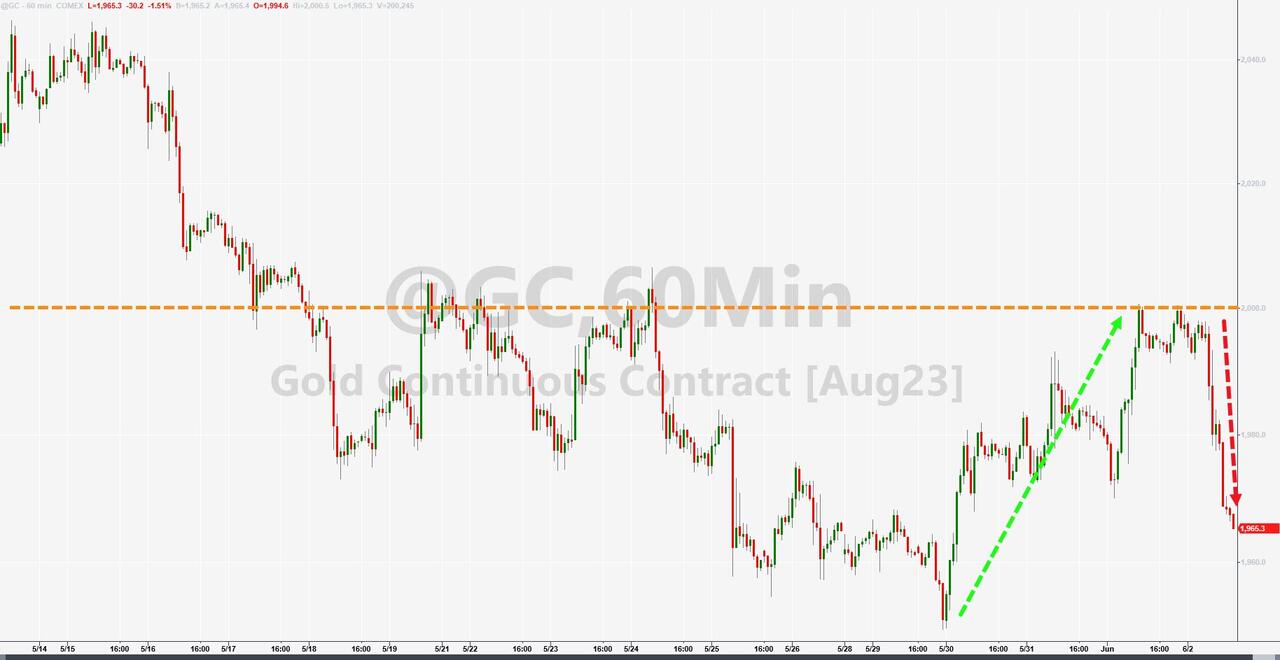
Bond yields climbed, the US dollar fell this week, despite a bounce today, and gold retreated after touching $2k mid-week.
On Wall Street, none of these worries mattered as optimism prevailed. Some traders called this a “Goldilocks” scenario, where inflation is cooling down and the Fed is easing up, creating a soft landing for the economy.
I wouldn’t bet on it.
- “Buy” Cycle Suggestions
The current Buy cycle began on 12/1/2022, and I gave you some ETF tips based on my StatSheet back then. But if you joined me later, you might want to check out the latest StatSheet, which I update and post every Thursday at 6:30 pm PST.
You should also think about how much risk you can handle when picking your ETFs. If you are more cautious, you might want to go for the ones in the middle of the M-Index rankings. And if you don’t want to go all in, you can start with a 33% exposure and see how it goes.
We are in a crazy time, with the economy going downhill and some earnings taking a hit. That will eventually drag down stock prices too. So, in my advisor’s practice, we are looking for some value, growth and dividend ETFs that can weather the storm. And of course, gold is always a good friend.
Whatever you invest in, don’t forget to use a trailing sell stop of 8-12% to protect yourself from big losses.
- Trend Tracking Indexes (TTIs)
Our TTIs soared today as the market rallied across the board and pushed our Domestic TTI above its long-term trend line and into the bullish zone.
But don’t get too excited, as these kinds of euphoric spikes can reverse quickly once the market faces harsh reality. And that reality is the US Treasury’s need for $1 trillion to fill its empty piggy bank, which could spoil the party.
Before buying more equity ETFs, I would like to see our TTI hold its ground and not fall back below its line. The next week or so should reveal more about the main trend in the near future.
This is how we closed 06/02/2023:
Domestic TTI: +1.32% above its M/A (prior close -0.74%)—Buy signal effective 12/1/2022.
International TTI: +5.54% above its M/A (prior close +4.20%)—Buy signal effective 12/1/2022.
All linked charts above are courtesy of Bloomberg via ZeroHedge.
———————————————————-
WOULD YOU LIKE TO HAVE YOUR INVESTMENTS PROFESSIONALLY MANAGED?
Do you have the time to follow our investment plans yourself? If you are a busy professional who would like to have his portfolio managed using our methodology, please contact me directly to get more details.
Contact Ulli