Positive Data Lifts Stocks Higher, But Reality Looms

Ulli Market Commentary Contact

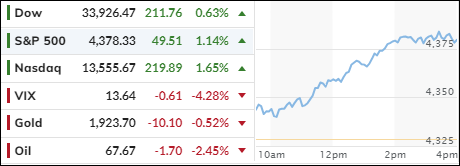
[Chart courtesy of MarketWatch.com]

  1. Moving the markets

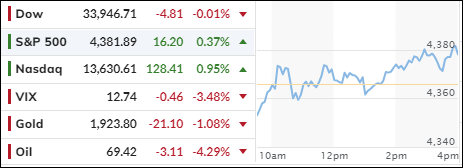
The bulls were in charge today, lifting the major indexes higher with little resistance from the bears. The Dow finally snapped its losing streak of six days, thanks to a tech rally.

A flurry of positive economic data also boosted the market mood, showing signs of strength in the economy, despite the looming threat of a recession. Or maybe we are already in one, but we just don’t know it yet, because we use different metrics now.

Anyway, here are some of the highlights from today’s reports:

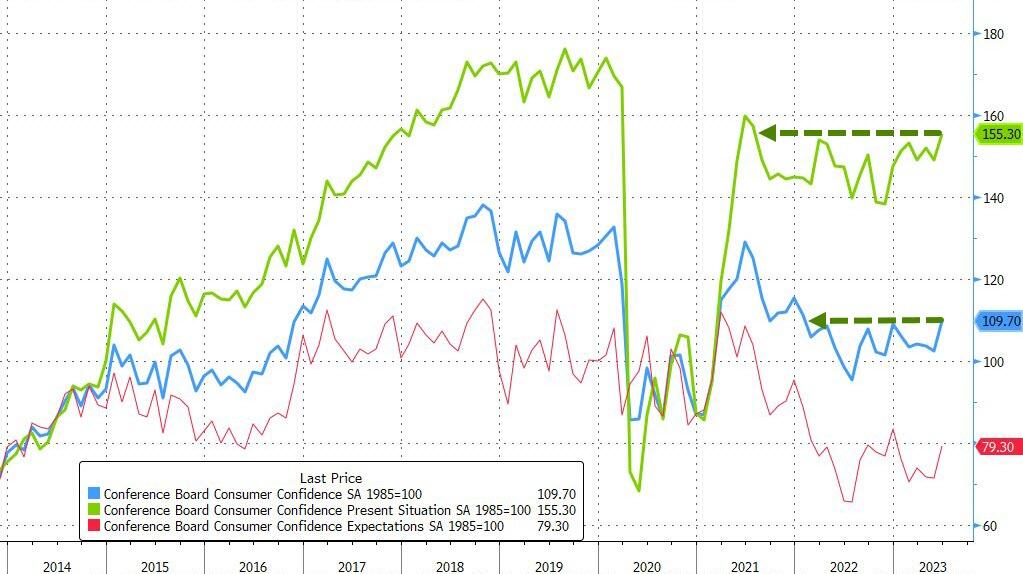
  • Consumer Confidence jumped to its highest level in a year, as people felt more optimistic about the next six months.
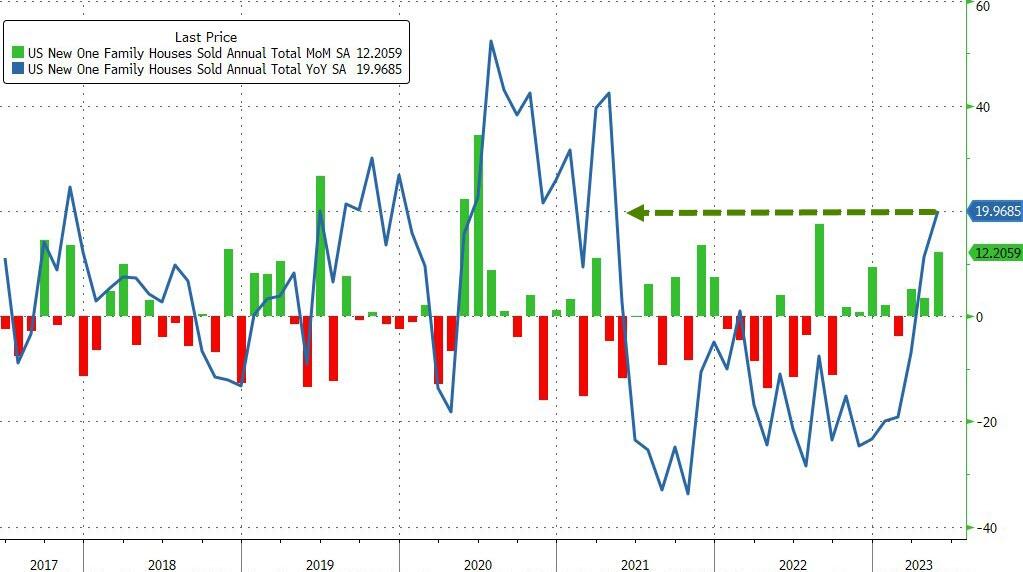
  • New Home Sales surged by 12.2% in May, the biggest increase since May 2022.
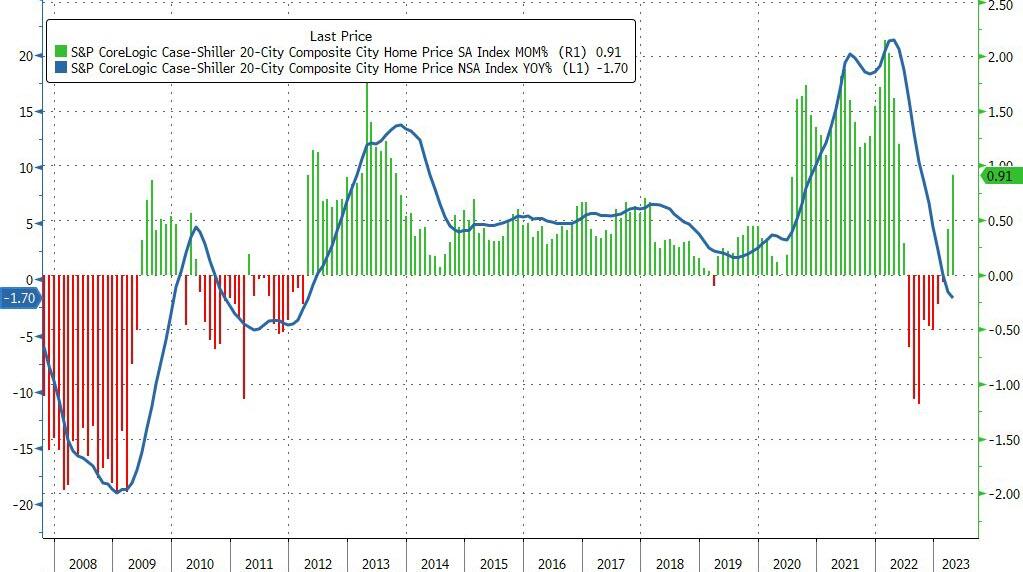
  • Home Prices soared in April, as lower mortgage rates made buying more affordable.
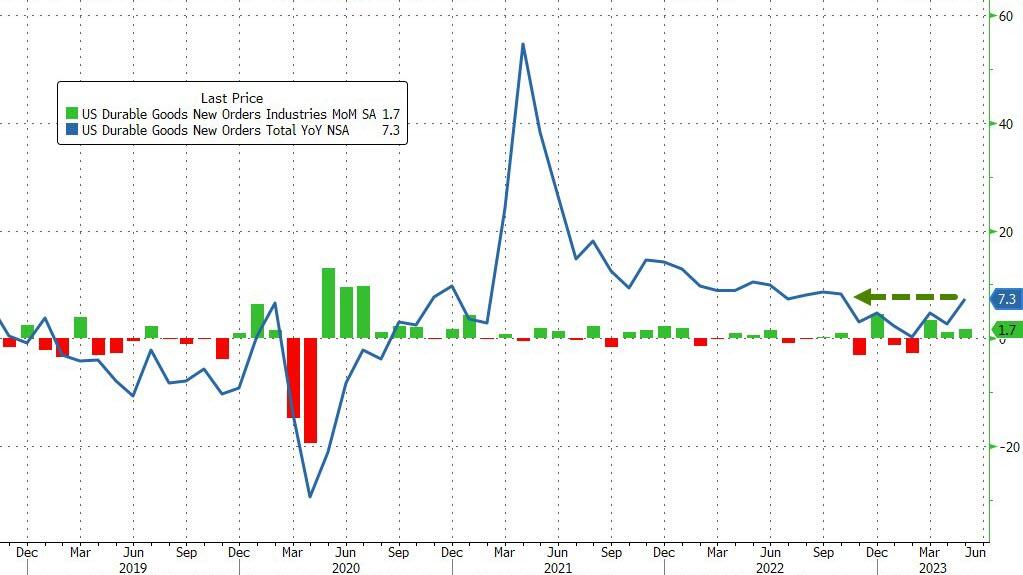
  • Durable Goods Orders rose by 1.7% in May, beating expectations and indicating strong demand for long-lasting goods.

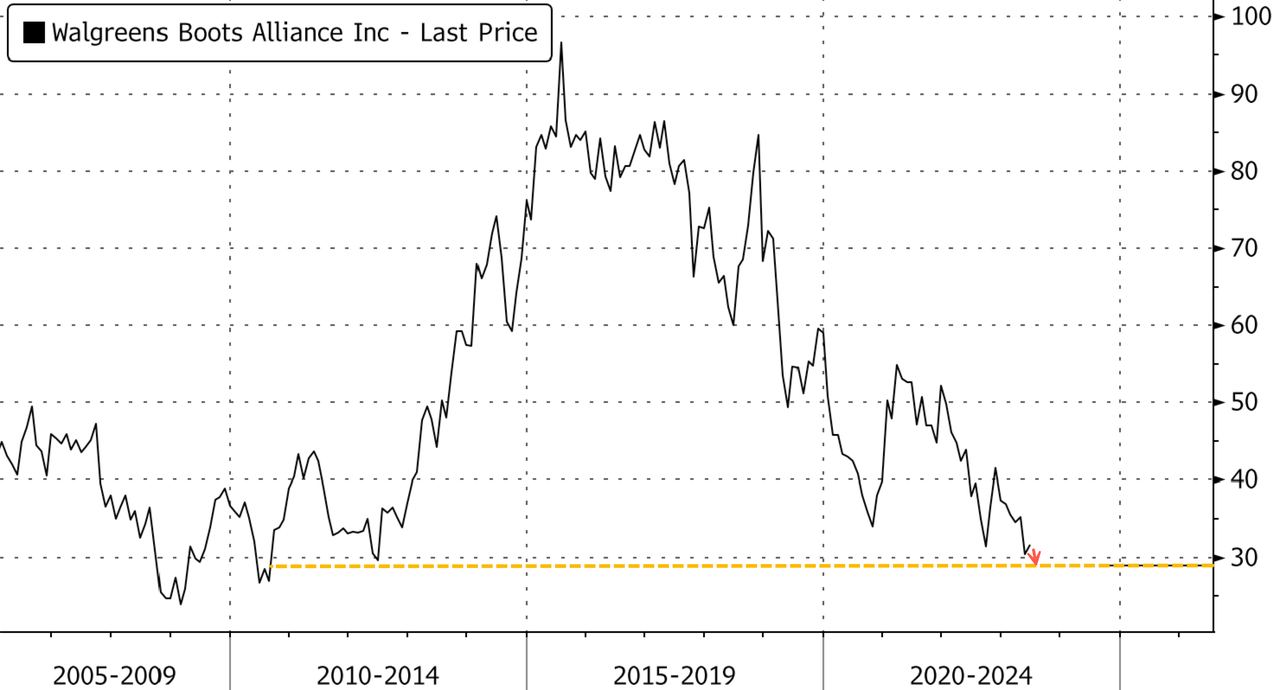
But not everything was rosy today. Walgreen’s cut its earnings guidance and blamed “cautious” customers for its poor performance. Its shares plunged to a 10-year low. Ouch indeed.

Some analysts still think that the economy is doing fine, and that the chances of a recession are fading. If they are right, the Fed might have to raise interest rates a few more times this year, which would put an end to the hopes of a rate cut from Fed chair Powell. I doubt that he will change his hawkish stance anytime soon.

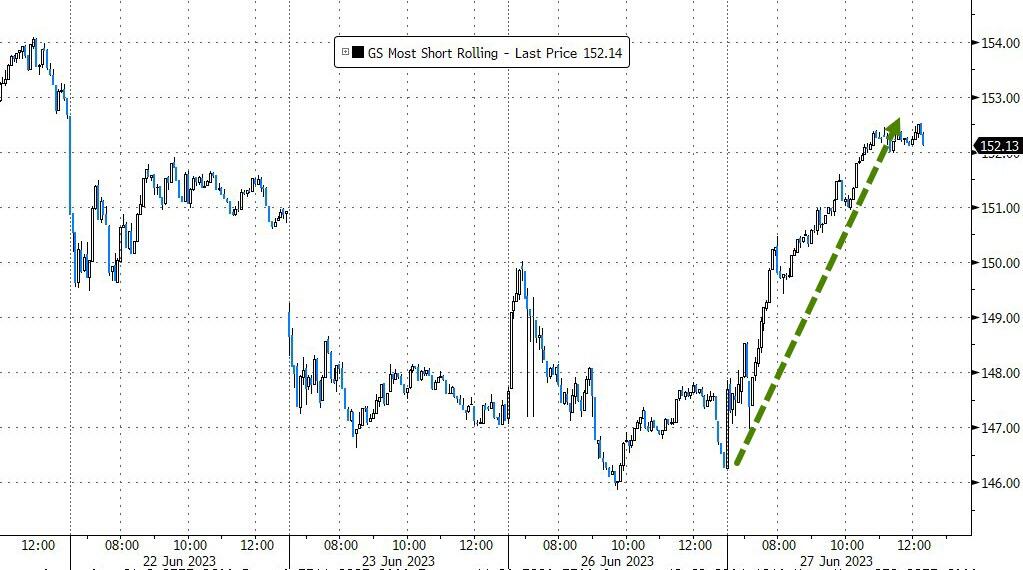
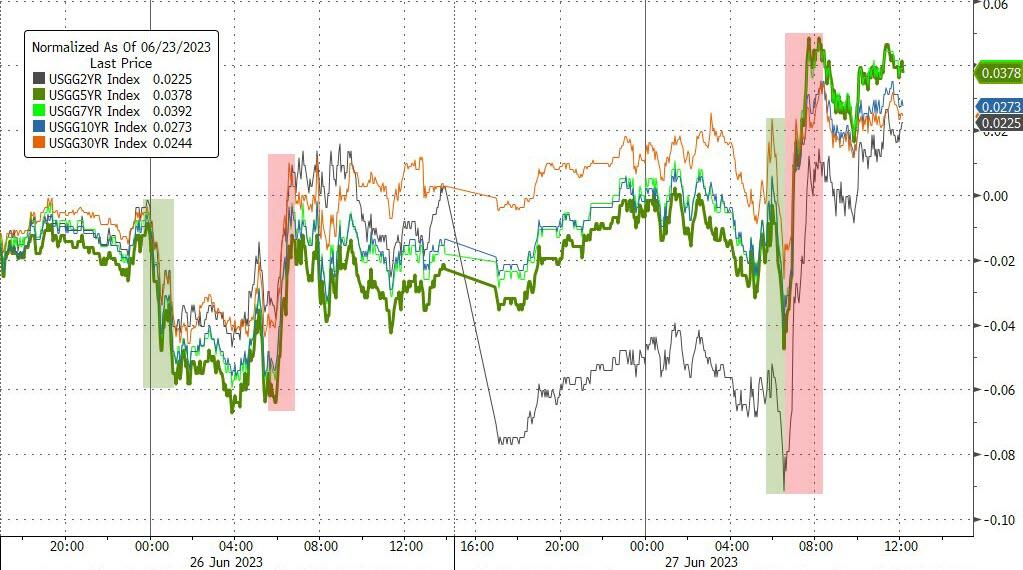
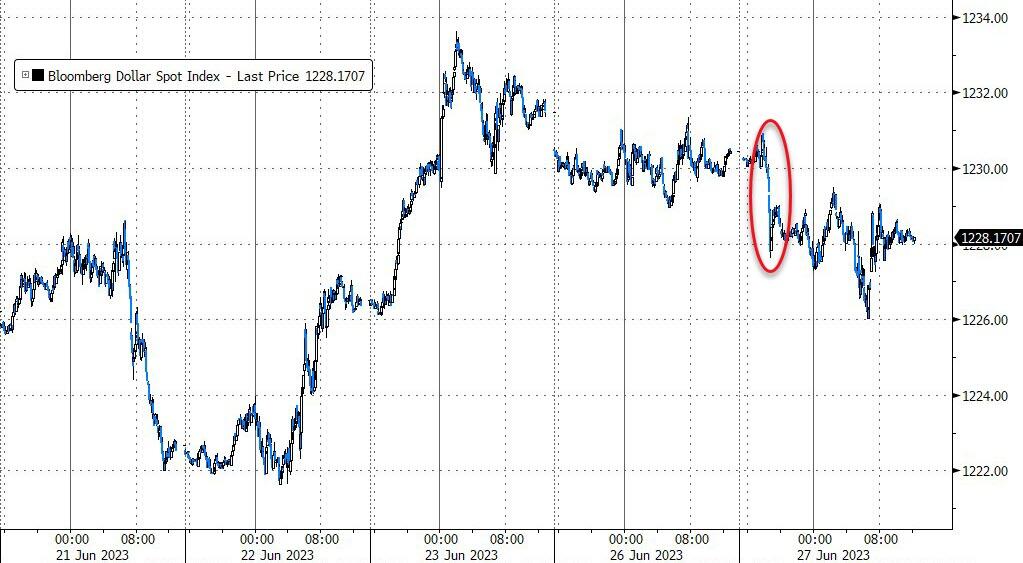
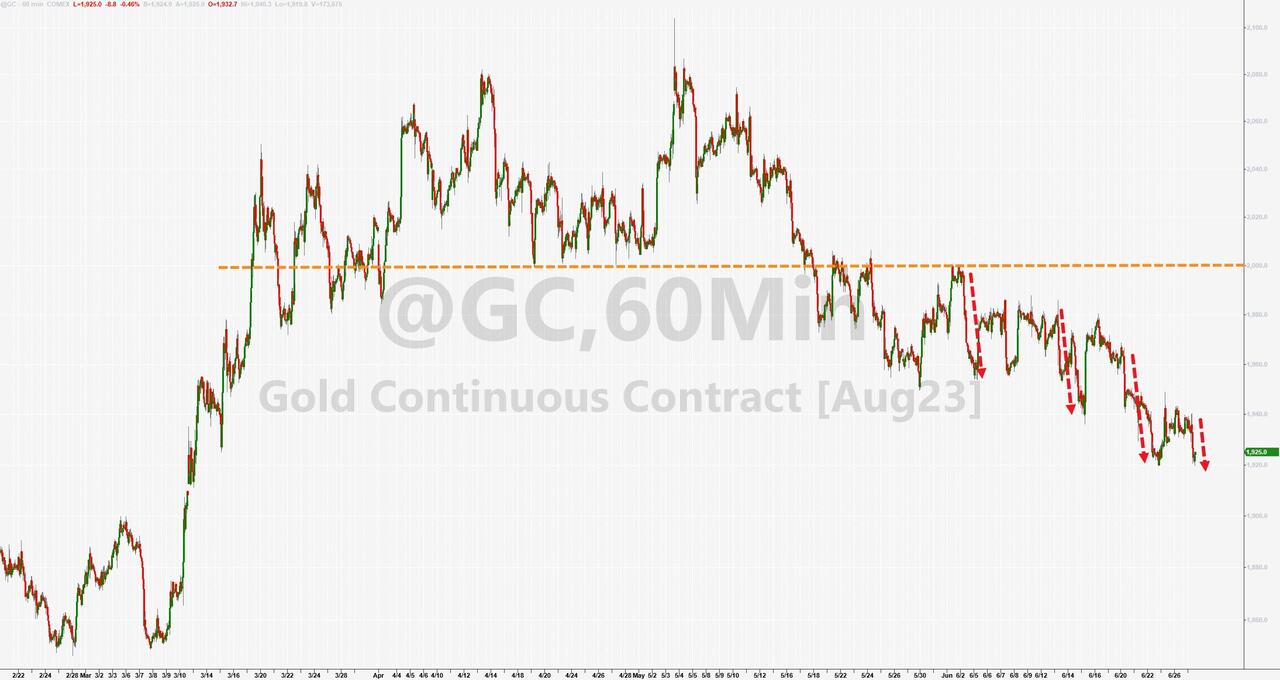
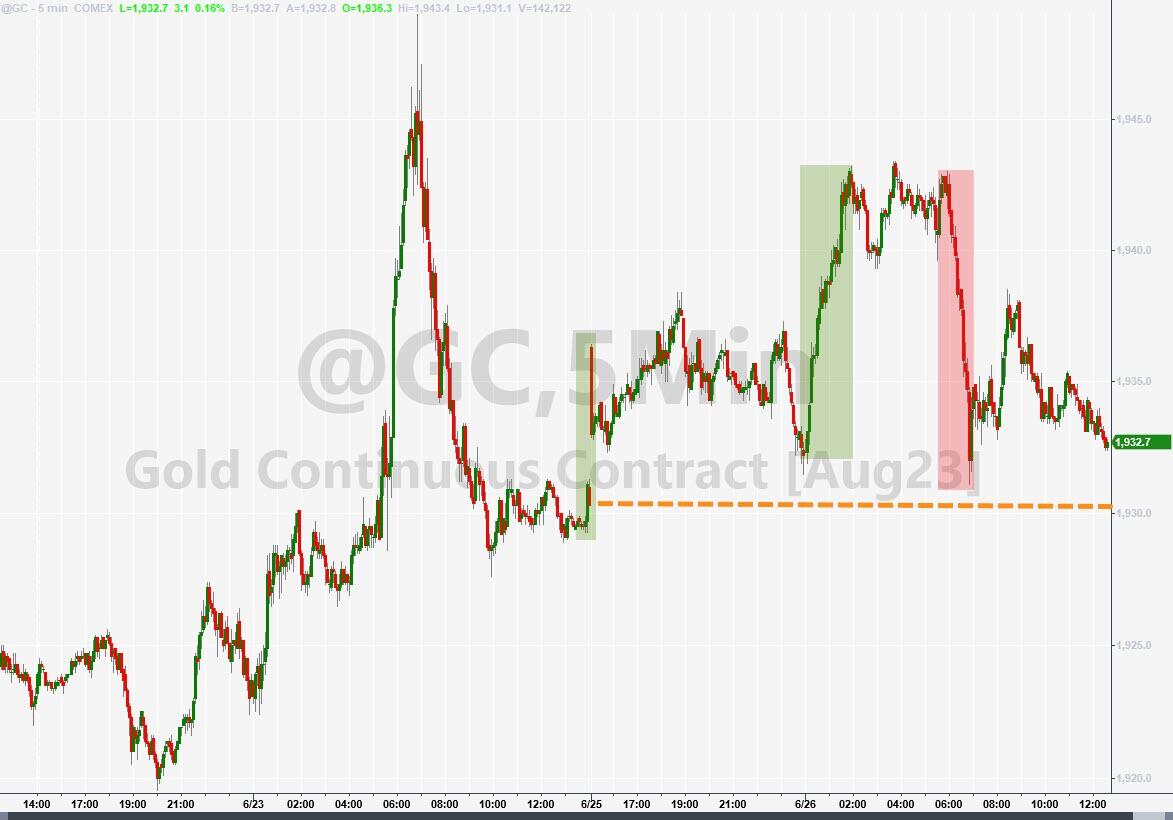
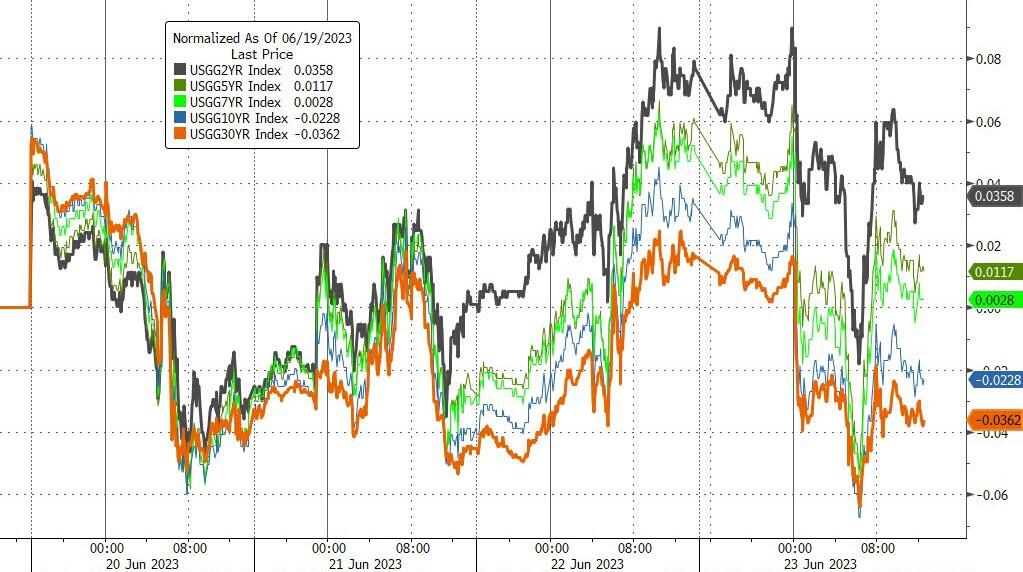
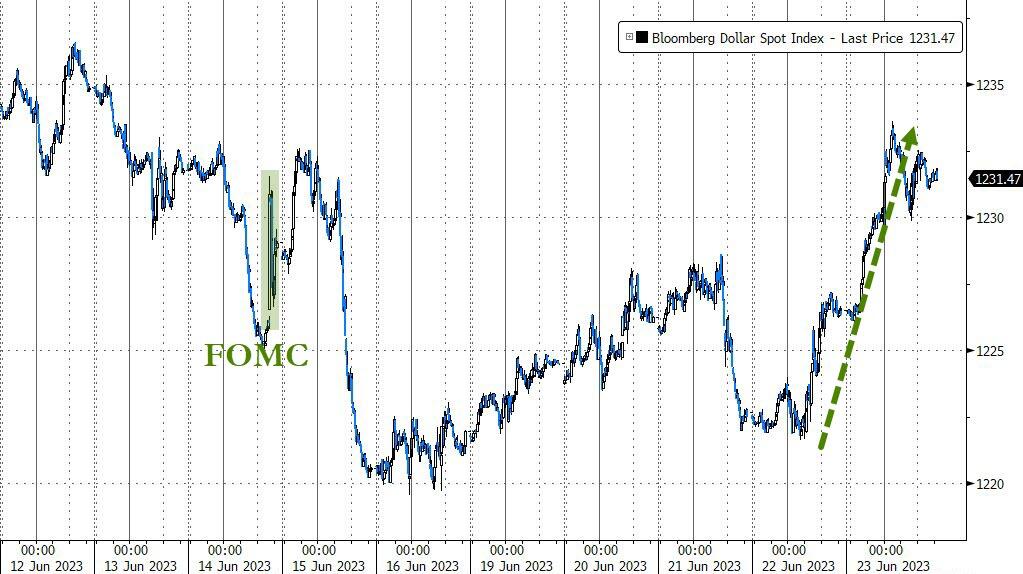
The upbeat data also triggered a short squeeze, as bond yields jumped higher. The dollar, however, weakened, while gold fell to its lowest level in three months.

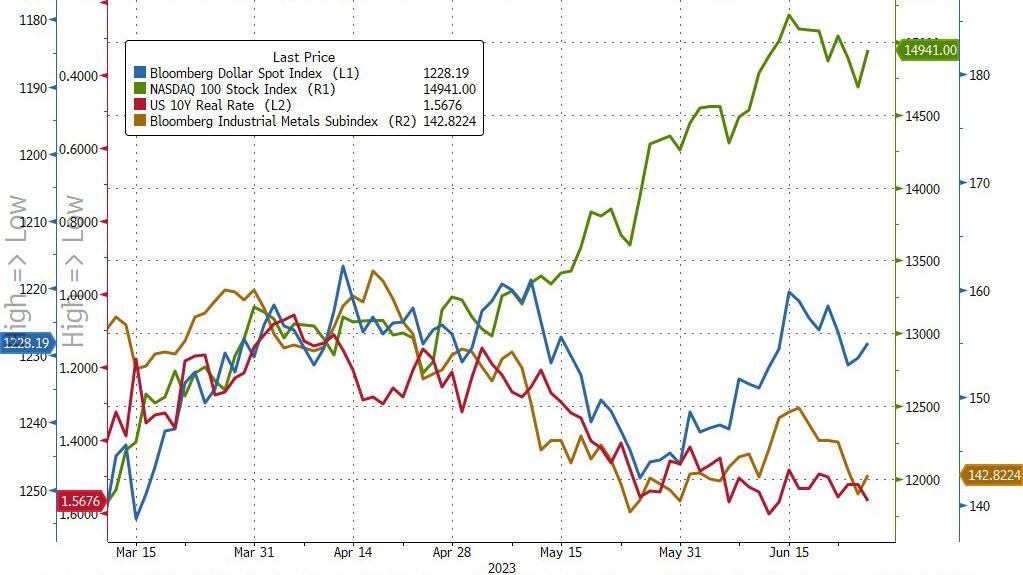
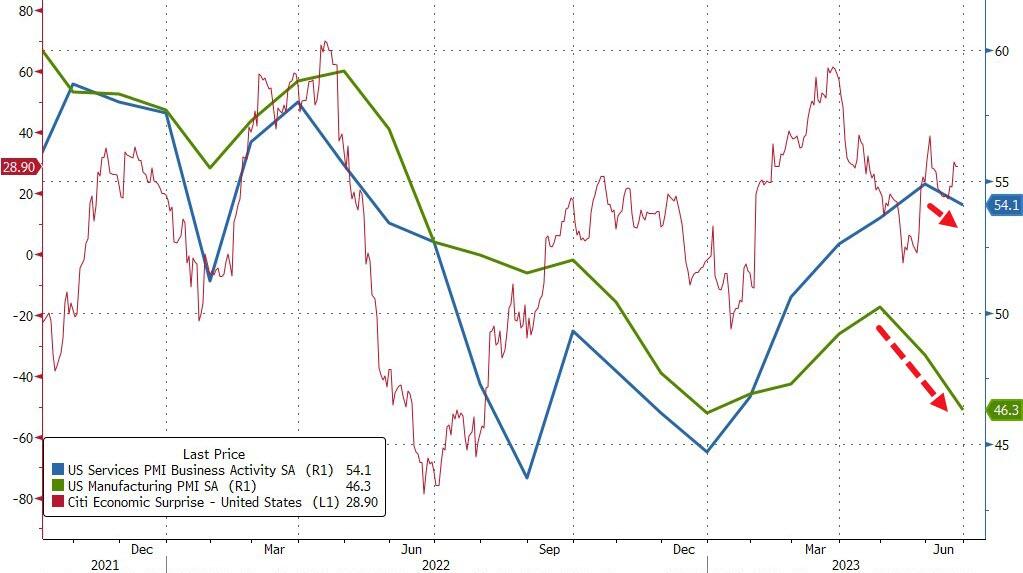
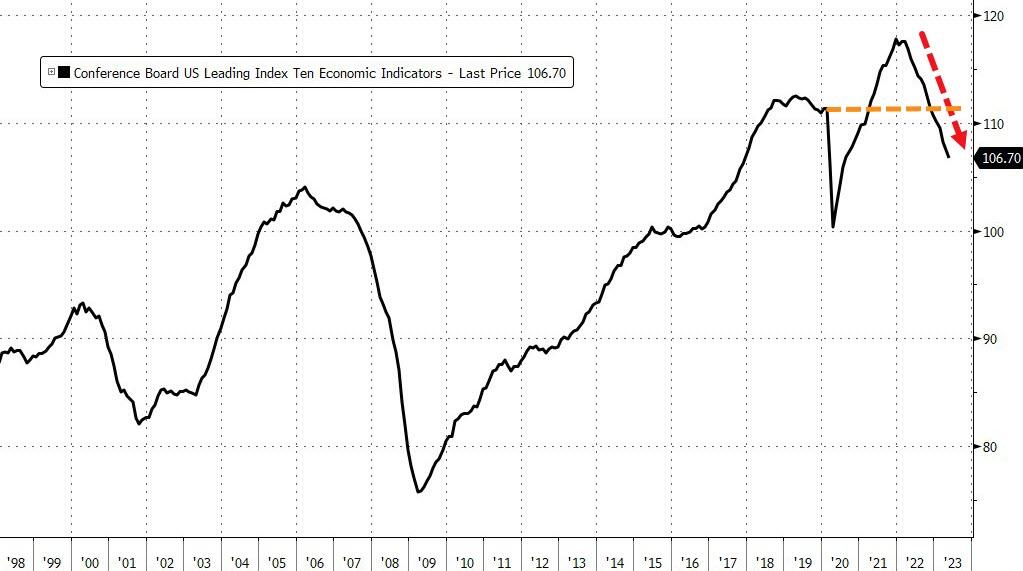
The big question is: how long can stocks keep defying economic reality? This chart shows how out of sync they are with the rest of the data. I expect them to come back down to earth in the next quarter.

Read More
Tech Sector Loses Steam As Market Drifts Lower

Ulli Market Commentary Contact

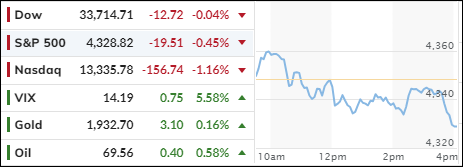
[Chart courtesy of MarketWatch.com]

  1. Moving the markets

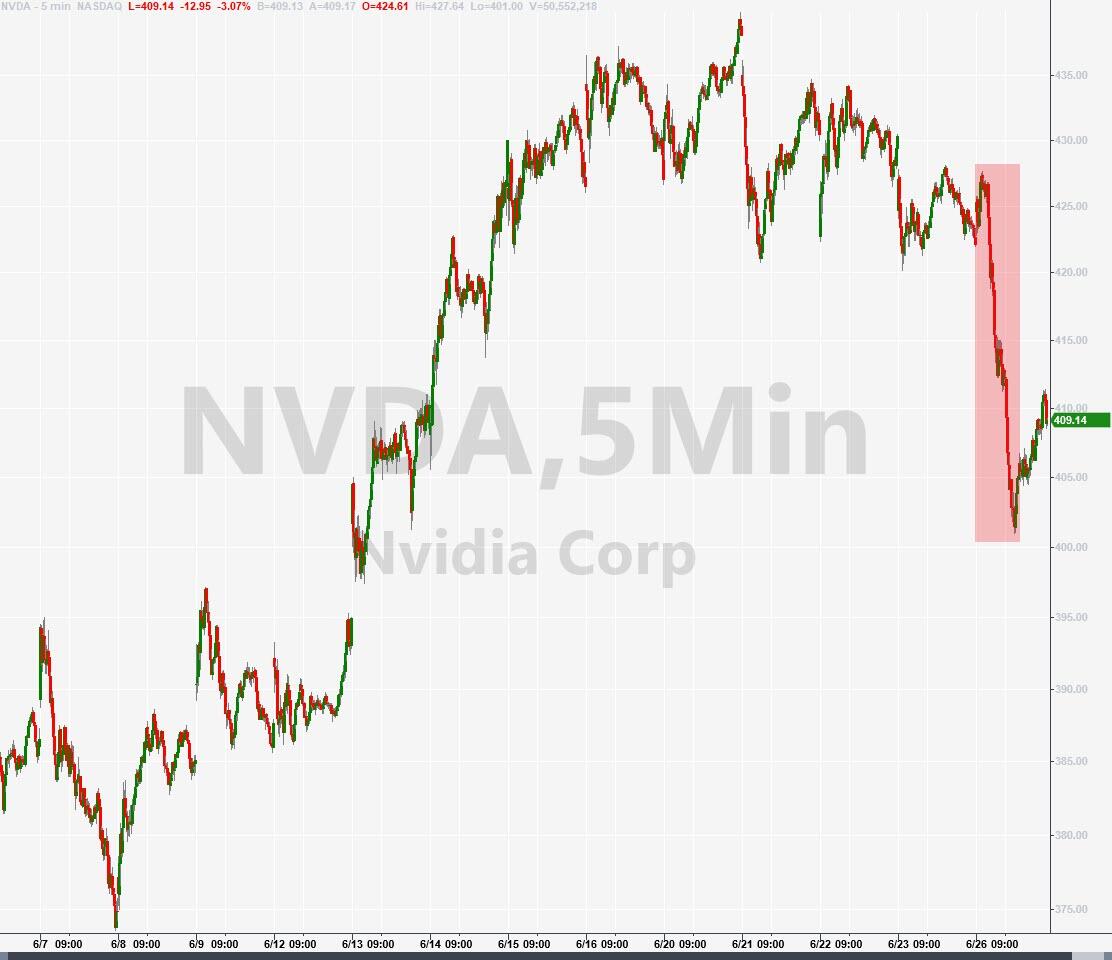
The bulls are still on vacation as the market continues to drift lower. The major indexes barely moved today but ended up in the red zone again. The Nasdaq suffered the most, as tech stocks lost their mojo.

Interestingly, the S&P 500, which had been driven by a handful of big tech names, showed a different pattern today. While the SPY dropped 0.33%, its equally weighted counterpart rose 0.65%. This means that the broader market is holding up better than the tech sector, which is losing steam. This trend started last week and could signal a shift in market leadership.

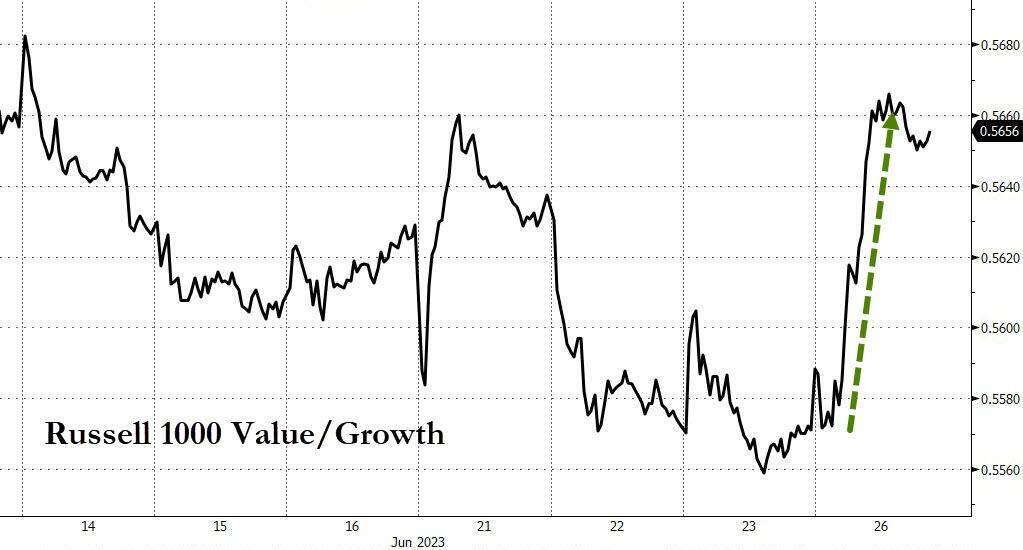
Another sign of change is the reversal in the growth vs. value battle. After being trounced by growth for a few days, value funds bounced back today and erased their losses. Check out this chart to see the dramatic turnaround.

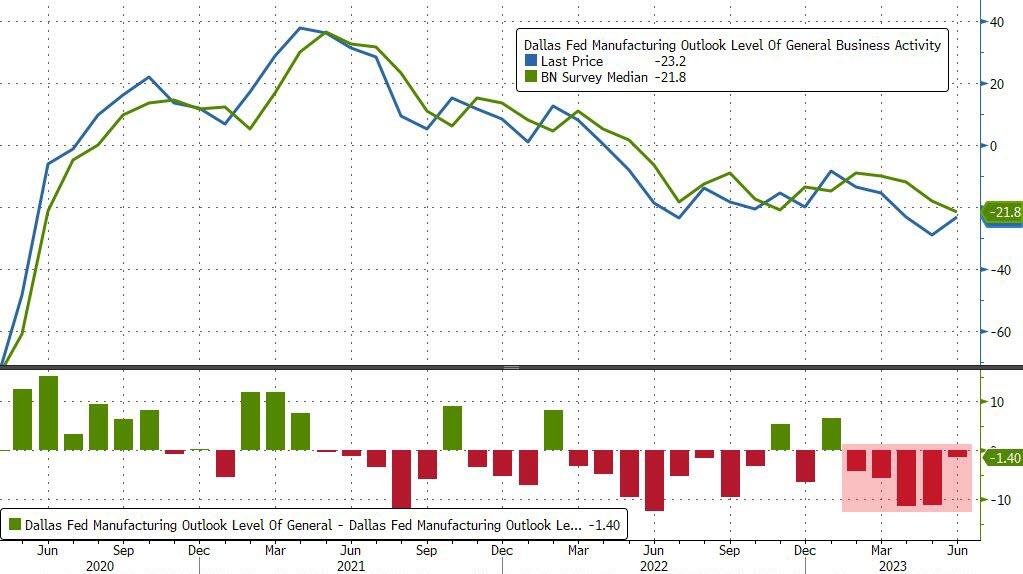
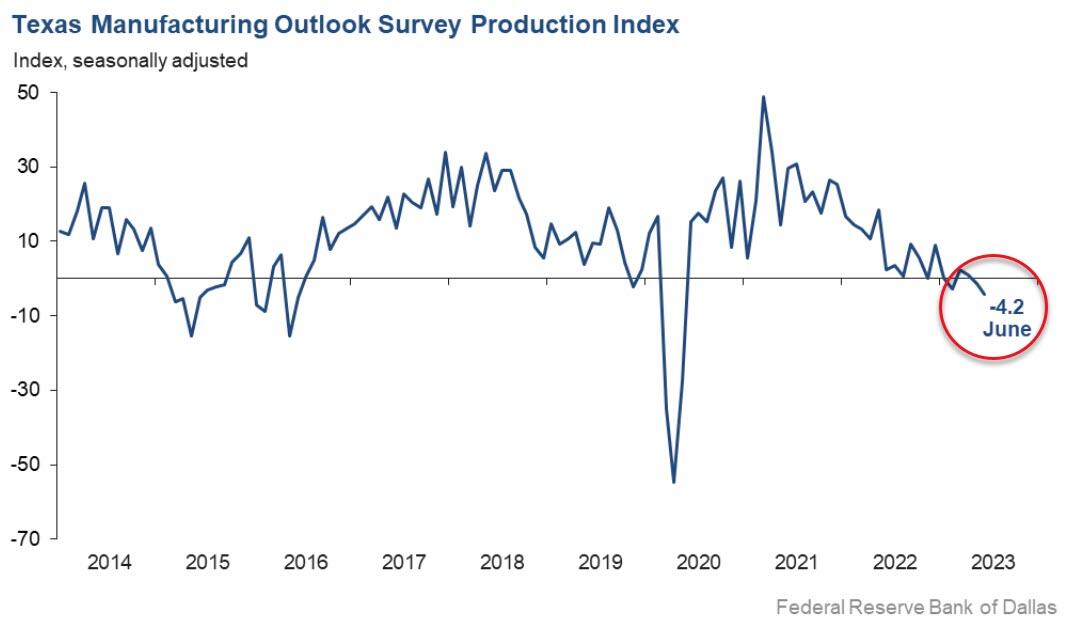
On the economic front, we got some bad news from Texas. The Texas Manufacturing Survey plunged for the fifth month in a row, coming in at -23.2 vs. -21.8 expected. Even worse, the outlook turned negative for the first time since 2016, dropping to -4.2.

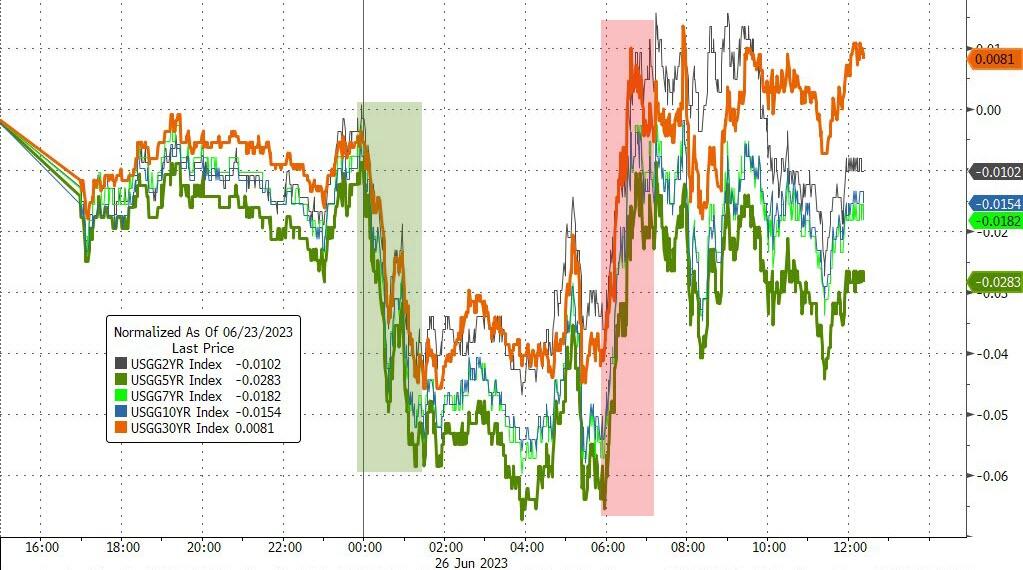
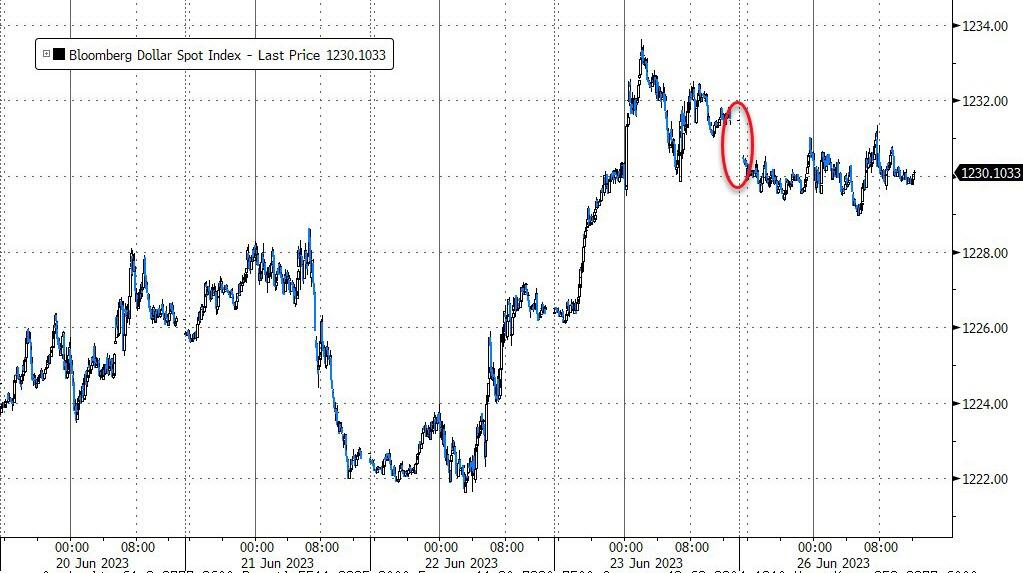
Bond yields were mixed, the dollar was flat, and gold edged higher. As we wrap up June, we have some important data points to watch this week. The most crucial one is the PCE (Personal Consumption Index), which is the Fed’s favorite inflation gauge. This could affect their decision on how many rate hikes they will deliver this year.

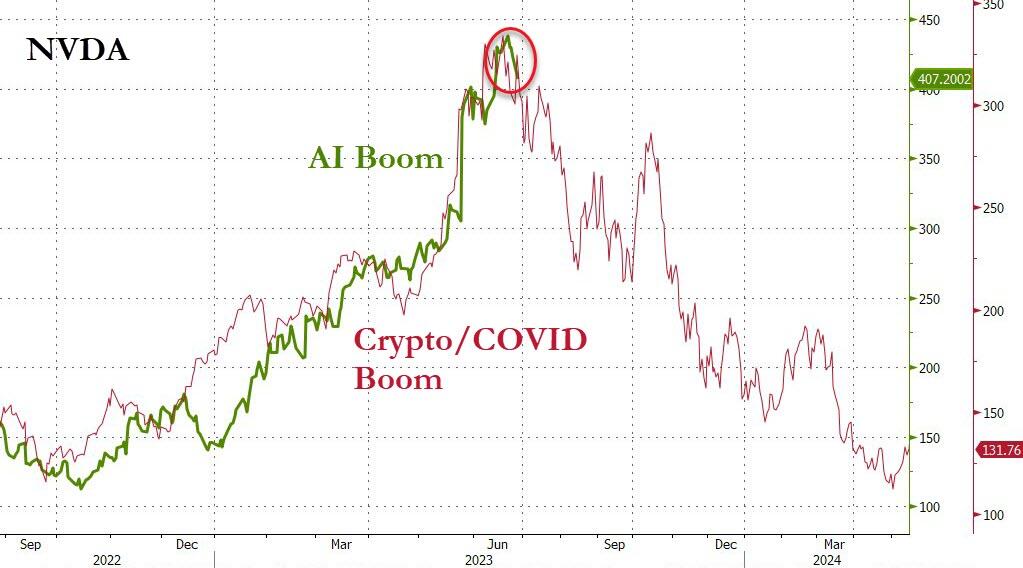
But the market seems to have a different view. It’s betting that the Fed will cave and start cutting rates soon. I’m not convinced, and I think the market is too complacent. Especially when you consider the possibility of an AI bust, as this chart from ZeroHedge shows. History suggests that every boom ends with a bust, and AI could be no exception.

Read More
ETFs On The Cutline – Updated Through 06/16/2023

Ulli ETFs on the Cutline Contact

Do you want to know which ETFs are hot and which ones are not? Then you need my High-Volume ETF Cutline report. It tells you how close or far each of the 311 ETFs I follow is from its long-term trend line (39-week SMA). These are the ETFs that trade more than $5 million a day, so they are not some obscure funds that nobody cares about.

The report is split into two parts: The winners that are above their trend line (%M/A), and the losers that are below it. The yellow line is the line of shame that separates them. You can see how many ETFs are in each group and how they have changed since the last report (221 vs. 177 current).

Take a peek:

The HV ETF Master Cutline Report

If you are confused by some of the terms we use, don’t panic. I have a helpful Glossary of Terms for you.

If you want to learn more about the Cutline method and how it can make you rich (or at least less poor), read my original post here.

ETF Tracker Newsletter For June 23, 2023

Ulli ETF Tracker Contact

ETF Tracker StatSheet          

You can view the latest version here.

BEARS MAUL BULLS AS INFLATION AND RECESSION FEARS MOUNT

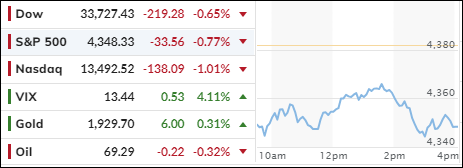
[Chart courtesy of MarketWatch.com]

  1. Moving the markets

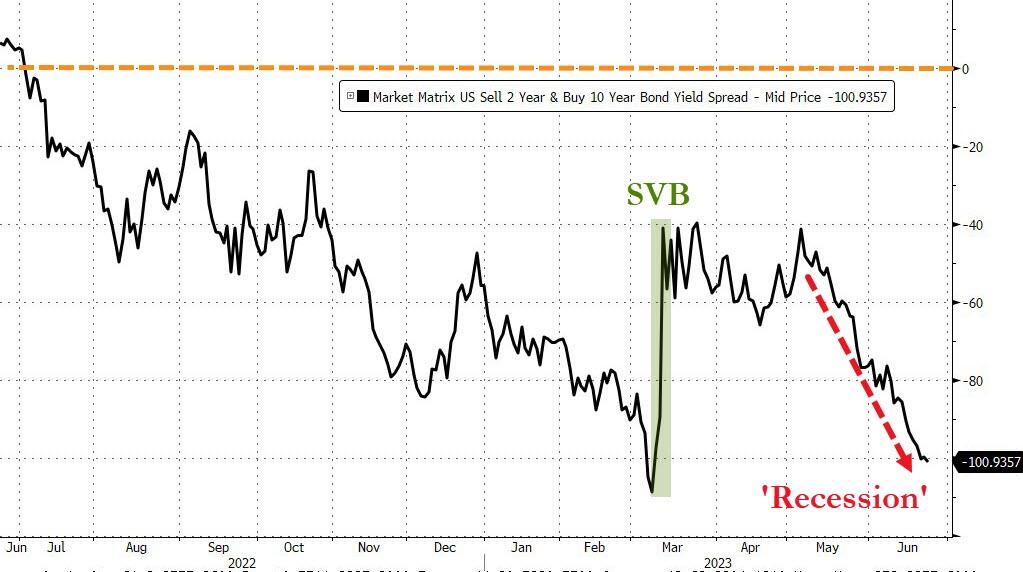
The bulls took a break this week as the bears came out to play. The main indexes snapped their winning streak as inflation fears, Fed tightening, and recession worries spooked the traders. The yield curve inverted again, signaling trouble ahead for the economy.

The bad news started overseas, where European PMI numbers showed a slowdown in manufacturing and services. The US PMI followed suit, dragging down the futures markets.

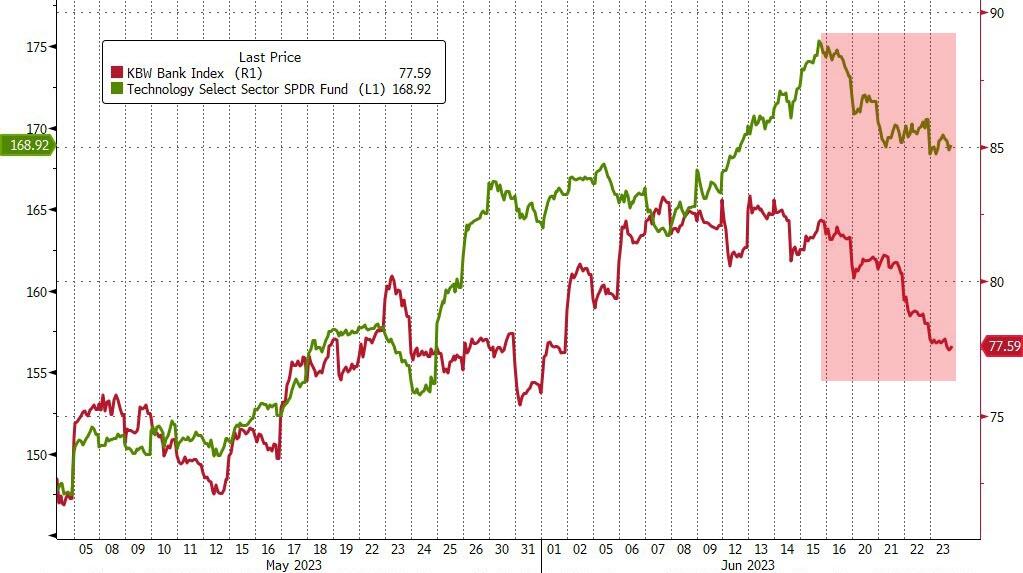
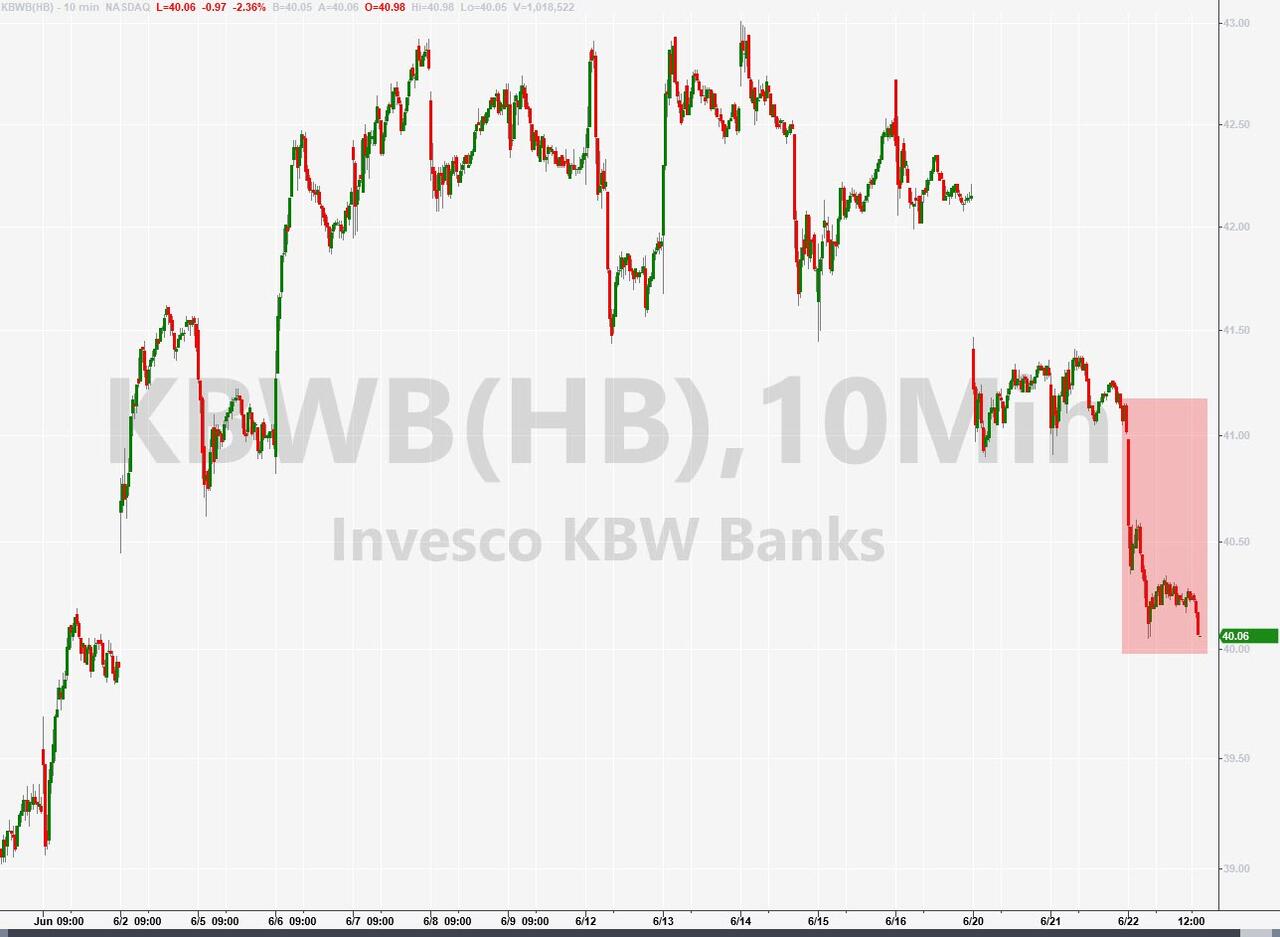
The sell-off was widespread, with almost all S&P 500 stocks in the red. This was a stark contrast to the recent rally, which was fueled by a handful of big tech stocks. Regional banks tried to bounce back but failed miserably. The Regional Banking ETF KRE plunged more than 8% this week, while the Nasdaq and Small Caps suffered their worst weekly loss since March.

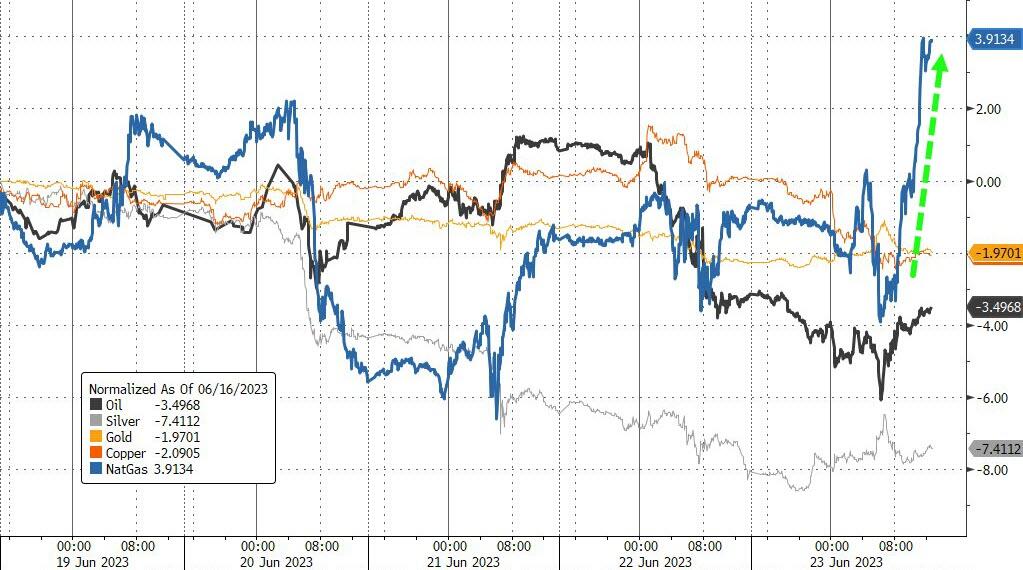
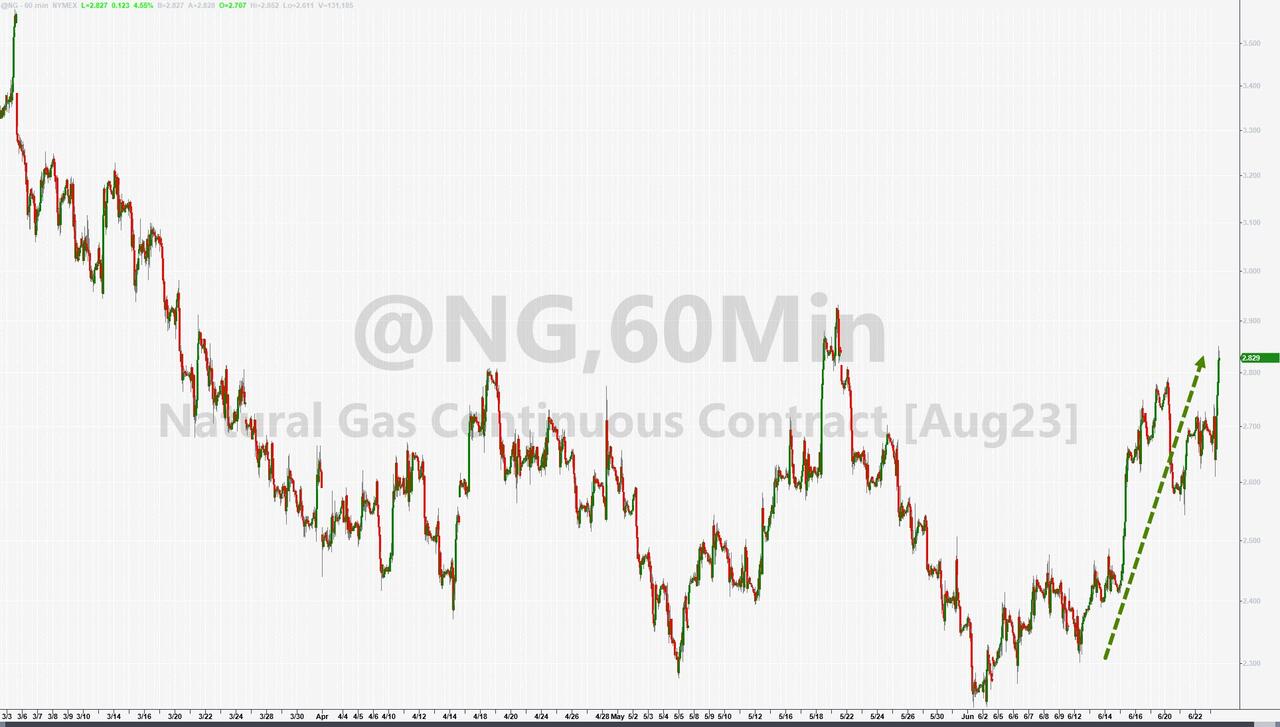
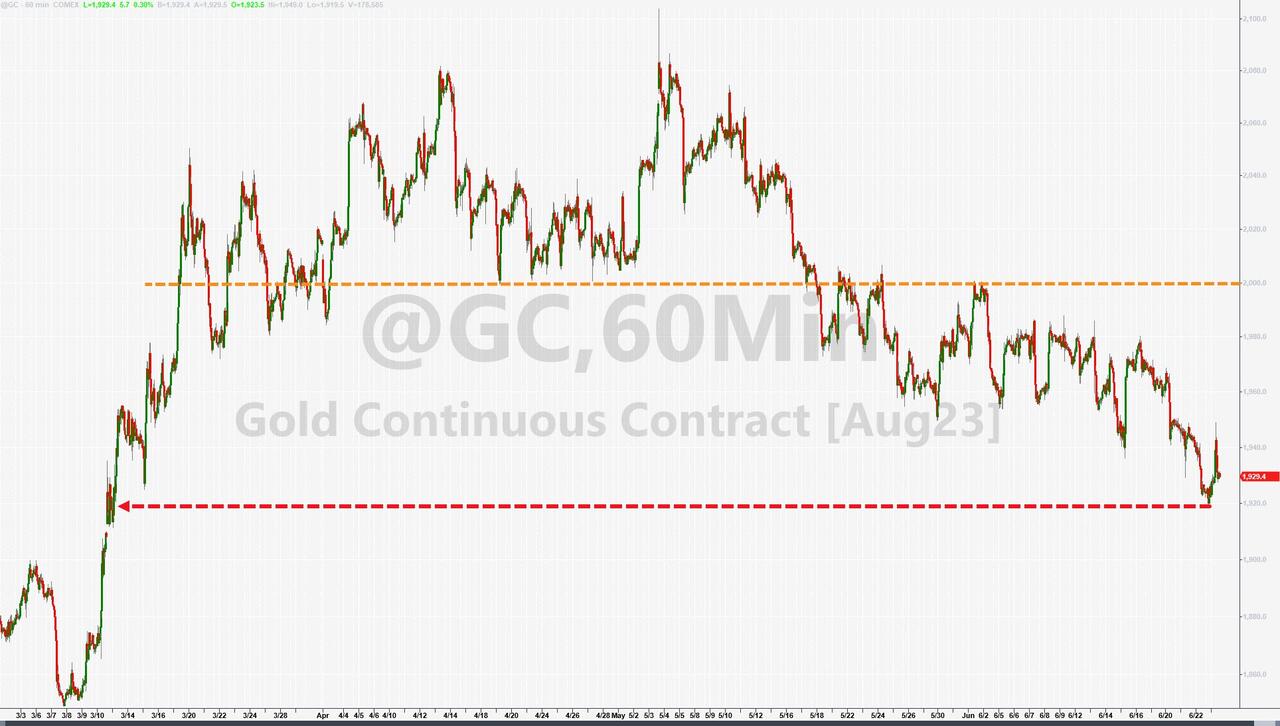
Big tech and banks moved in tandem, both ending the week lower for the first time in seven weeks. Bond yields were mixed, the Dollar rose, while commodities mostly fell on growth concerns. Natural Gas was an exception, surging higher. Gold recovered today but still languishes at 3-month lows.

The Fed holds the key to the market’s next move. But don’t expect any easy answers from them. They face a tough dilemma:

Either raise rates to fight inflation and risk crashing the economy and markets or print more money and devalue the currency in your wallet.

What will they do?

My guess is they will choose the latter when push comes to shove. Because who doesn’t love some free money?

Read More
Weekly StatSheet For The ETF Tracker Newsletter – Updated Through 06/22/2023

Ulli ETF Tracker Contact

ETF Data updated through Thursday, June 22, 2023

How to use this StatSheet:

  1. Out of the 1,800+ ETFs out there, I only pick the ones that trade over $5 million per day (HV ETFs), so you don’t get stuck with a lemon that nobody wants to buy or sell.
  1. Trend Tracking Indexes (TTIs)

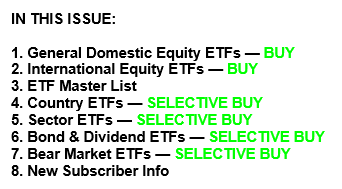
These are the main indicators that tell you when to buy or sell Domestic and International ETFs (section 1 and 2). They do that by comparing their position to their long-term M/A (Moving Average). If they cross above, and stay there, it’s a green light to buy. If they fall below, and keep going, it’s a red light to sell. And to make sure you don’t lose your shirt if things go south, I also use a 12% trailing stop loss on all positions in these categories.

  1. All other investment areas don’t have a TTI and should be traded based on the position of each ETF relative to its own trend line (%M/A). That’s why I call them “Selective Buy.” In other words, if an ETF goes above its own trend line, you can buy it. But don’t forget to use a trailing sell stop of 12%, or less if you’re feeling nervous.

If some of these words sound like Greek to you, please check out the Glossary of Terms and new subscriber information in section 9.

  1. DOMESTIC EQUITY ETFs: BUY— since 12/01/2022

Click on chart to enlarge

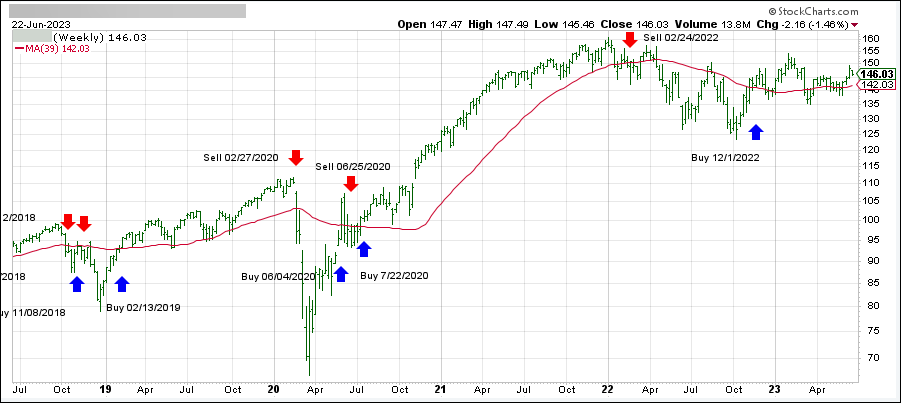
This is our main compass, the Domestic Trend Tracking Index (TTI-green line in the above chart). It has now broken above its long-term trend line (red) by +2.69% and remains in “Buy” mode.

Read More
How A Cartoon Explains The Crazy Stock Market

Ulli Market Commentary Contact

[Chart courtesy of MarketWatch.com]

  1. Moving the markets

The stock market was a rollercoaster ride yesterday, with the S&P 500 and Nasdaq barely ending in the green after a three-day losing streak. The culprit? Fed chair Powell’s hawkish comments on more rate hikes to tame inflation.
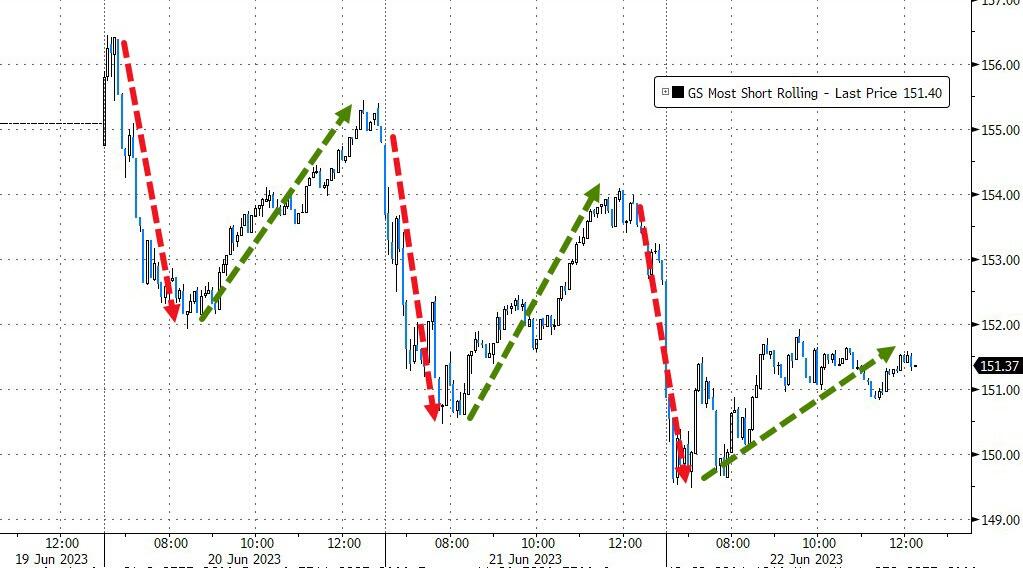
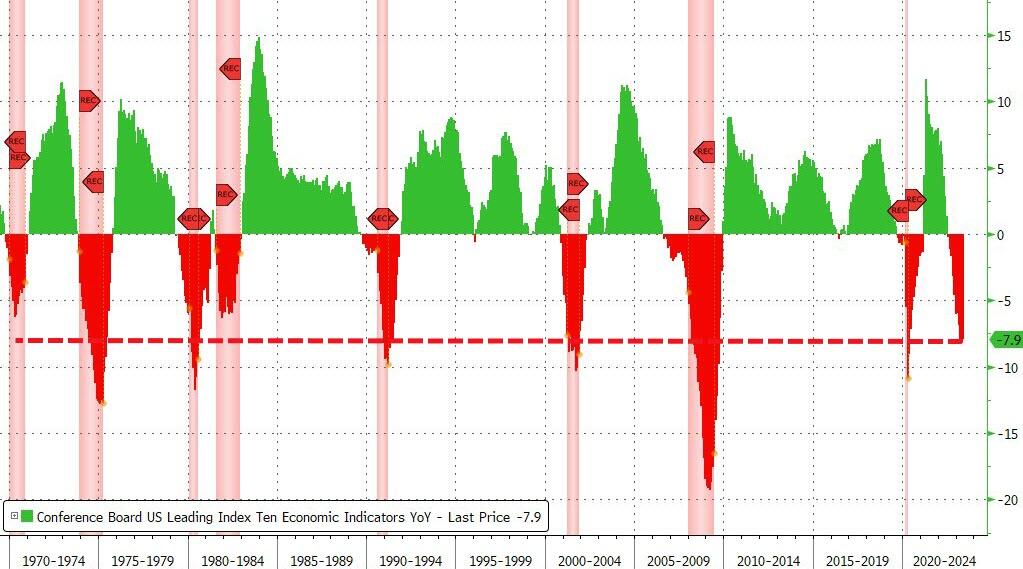
The economic outlook was also gloomy, with the US Leading Economic Indicator (LEI) dropping for the 14th consecutive month, signaling weaker activity ahead. The LEI plunged 7.9% year over year, close to its worst decline since 2008.

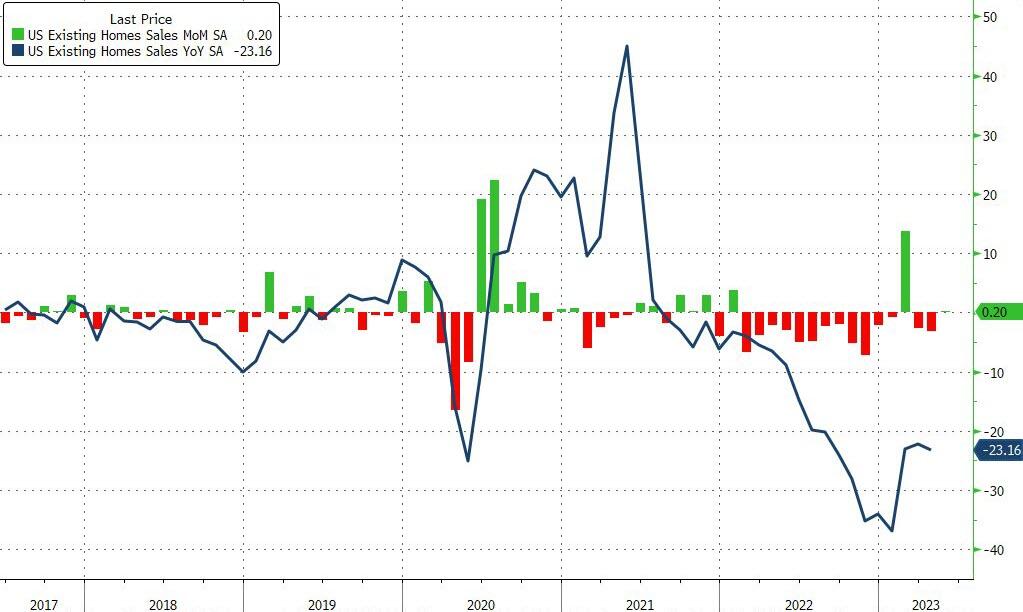
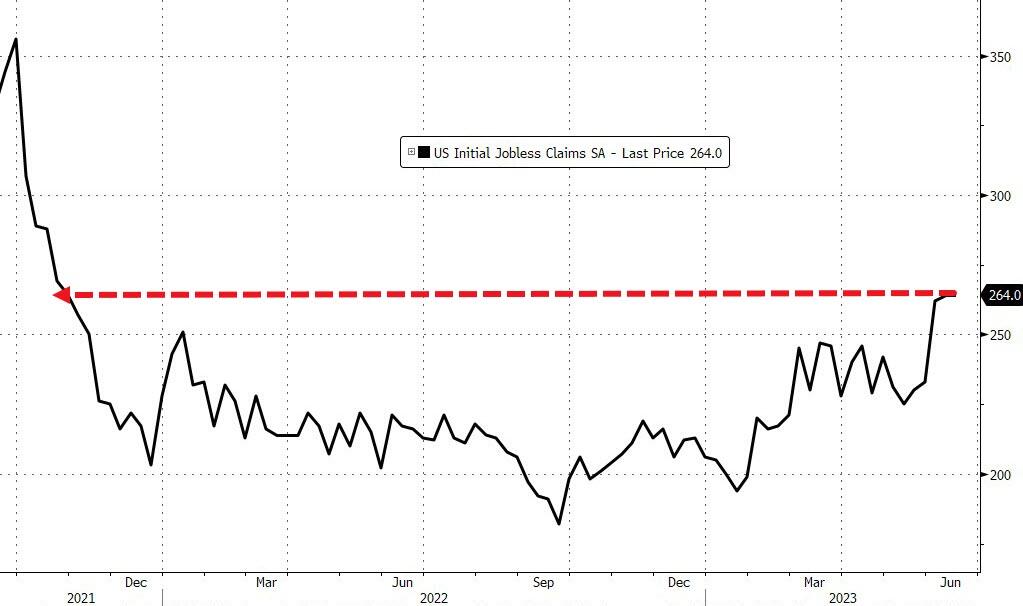
Existing Home Sales edged up 0.2% in May, but prices fell the most since 2011. Meanwhile, initial jobless claims soared to 264k, the highest since October 2021.

Across the pond, the Bank of England (BoE) shocked the markets with a 50-bps rate hike to fight their soaring inflation. Exchequer Jeremy Hunt said that “bringing inflation down is our absolute priority.”

That sounds familiar, doesn’t it? But US traders and algos seem to ignore Powell and keep buying stocks in the hope of lower rates.
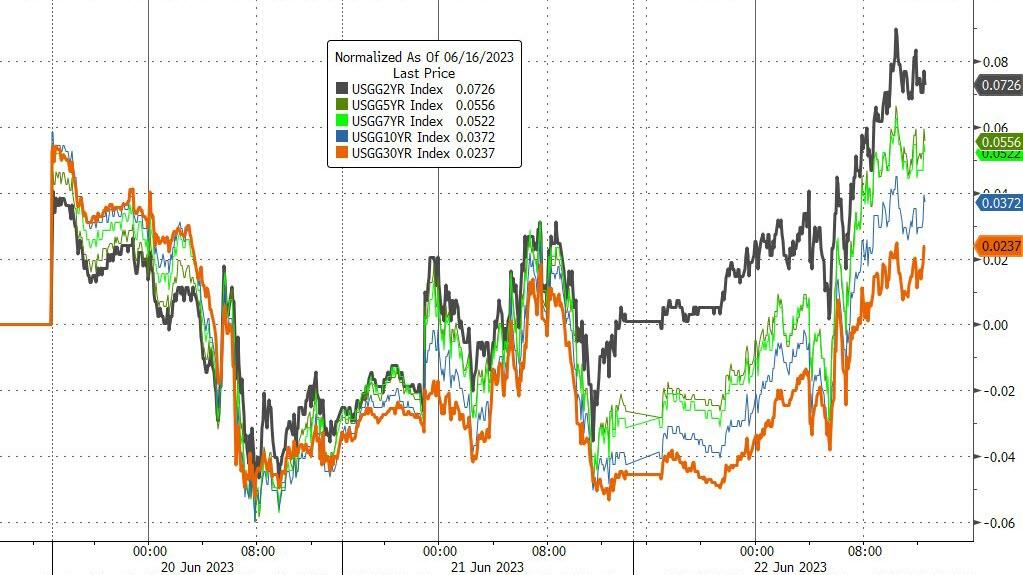
The only thing that saved the day was a short squeeze, which lacked conviction but managed to lift two of the three major indexes into positive territory.

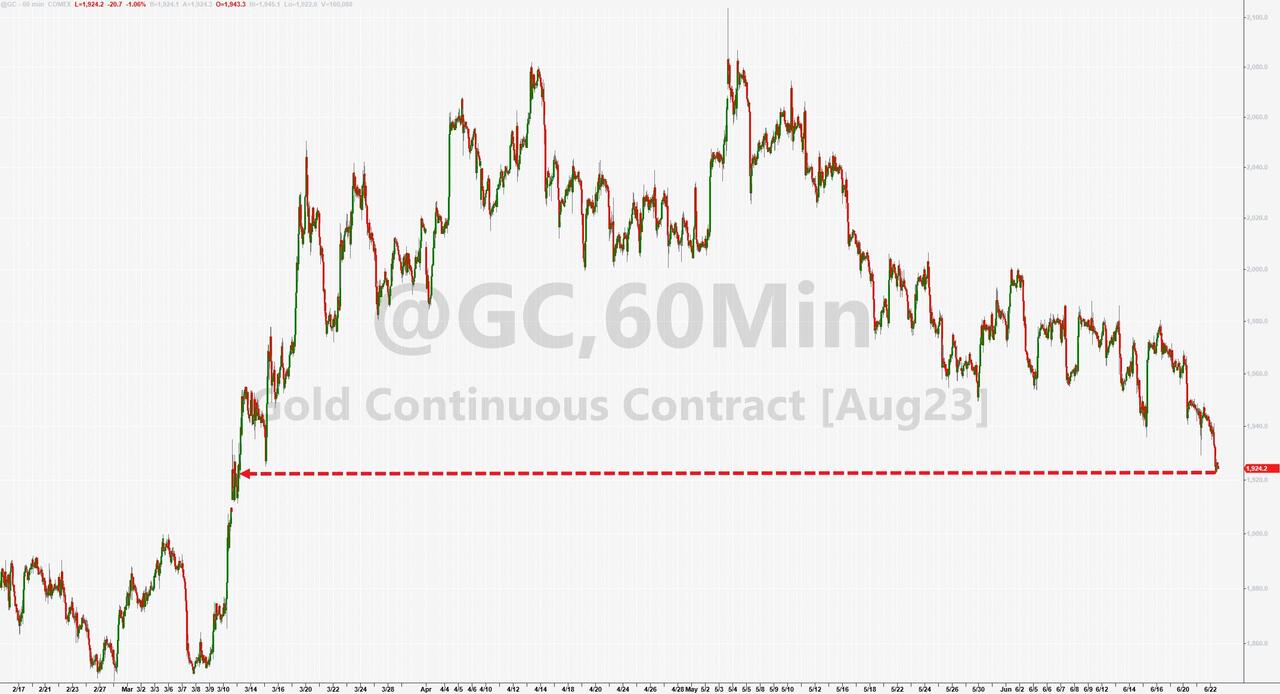
Banks continued to slide, bond yields rose, boosting the dollar and hurting gold, which sank to 3-month lows.

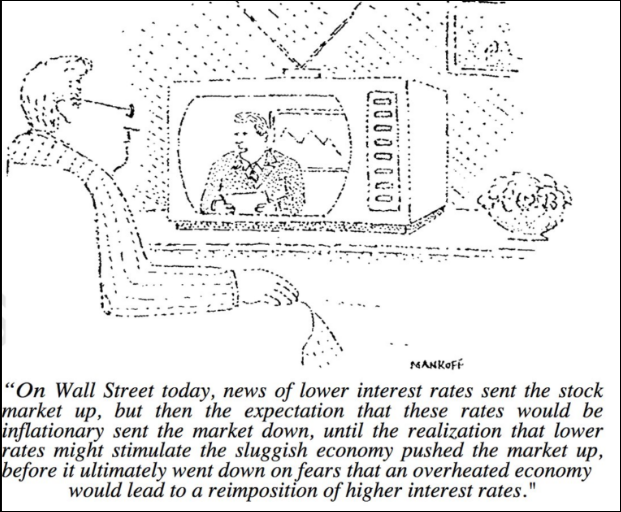
If you’re confused by all this market madness, you’re not alone. Cartoonist Bob Mankoff summed it up for you in this hilarious illustration:

Read More