
- Moving the markets
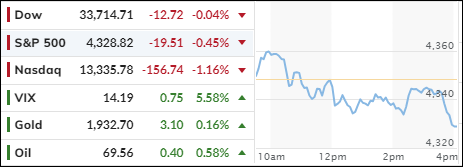
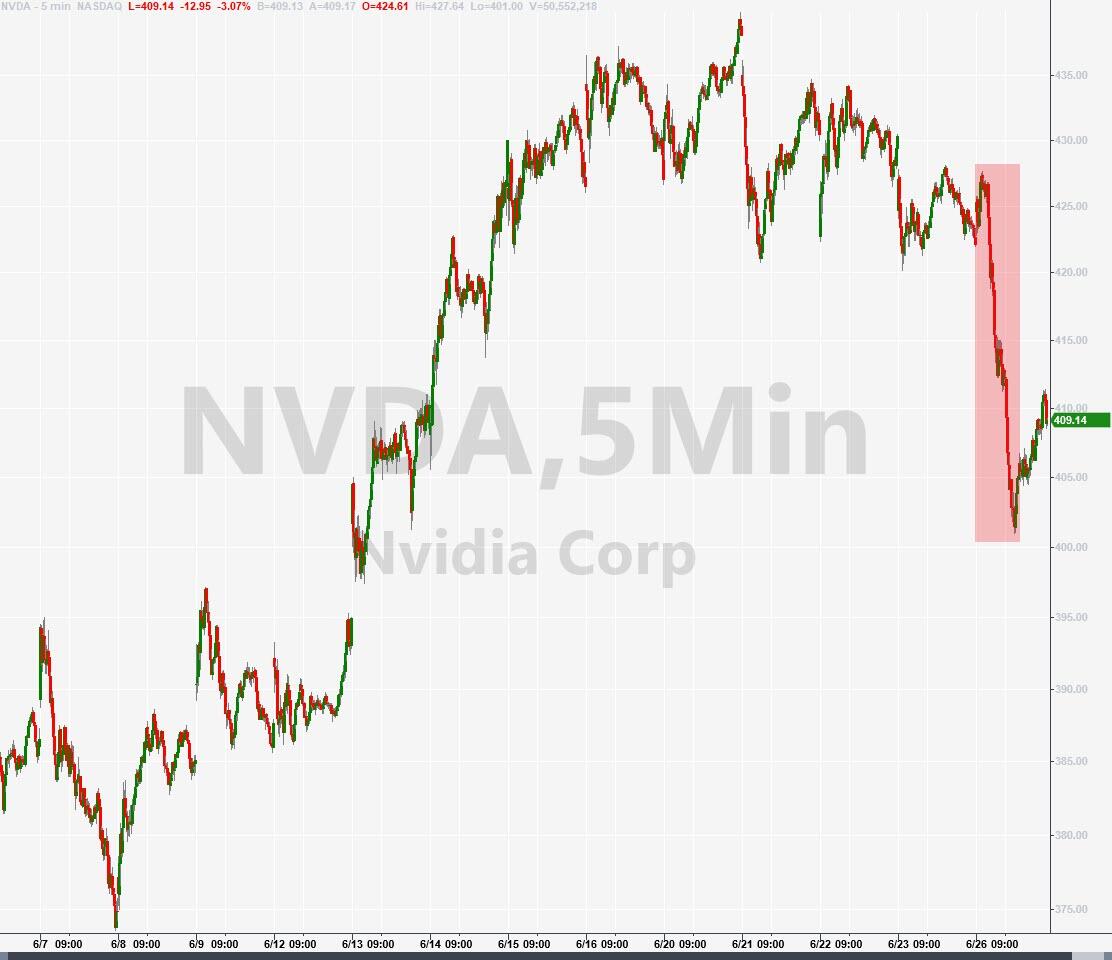
The bulls are still on vacation as the market continues to drift lower. The major indexes barely moved today but ended up in the red zone again. The Nasdaq suffered the most, as tech stocks lost their mojo.
Interestingly, the S&P 500, which had been driven by a handful of big tech names, showed a different pattern today. While the SPY dropped 0.33%, its equally weighted counterpart rose 0.65%. This means that the broader market is holding up better than the tech sector, which is losing steam. This trend started last week and could signal a shift in market leadership.
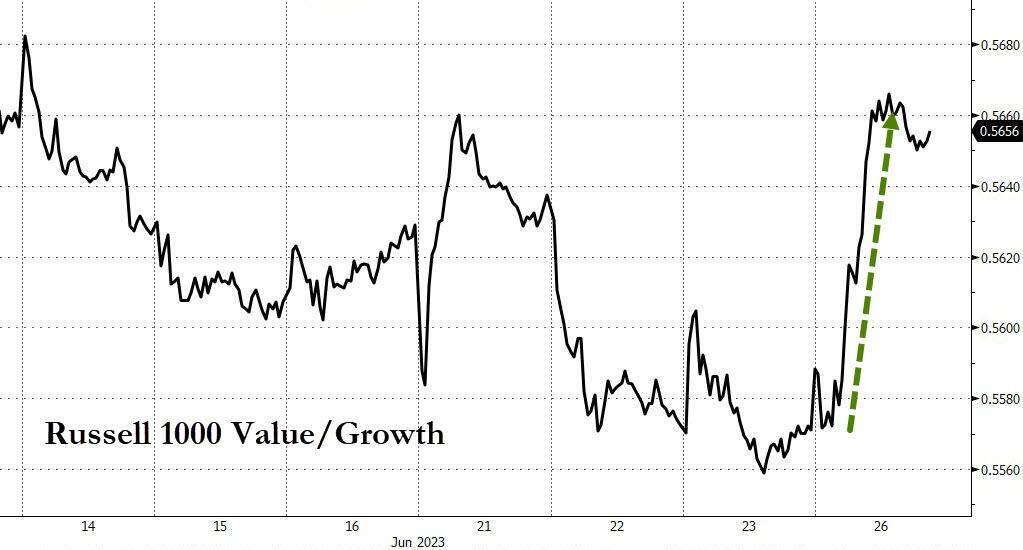
Another sign of change is the reversal in the growth vs. value battle. After being trounced by growth for a few days, value funds bounced back today and erased their losses. Check out this chart to see the dramatic turnaround.
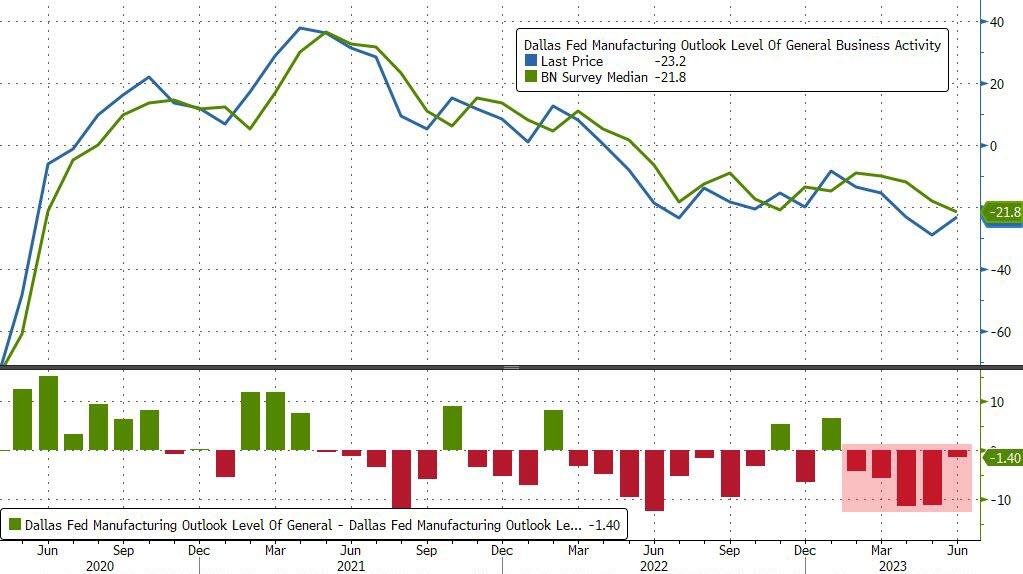
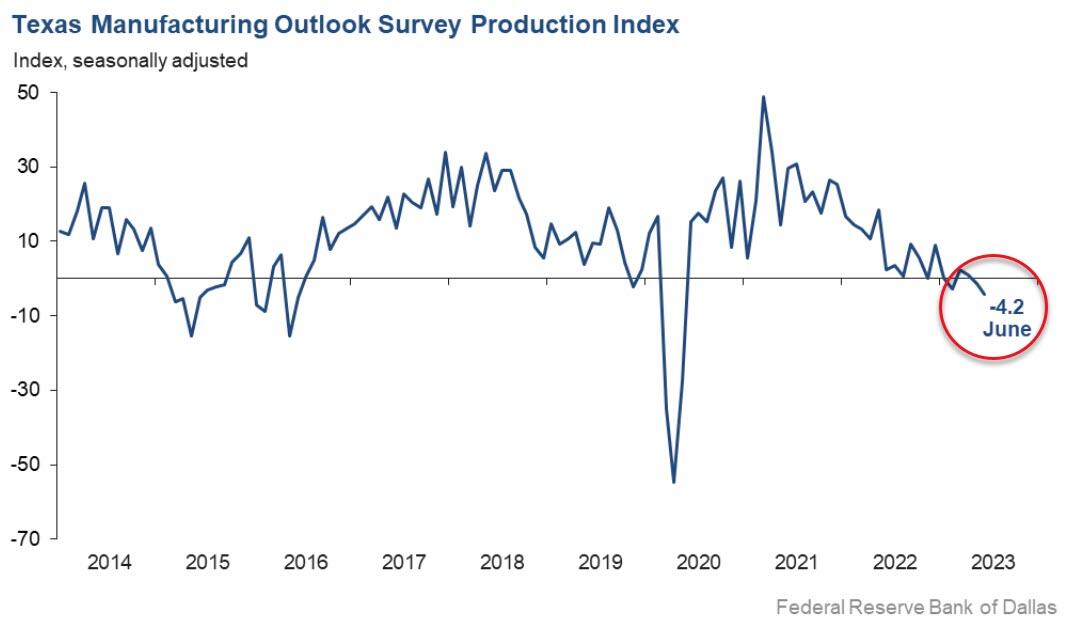
On the economic front, we got some bad news from Texas. The Texas Manufacturing Survey plunged for the fifth month in a row, coming in at -23.2 vs. -21.8 expected. Even worse, the outlook turned negative for the first time since 2016, dropping to -4.2.
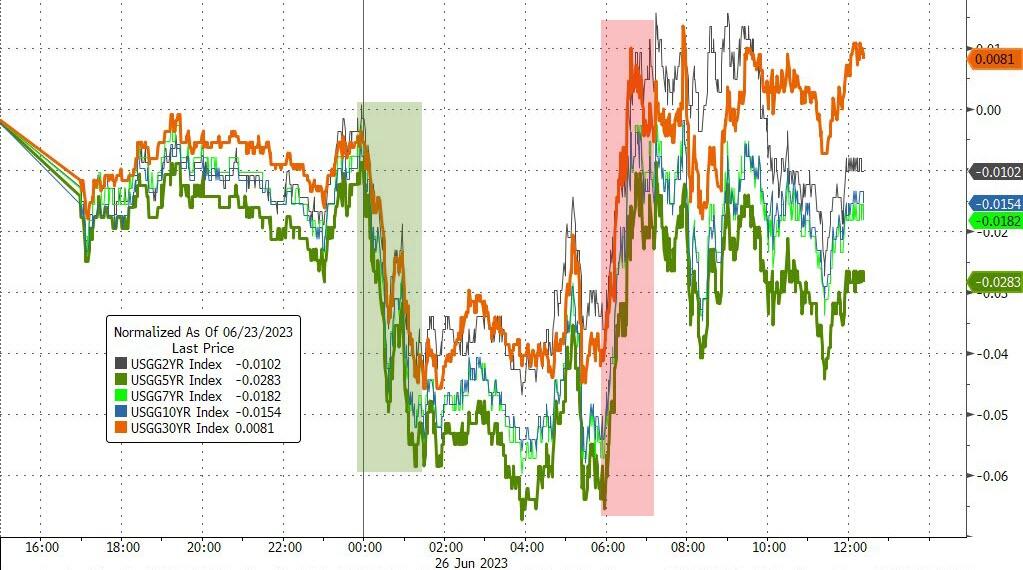
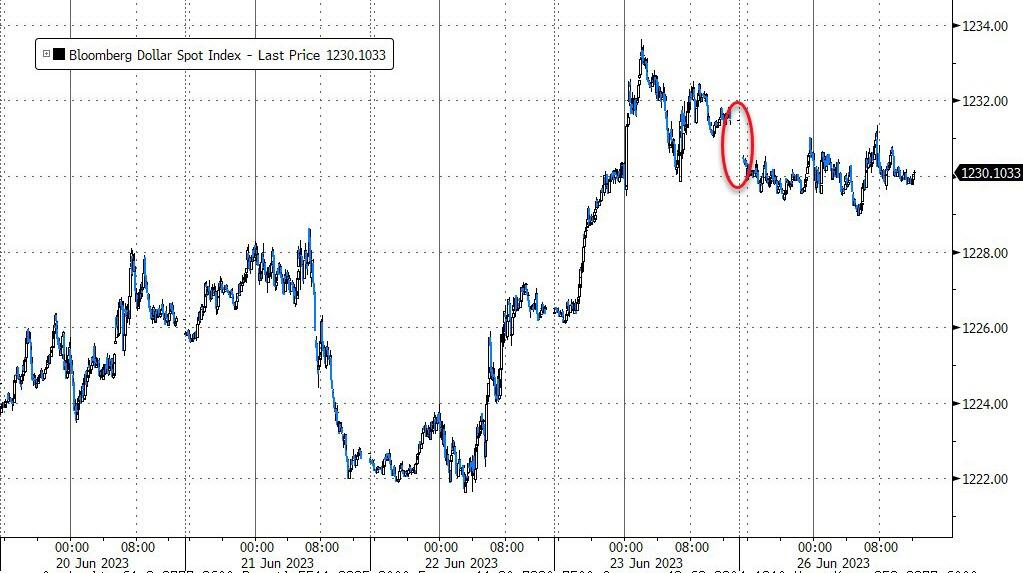
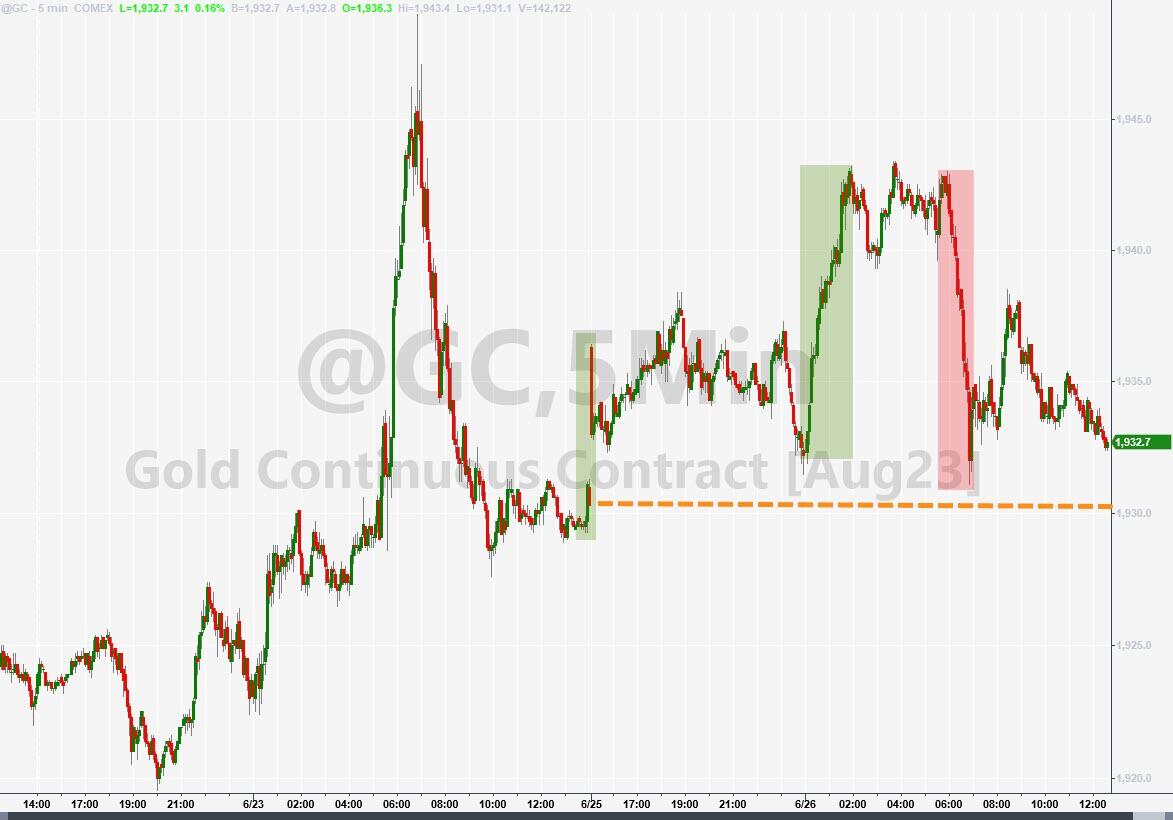
Bond yields were mixed, the dollar was flat, and gold edged higher. As we wrap up June, we have some important data points to watch this week. The most crucial one is the PCE (Personal Consumption Index), which is the Fed’s favorite inflation gauge. This could affect their decision on how many rate hikes they will deliver this year.
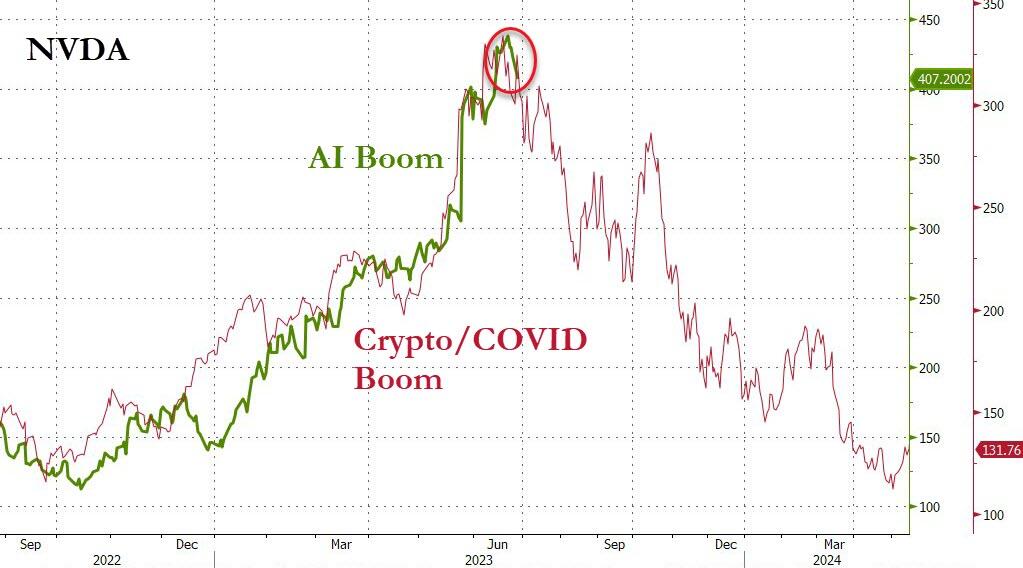
But the market seems to have a different view. It’s betting that the Fed will cave and start cutting rates soon. I’m not convinced, and I think the market is too complacent. Especially when you consider the possibility of an AI bust, as this chart from ZeroHedge shows. History suggests that every boom ends with a bust, and AI could be no exception.
- “Buy” Cycle Suggestions
The current Buy cycle began on 12/1/2022, and I gave you some ETF tips based on my StatSheet back then. But if you joined me later, you might want to check out the latest StatSheet, which I update and post every Thursday at 6:30 pm PST.
You should also think about how much risk you can handle when picking your ETFs. If you are more cautious, you might want to go for the ones in the middle of the M-Index rankings. And if you don’t want to go all in, you can start with a 33% exposure and see how it goes.
We are in a crazy time, with the economy going downhill and some earnings taking a hit. That will eventually drag down stock prices too. So, in my advisor’s practice, we are looking for some value, growth and dividend ETFs that can weather the storm. And of course, gold is always a good friend.
Whatever you invest in, don’t forget to use a trailing sell stop of 8-12% to protect yourself from big losses.
- Trend Tracking Indexes (TTIs)
The market closed lower today, but our TTIs bounced back and moved further into bullish territory. The TTIs are indicators that measure the direction and strength of the market trend. The last week of any quarter is usually positive for stocks, so we’ll see if this pattern holds true this time.
This is how we closed 06/26/2023:
Domestic TTI: +2.57% above its M/A (prior close +1.95%)—Buy signal effective 12/1/2022.
International TTI: +5.72% above its M/A (prior close +5.82%)—Buy signal effective 12/1/2022.
All linked charts above are courtesy of Bloomberg via ZeroHedge.
Contact Ulli