Bond Yields Rise, Dollar Gains, Stocks Struggle

Ulli Market Commentary Contact

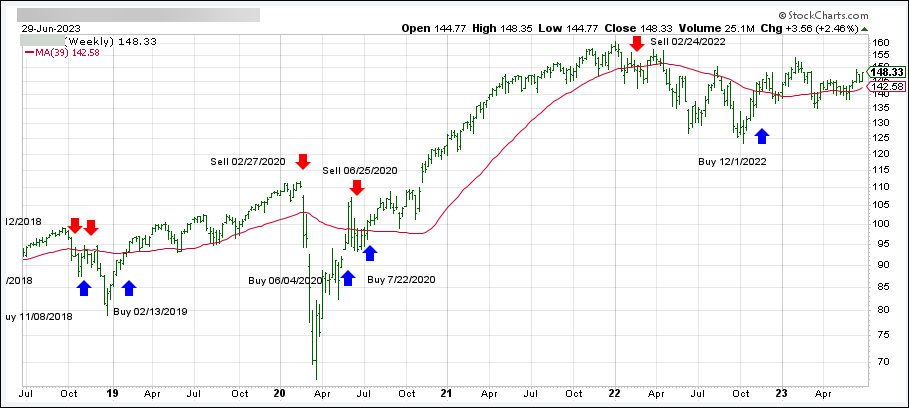
[Chart courtesy of MarketWatch.com]

  1. Moving the markets

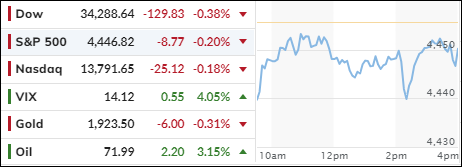
The minutes of the Fed’s June meeting revealed why they decided to hold off on raising interest rates this time. But they also hinted that more hikes are coming in 2023, as they remain confident about the economic recovery.

This made some traders nervous, as they were hoping for lower rates sooner rather than later. They seem to ignore the Fed’s warnings about persistent inflation, which hasn’t even peaked yet. They might be in for a rude awakening when reality hits them hard.

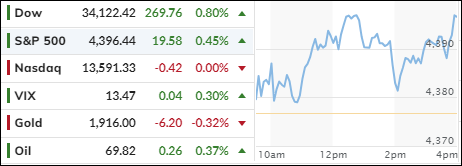
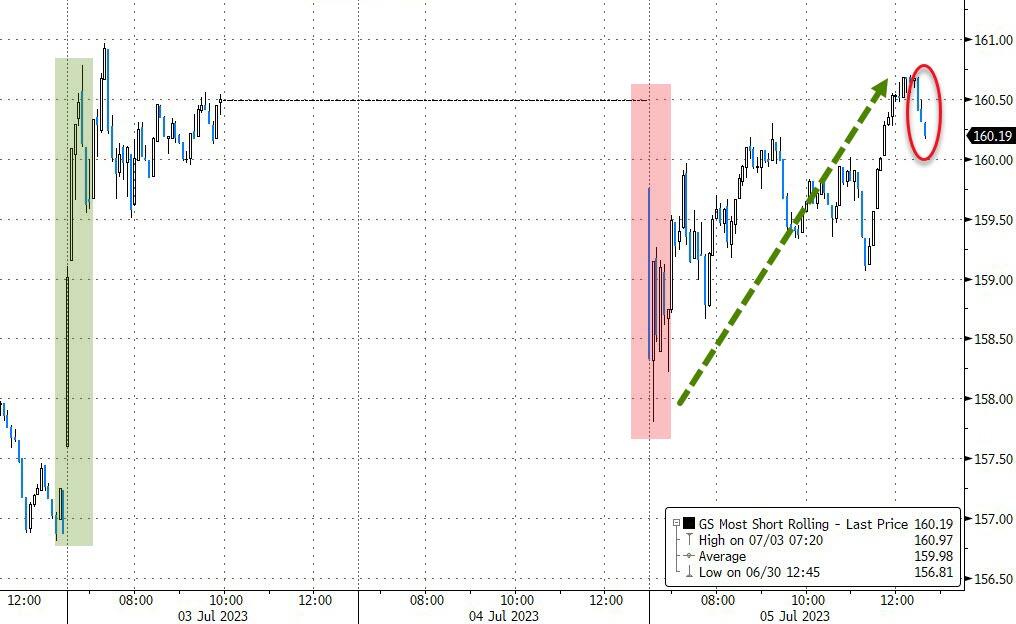
The stock market started lower, but then bounced back as some short sellers covered their positions. However, the rally fizzled out and the indexes ended in the red. They couldn’t break above the resistance levels that have been holding them back.

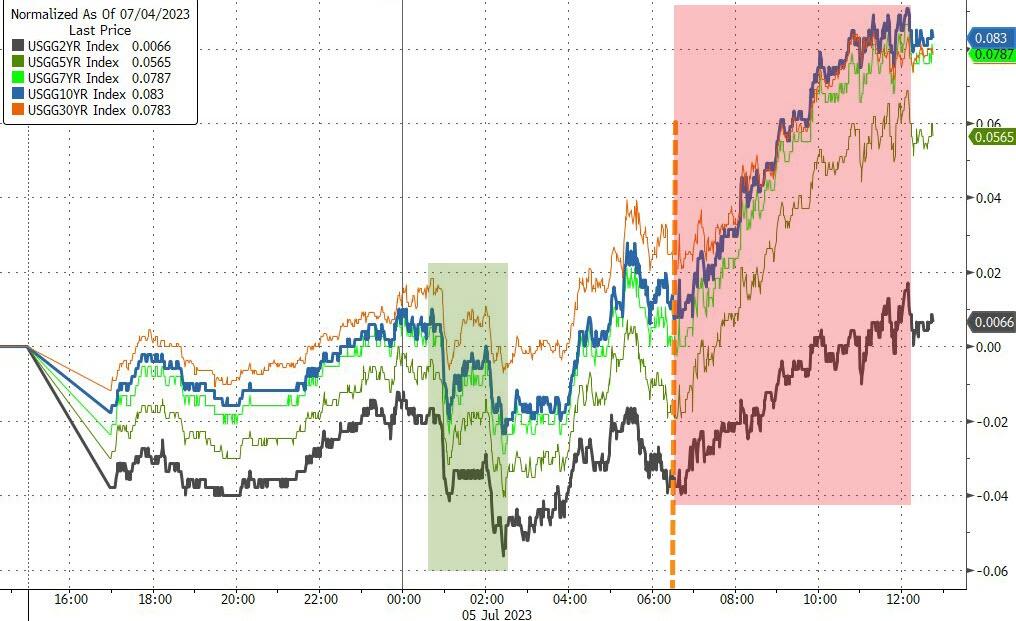
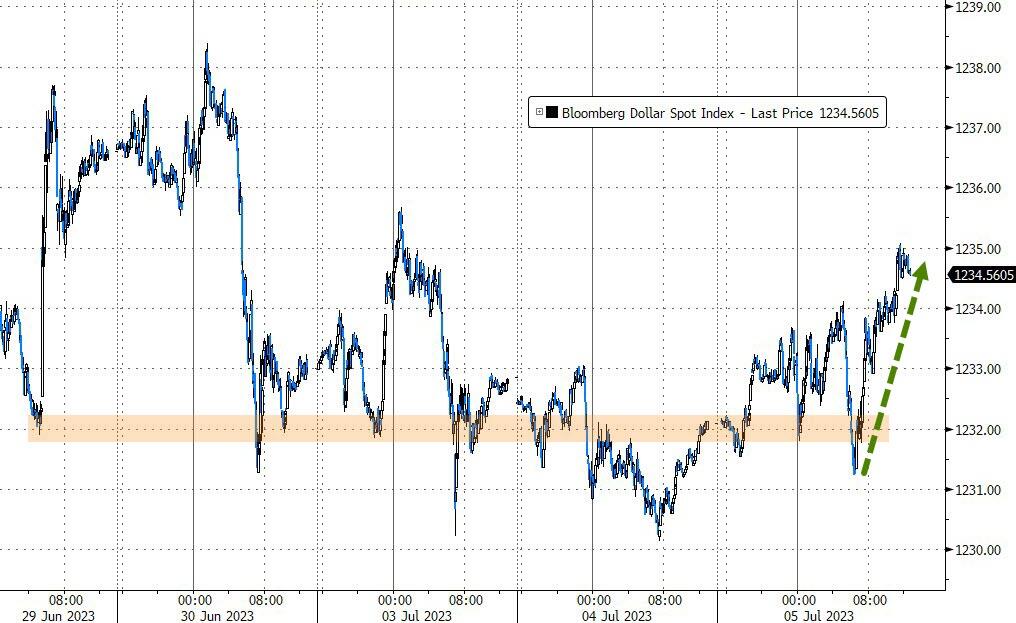
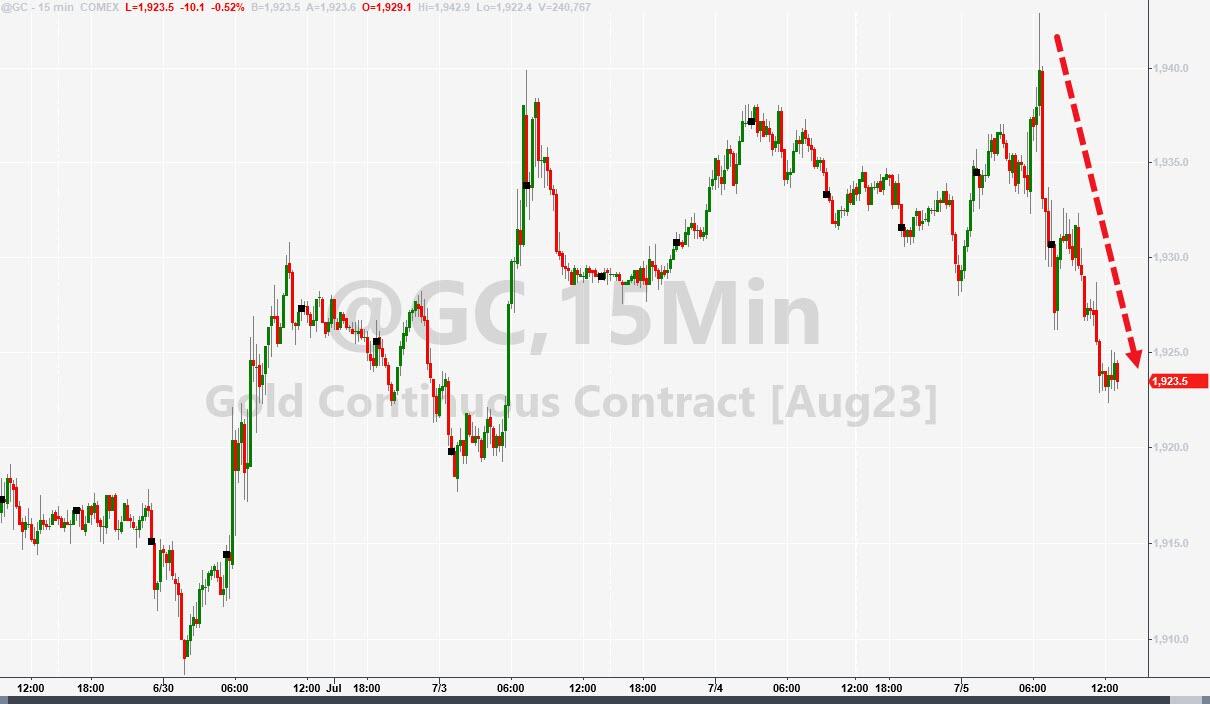
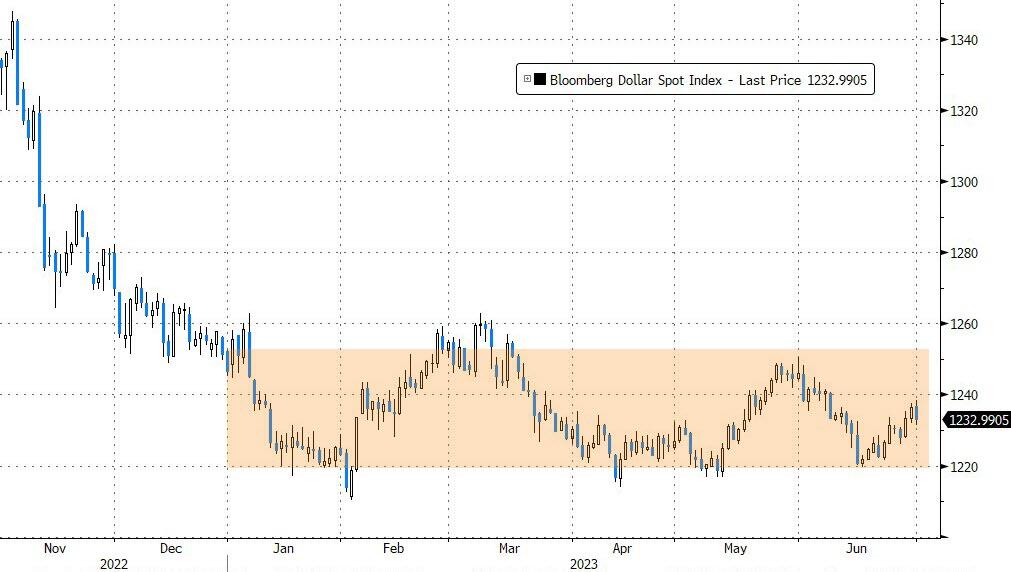
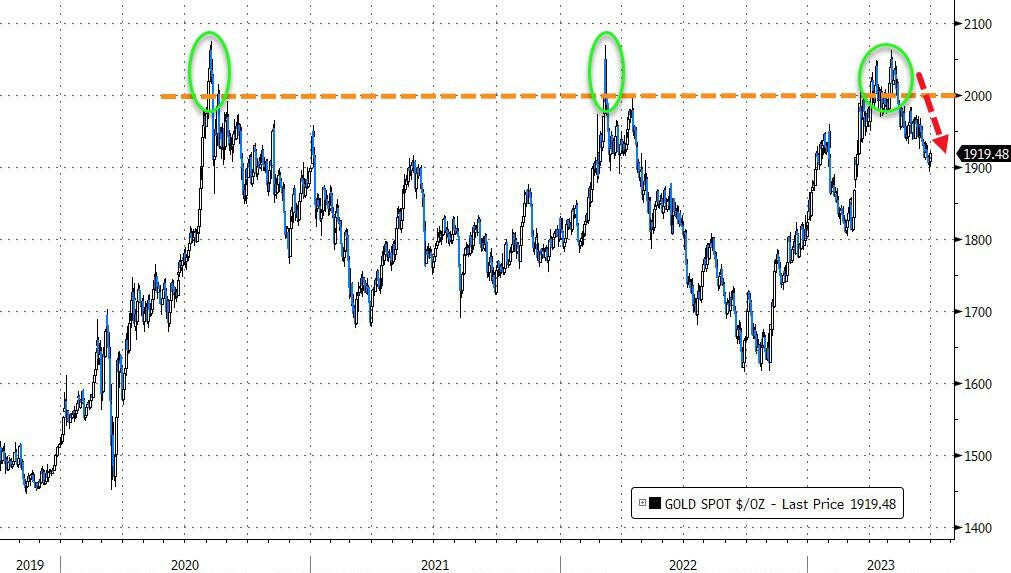
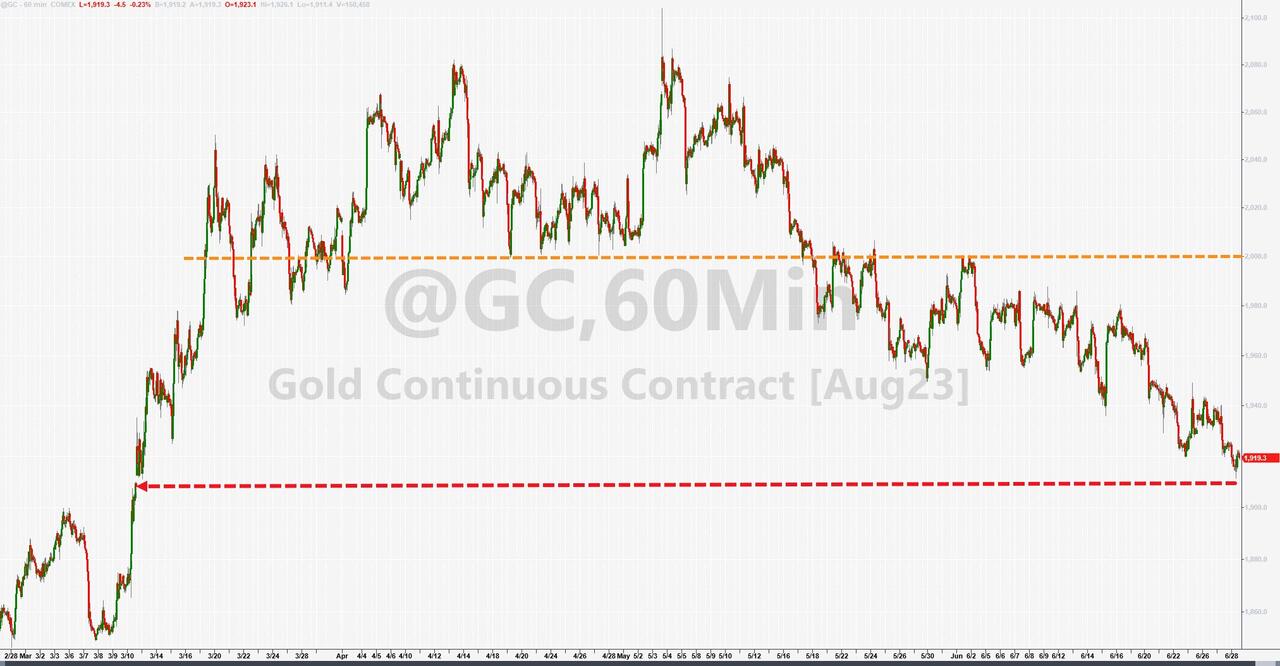
The bond market saw higher yields across the board, except for the short-term ones. This boosted the dollar and weighed on gold, which reversed its early gains and closed lower.

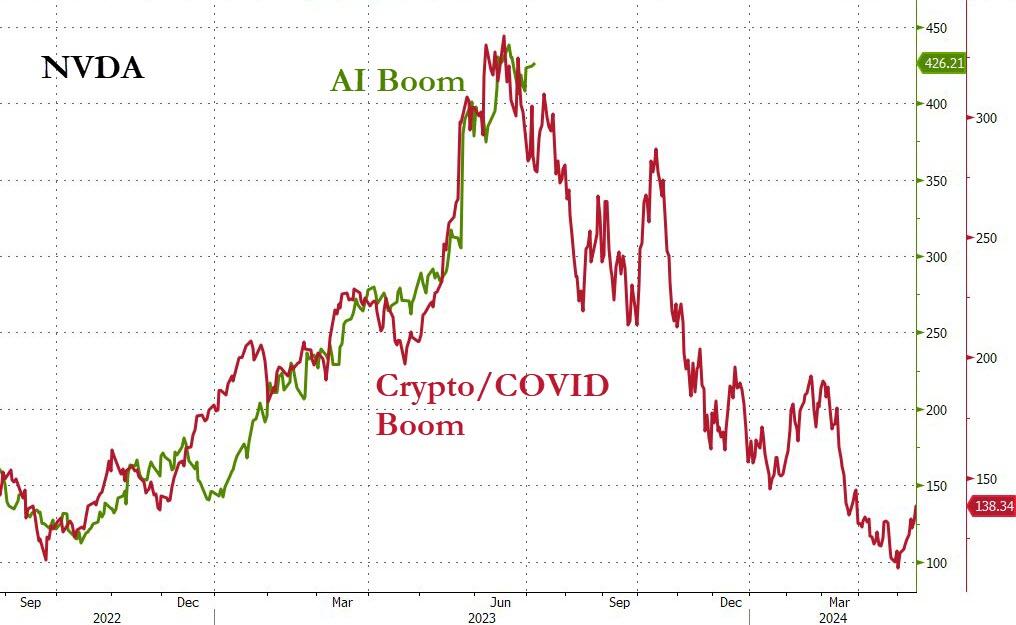
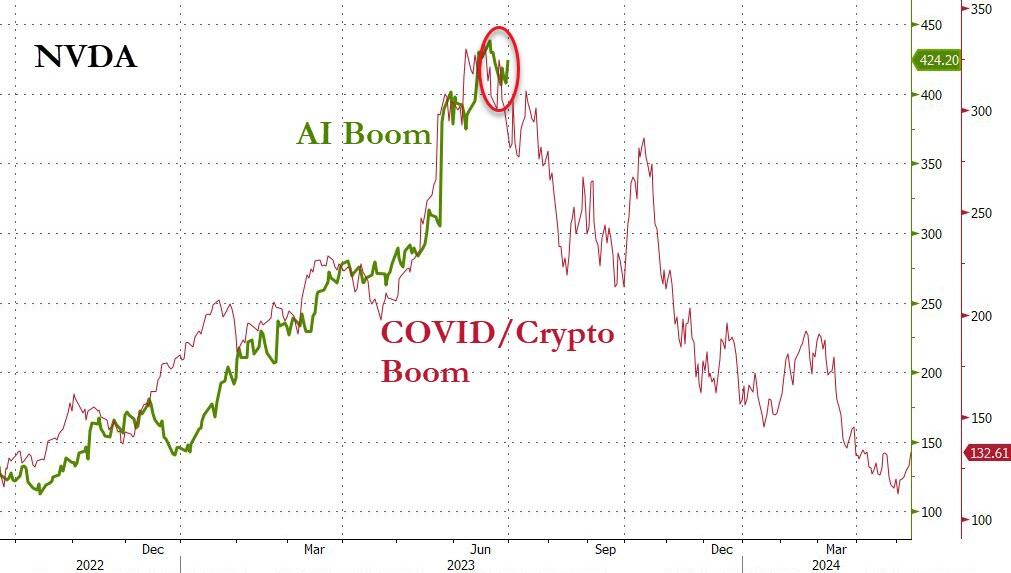
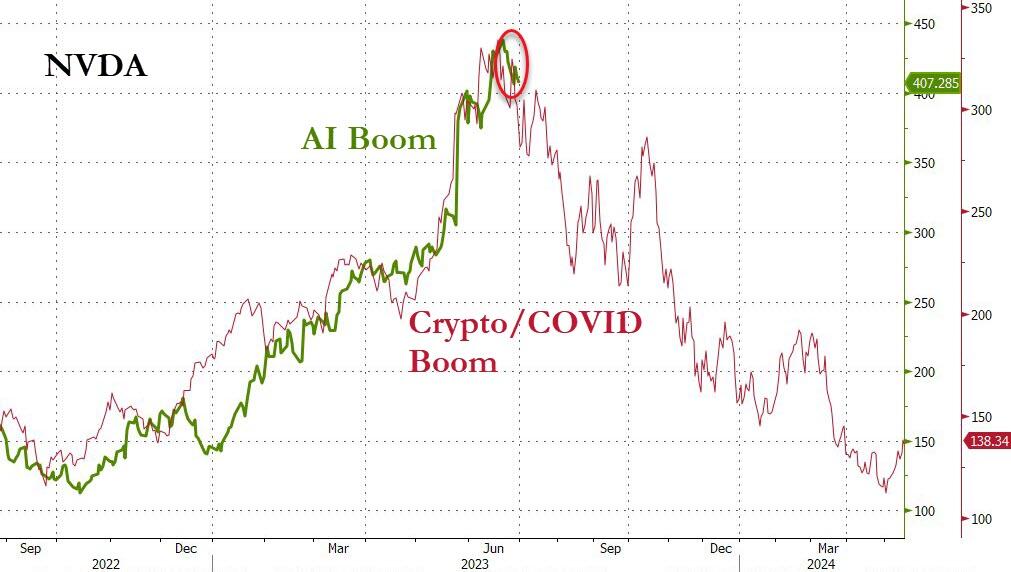
China announced new restrictions on chip materials, which could hurt the semiconductor industry. But NVDA seemed unfazed by the news, as it closed higher. I wonder if this resilience will last, as we enter the second half of 2023.

Read More
ETFs On The Cutline – Updated Through 06/30/2023

Ulli ETFs on the Cutline Contact

Do you want to know which ETFs are hot and which ones are not? Then you need my High-Volume ETF Cutline report. It tells you how close or far each of the 311 ETFs I follow is from its long-term trend line (39-week SMA). These are the ETFs that trade more than $5 million a day, so they are not some obscure funds that nobody cares about.

The report is split into two parts: The winners that are above their trend line (%M/A), and the losers that are below it. The yellow line is the line of shame that separates them. You can see how many ETFs are in each group and how they have changed since the last report (177 vs. 198 current).

Take a peek:

The HV ETF Master Cutline Report

If you are confused by some of the terms we use, don’t panic. I have a helpful Glossary of Terms for you.

If you want to learn more about the Cutline method and how it can make you rich (or at least less poor), read my original post here.

ETF Tracker Newsletter For June 30, 2023

Ulli ETF Tracker Contact

ETF Tracker StatSheet          

You can view the latest version here.

AI BOOM FUELS MARKET OPTIMISM, BUT WILL HISTORY REPEAT ITSELF?

[Chart courtesy of MarketWatch.com]

  1. Moving the markets

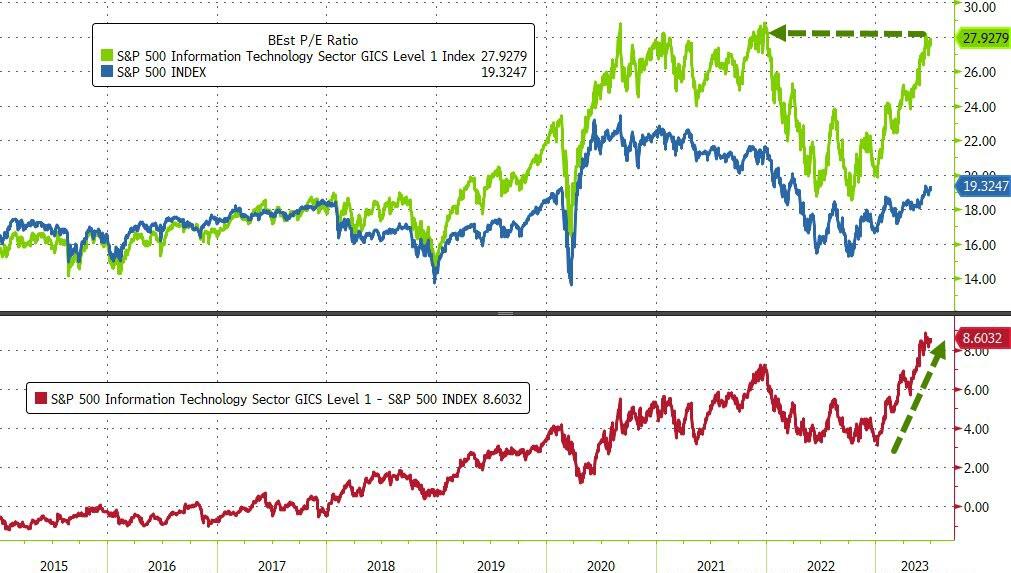
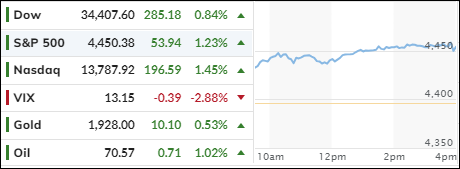
The markets defied the central bankers’ warnings of more rate hikes and pushed the major indexes higher to end the quarter with a bang. The tech sector, led by a few AI darlings, bounced back from a slump, and fueled the rally with hopes of a bright future and a dovish Fed.

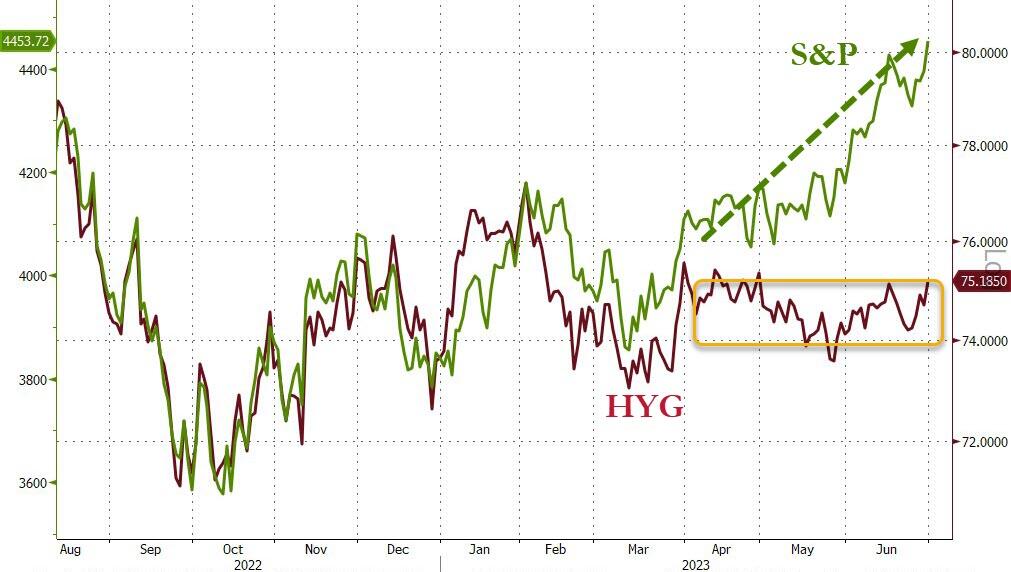
But not everyone is buying the bullish story. Some traders are bracing for more volatility and profit taking in the second half of the year, as the rally has stretched the valuations and diverged from the credit markets.

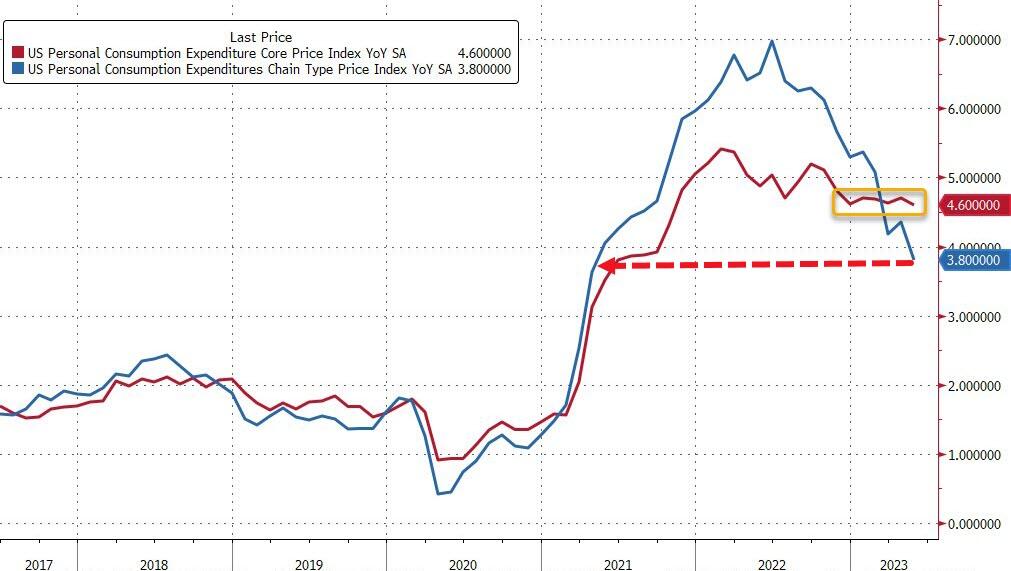
Others are singing the disinflation song and urging the Fed to hold off on tightening to avoid a recession. They might be singing too soon. Inflation is still running hot, as evidenced by the soaring wages and the elevated core PCE.

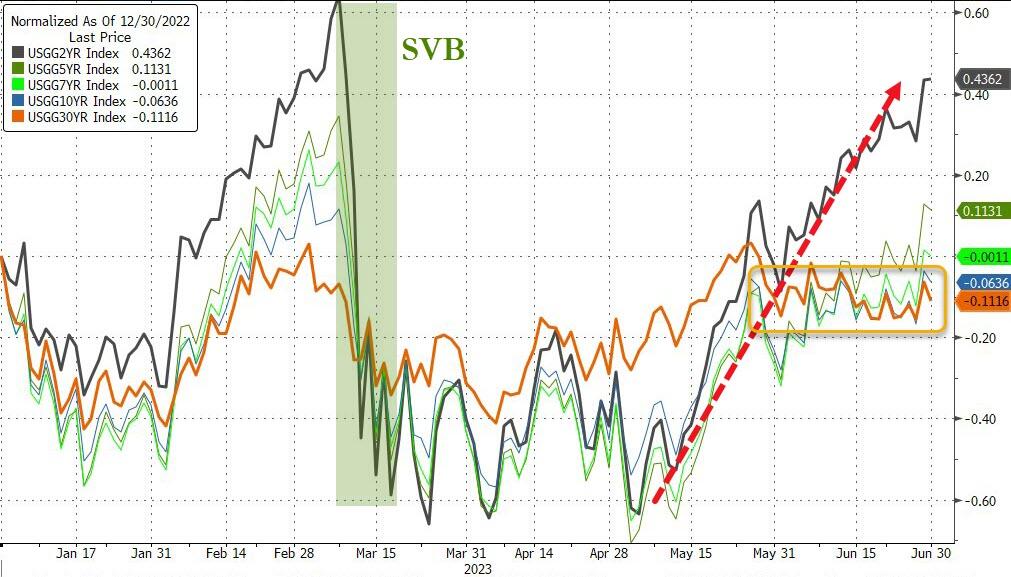
The bond yields have flattened, but not collapsed. The dollar has weakened but has not crashed. Gold has retreated, but not surrendered.

The inflation monster is still lurking, and it might surprise us in the second half of the year. As Warren Buffett once said, “What we learn from history is that people don’t learn from history.”

Will that apply to the current AI boom?

Read More

Weekly StatSheet For The ETF Tracker Newsletter – Updated Through 06/29/2023

Ulli ETF StatSheet Contact

ETF Data updated through Thursday, June 29, 2023

How to use this StatSheet:

  1. Out of the 1,800+ ETFs out there, I only pick the ones that trade over $5 million per day (HV ETFs), so you don’t get stuck with a lemon that nobody wants to buy or sell.
  1. Trend Tracking Indexes (TTIs)

These are the main indicators that tell you when to buy or sell Domestic and International ETFs (section 1 and 2). They do that by comparing their position to their long-term M/A (Moving Average). If they cross above, and stay there, it’s a green light to buy. If they fall below, and keep going, it’s a red light to sell. And to make sure you don’t lose your shirt if things go south, I also use a 12% trailing stop loss on all positions in these categories.

  1. All other investment areas don’t have a TTI and should be traded based on the position of each ETF relative to its own trend line (%M/A). That’s why I call them “Selective Buy.” In other words, if an ETF goes above its own trend line, you can buy it. But don’t forget to use a trailing sell stop of 12%, or less if you’re feeling nervous.

If some of these words sound like Greek to you, please check out the Glossary of Terms and new subscriber information in section 9.

  1. DOMESTIC EQUITY ETFs: BUY— since 12/01/2022

Click on chart to enlarge

This is our main compass, the Domestic Trend Tracking Index (TTI-green line in the above chart). It has now broken above its long-term trend line (red) by +4.46% and remains in “Buy” mode.

Read More
Markets Defy Rate Hike Warnings, GDP Surprises, Gold Slips

Ulli Market Commentary Contact

[Chart courtesy of MarketWatch.com]

  1. Moving the markets

The markets went on a roller coaster ride today, ignoring the warnings of Fed Chair Powell and other central bankers who said they would raise interest rates to fight inflation, even if it hurts economic growth.

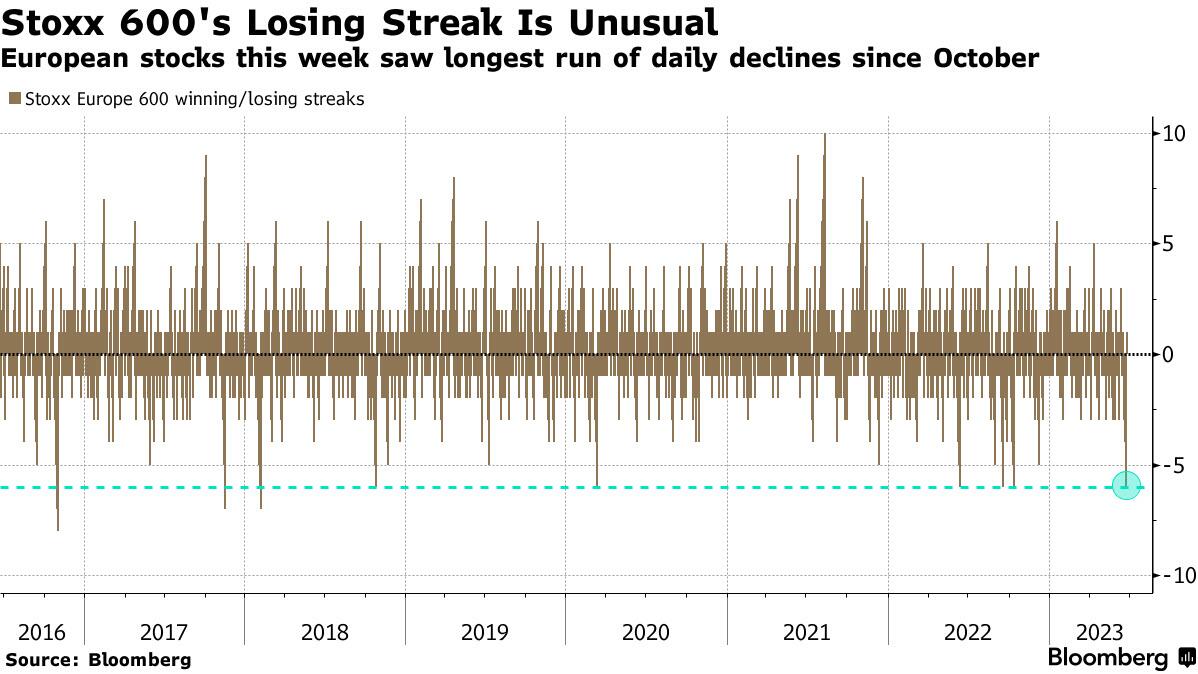
The European markets took the hint and fell sharply, but the US traders shrugged it off and pushed the major indexes higher. The Dow led the way, while the Nasdaq lagged. Some of the optimism came from the news that all US banks passed the Fed’s annual stress test. But I wonder how they would fare in a real crisis.

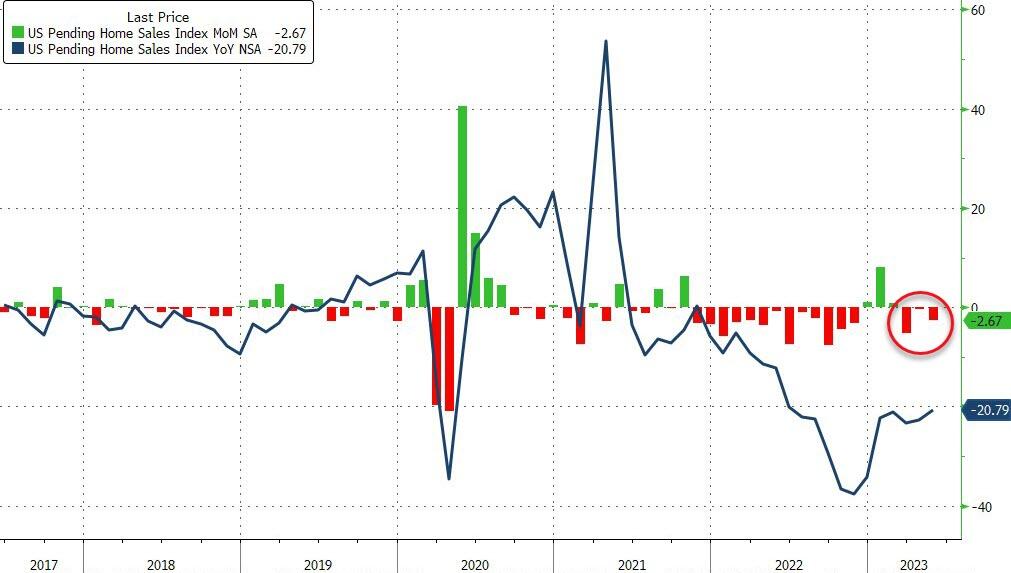
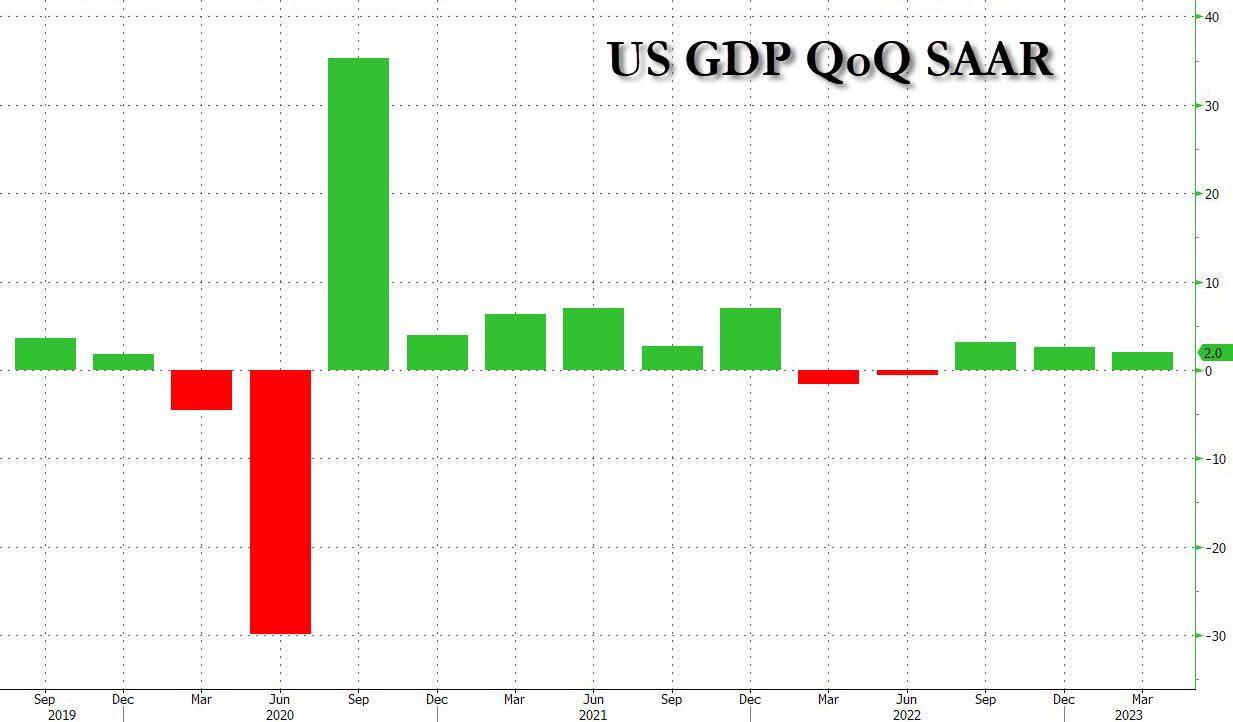
The housing market showed more signs of weakness, as pending home sales dropped more than expected in May. But the economy surprised everyone with a strong Q1 GDP growth of 2%, almost double the initial estimate. The catch is that most of it came from a sudden surge in exports, which sounds fishy to me.

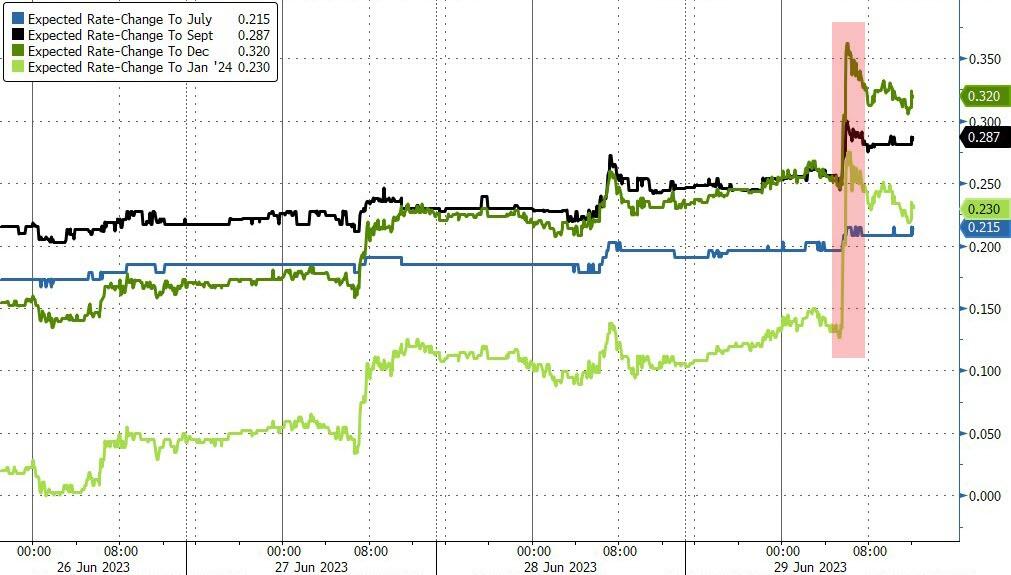
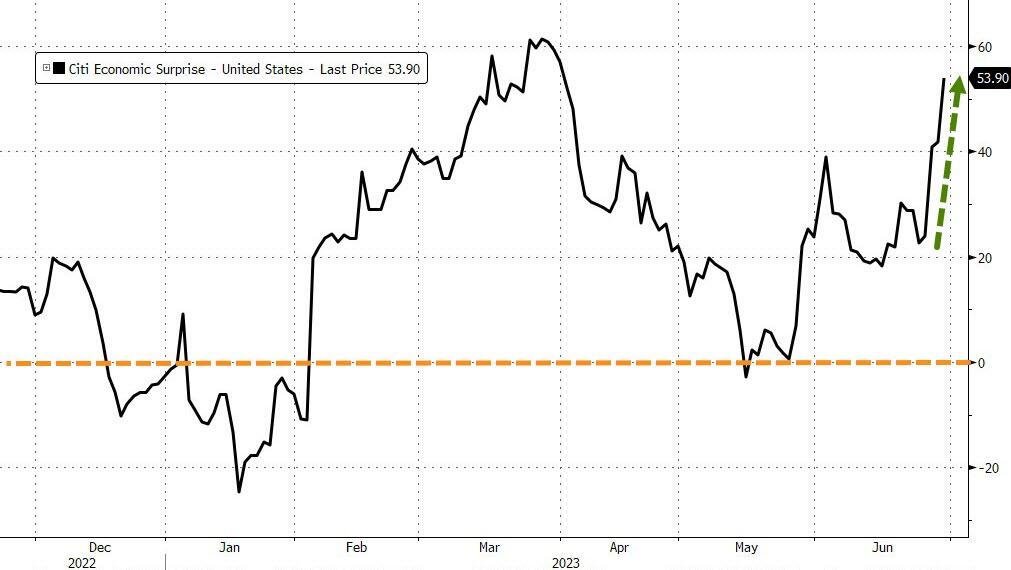
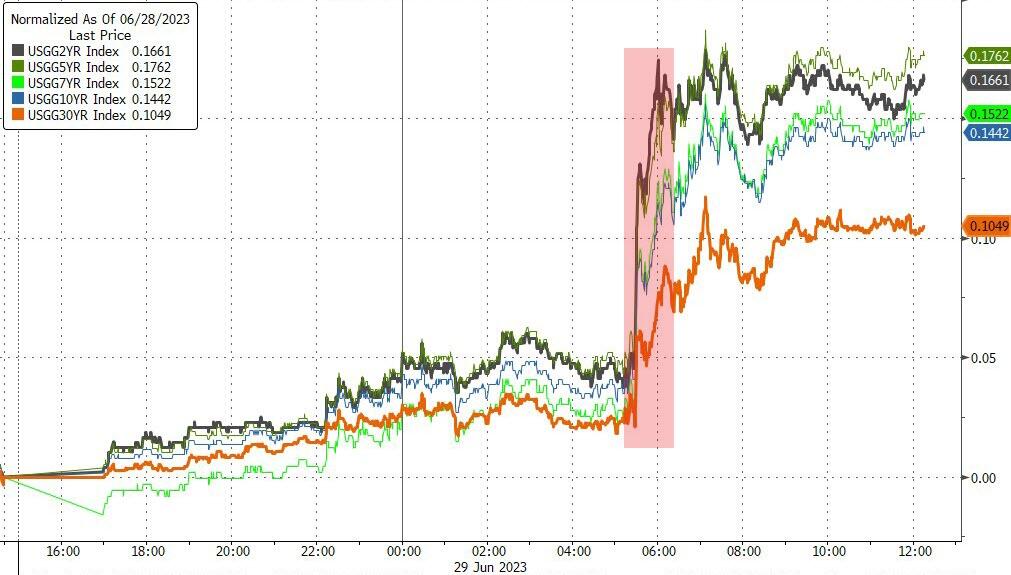
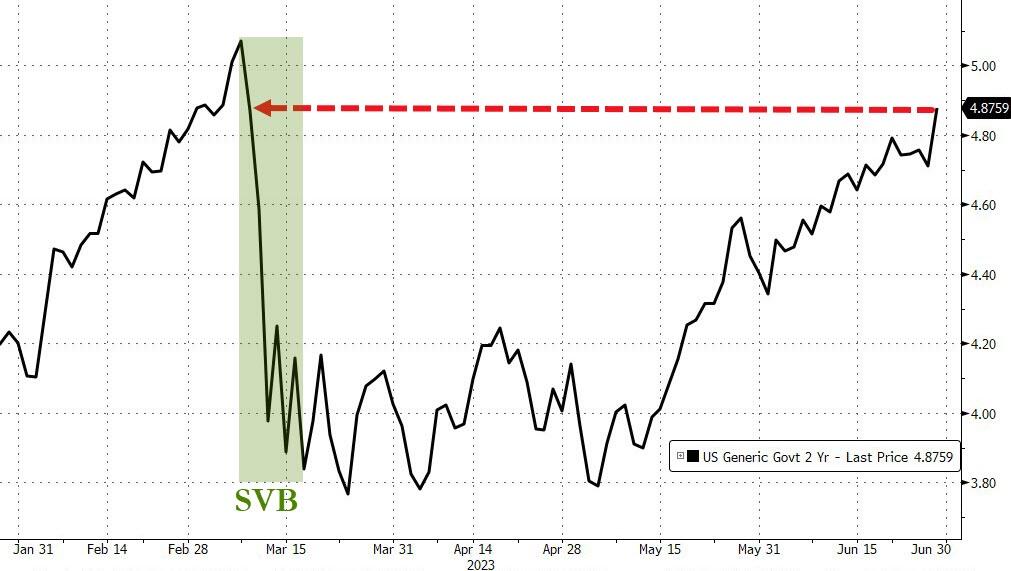
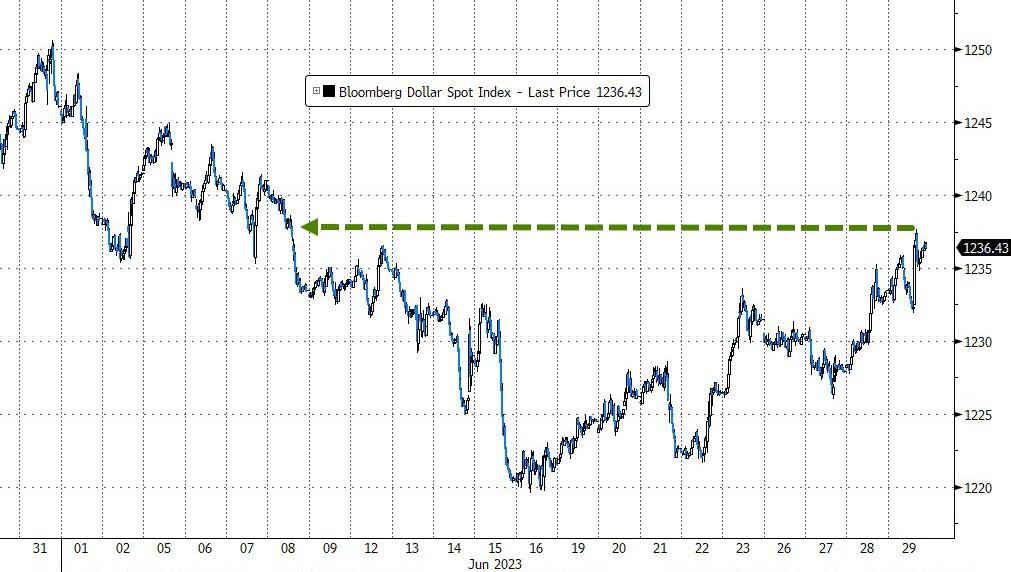
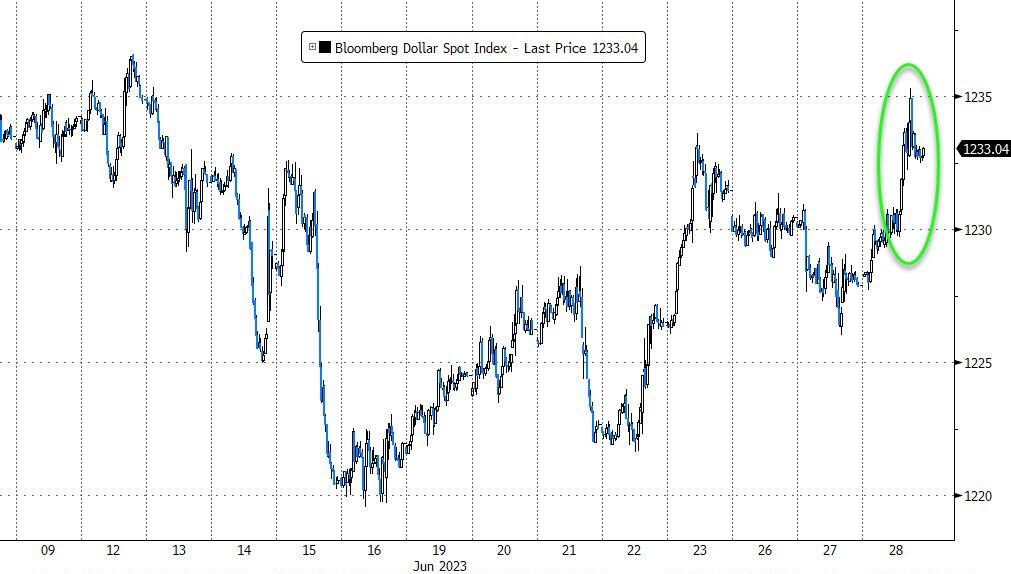
The markets cheered this number, but they forgot that it makes rate hikes more likely. In fact, the odds of higher rates jumped today, along with the Economic Surprise Index and bond yields. The 10-year yield soared to 3.85%, while the 2-year reached near cycle highs. The dollar also gained strength, hitting near 4-week highs.

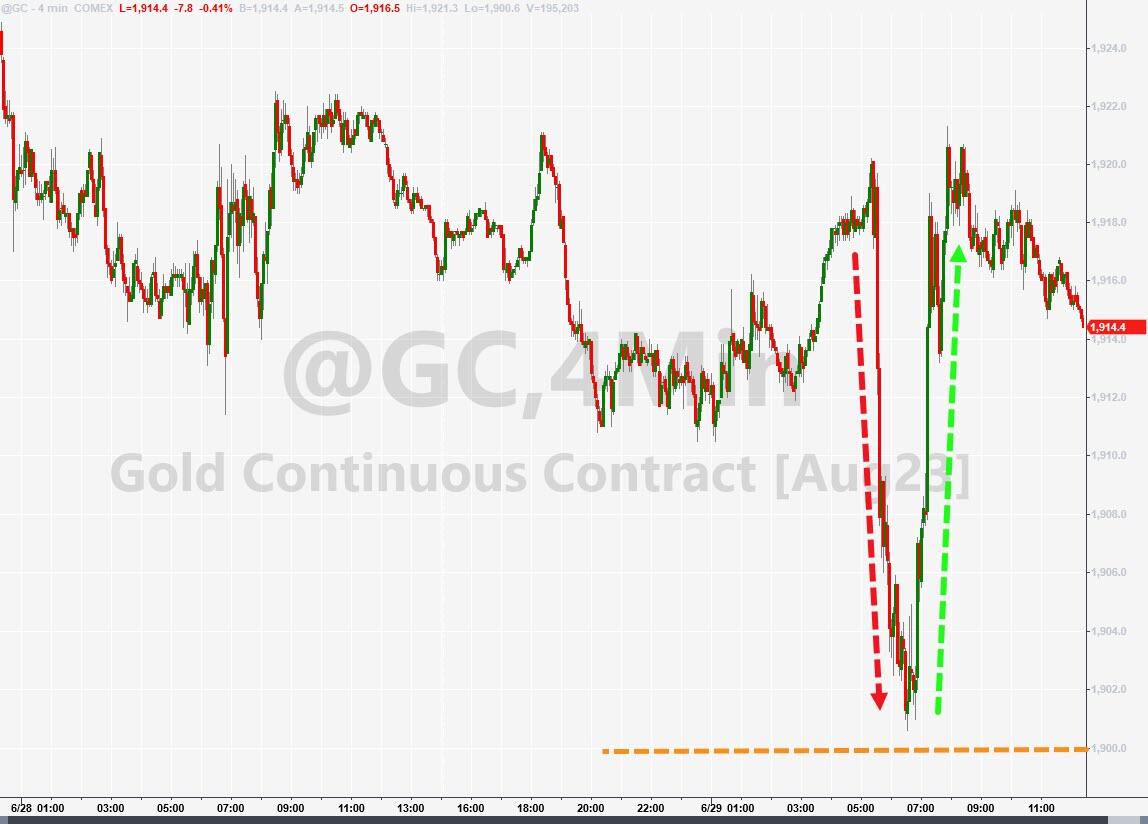
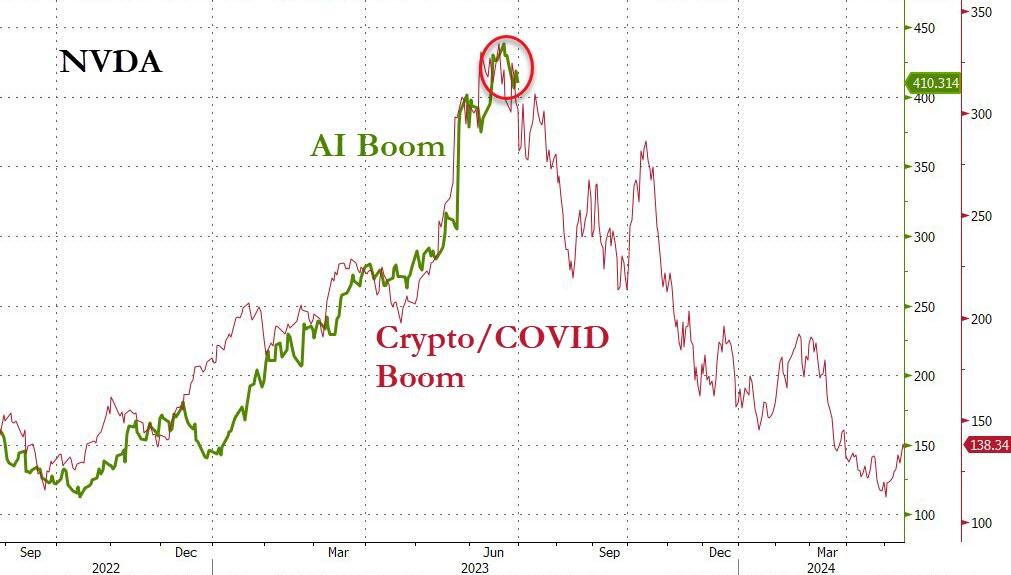
All this hawkishness hurt gold, which gave up its earlier gains but managed to stay above $1,900. The AI boom chart is still on track.

Read More
Powell Sticks To His Guns On Interest Rates, Wall Street Shrugs

Ulli Market Commentary Contact

[Chart courtesy of MarketWatch.com]

  1. Moving the markets

Fed chair Powell sounds like a broken record. He keeps saying he won’t cut interest rates anytime soon, no matter how much Wall Street begs and pleads. He has many allies who back him up on this stance. But Wall Street is in denial. They think Powell will cave in and turn soft.

Today, Powell dashed their hopes again when he said, “more restrictive policy is still to come,” and hinted at more rate hikes in the future. He also said he didn’t expect inflation to reach 2% this year or next. Ouch.

Powell was not speaking to some random audience, but to a group of influential central bankers from around the world at a European forum in Portugal. His words sent a clear signal: “higher rates for longer”.

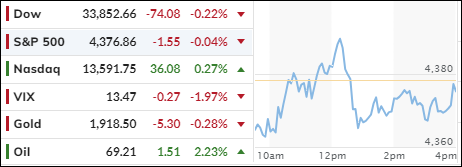
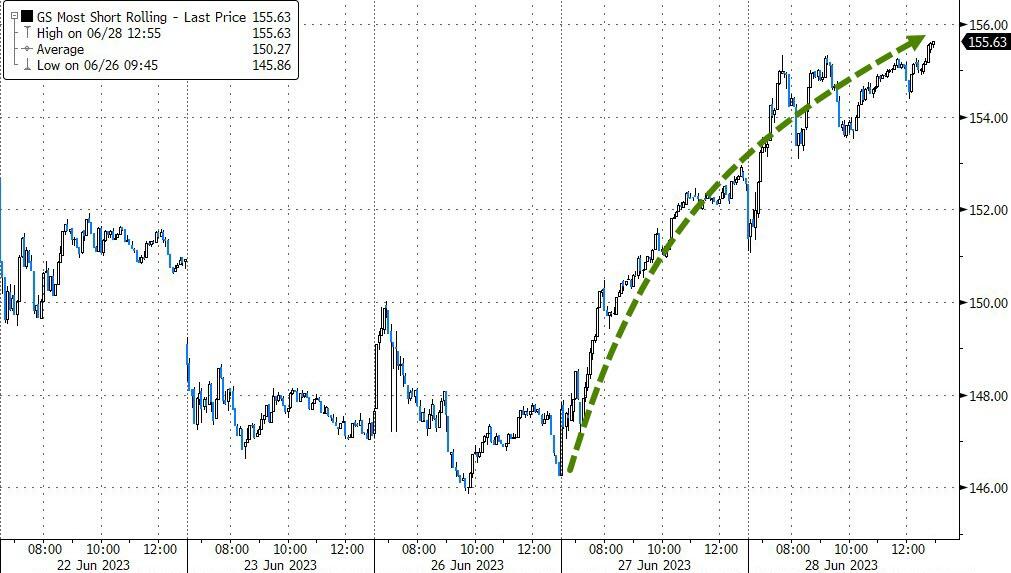
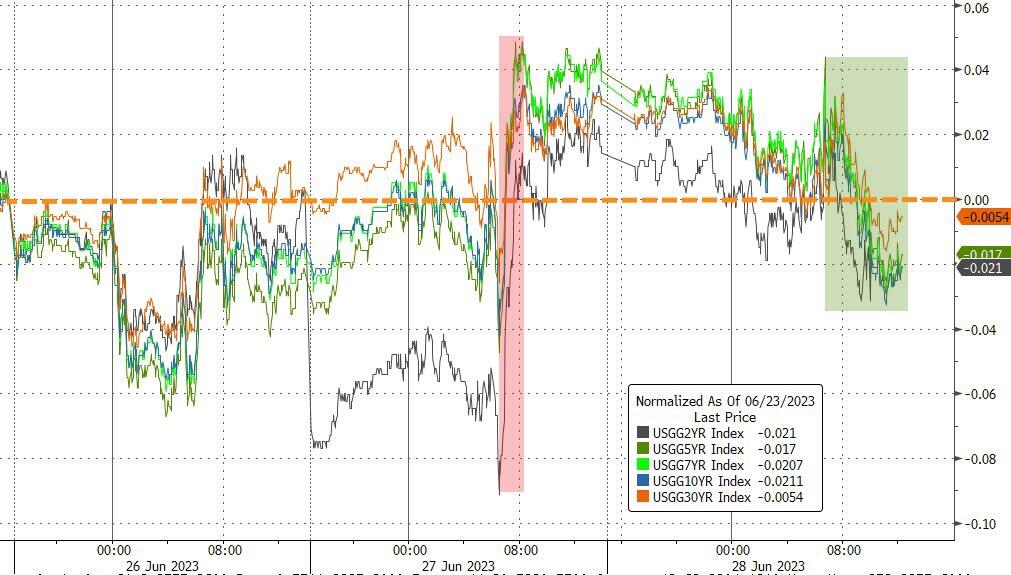
But the markets didn’t buy it, and the major indexes barely budged. Yesterday’s short squeeze fizzled out today and had no impact on the overall market. Bond yields fell, the dollar bounced back, and gold lost some shine.

The AI craze seems to have peaked, as this chart shows, and I wouldn’t be surprised to see the markets tumble down, as this bubble pops. What could cause this? Maybe a tougher crackdown on chip exports to China, which could hurt the tech sector big time.

Read More