
- Moving the markets
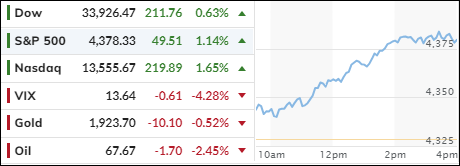
The bulls were in charge today, lifting the major indexes higher with little resistance from the bears. The Dow finally snapped its losing streak of six days, thanks to a tech rally.
A flurry of positive economic data also boosted the market mood, showing signs of strength in the economy, despite the looming threat of a recession. Or maybe we are already in one, but we just don’t know it yet, because we use different metrics now.
Anyway, here are some of the highlights from today’s reports:
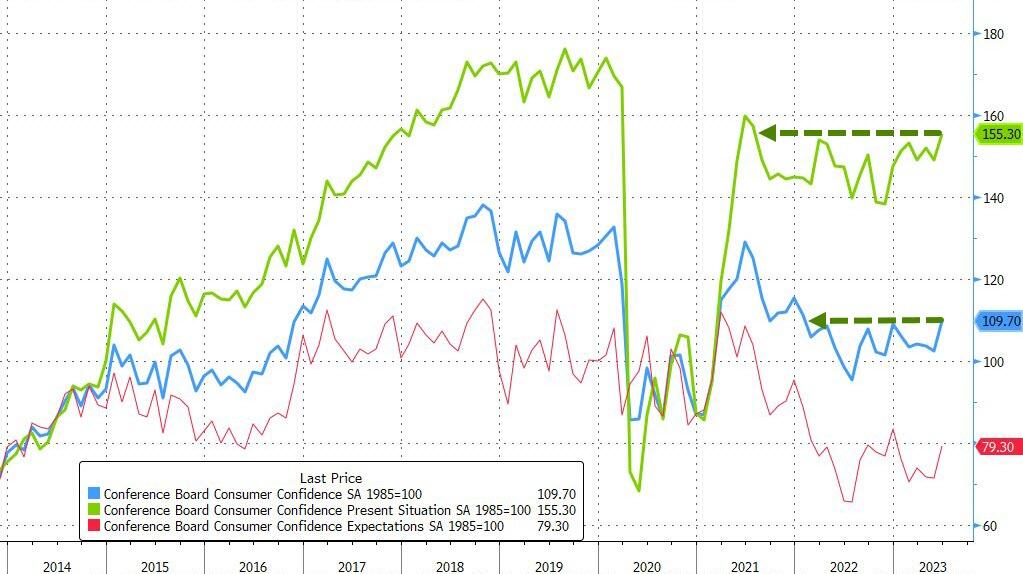
- Consumer Confidence jumped to its highest level in a year, as people felt more optimistic about the next six months.
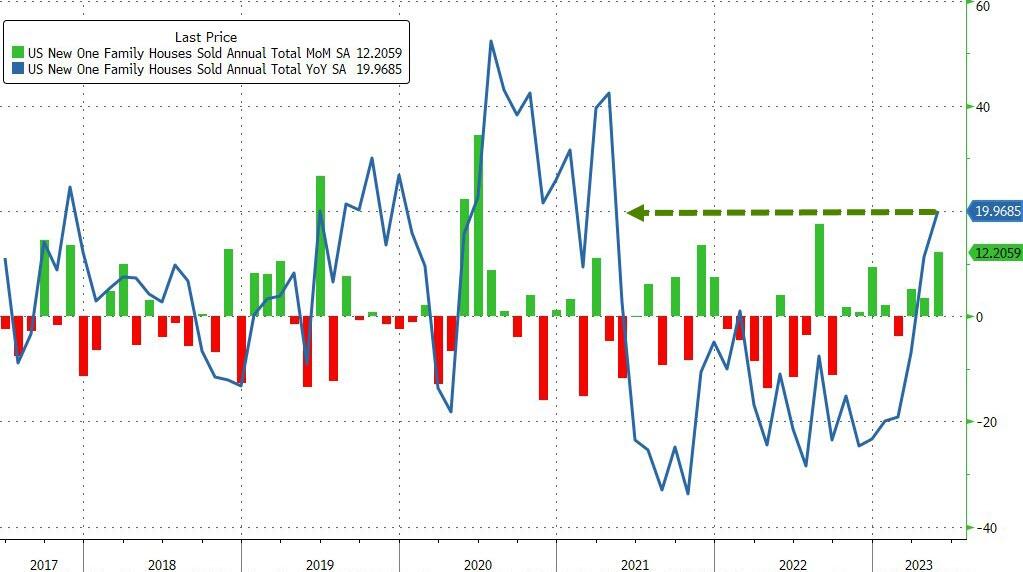
- New Home Sales surged by 12.2% in May, the biggest increase since May 2022.
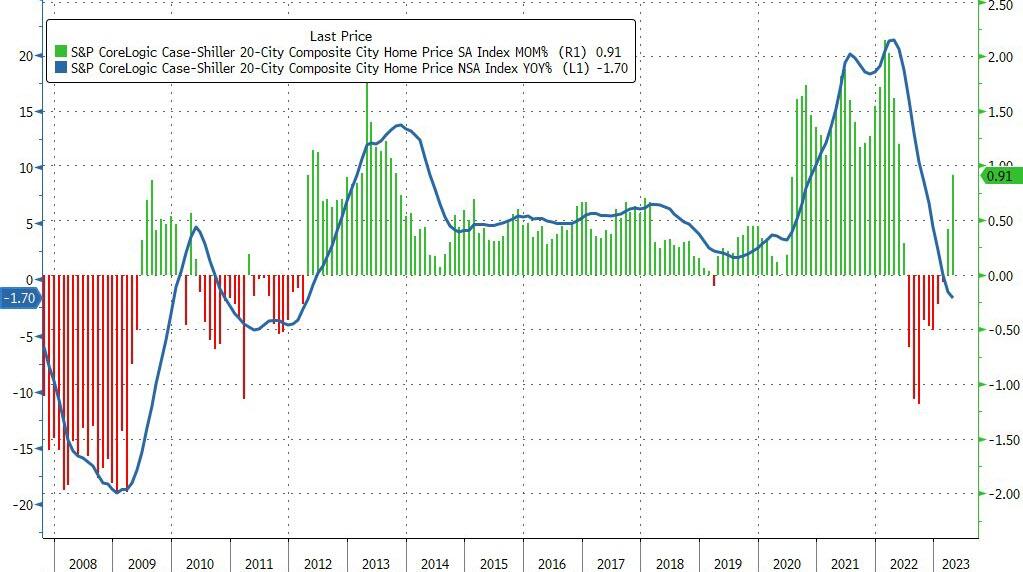
- Home Prices soared in April, as lower mortgage rates made buying more affordable.
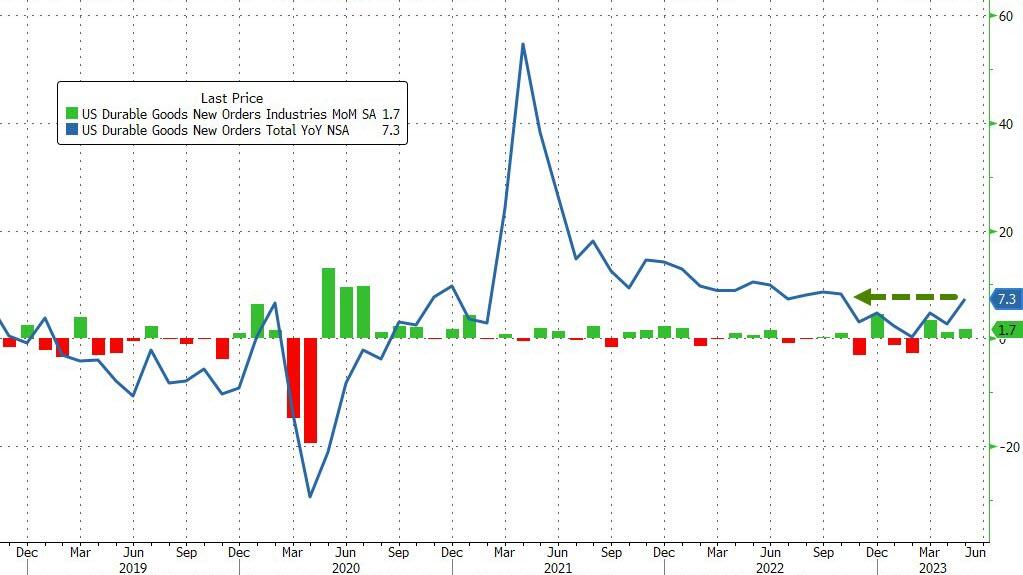
- Durable Goods Orders rose by 1.7% in May, beating expectations and indicating strong demand for long-lasting goods.
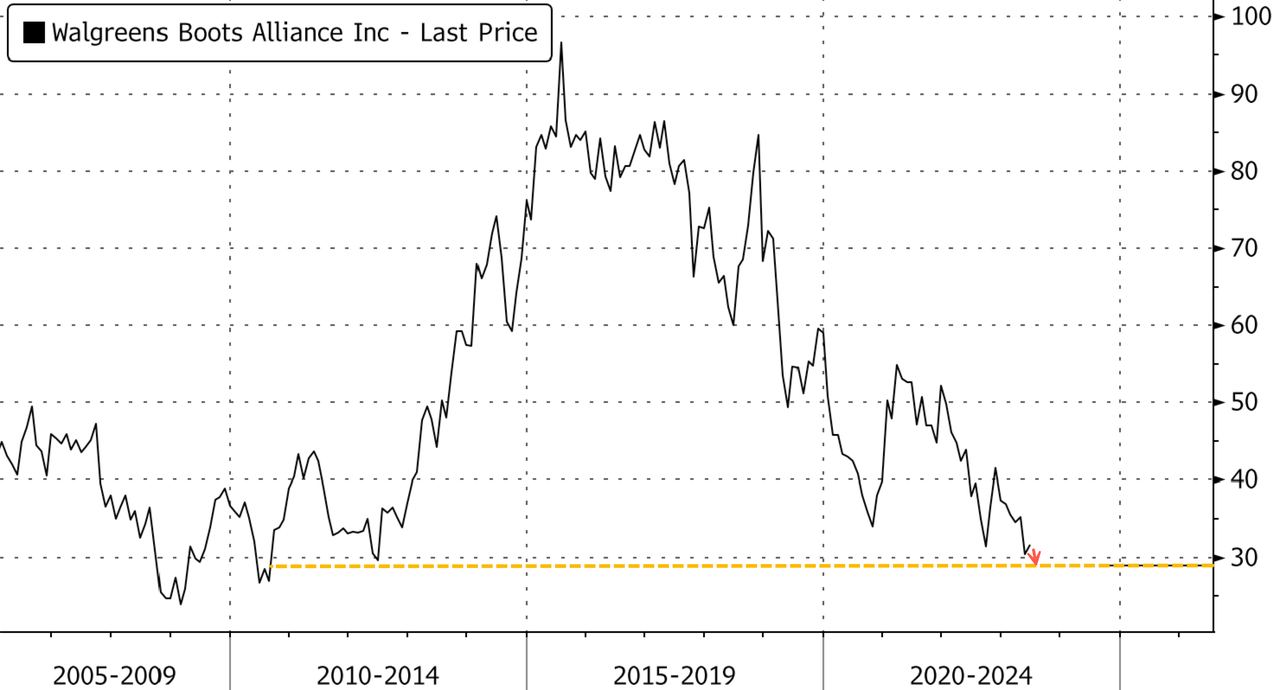
But not everything was rosy today. Walgreen’s cut its earnings guidance and blamed “cautious” customers for its poor performance. Its shares plunged to a 10-year low. Ouch indeed.
Some analysts still think that the economy is doing fine, and that the chances of a recession are fading. If they are right, the Fed might have to raise interest rates a few more times this year, which would put an end to the hopes of a rate cut from Fed chair Powell. I doubt that he will change his hawkish stance anytime soon.
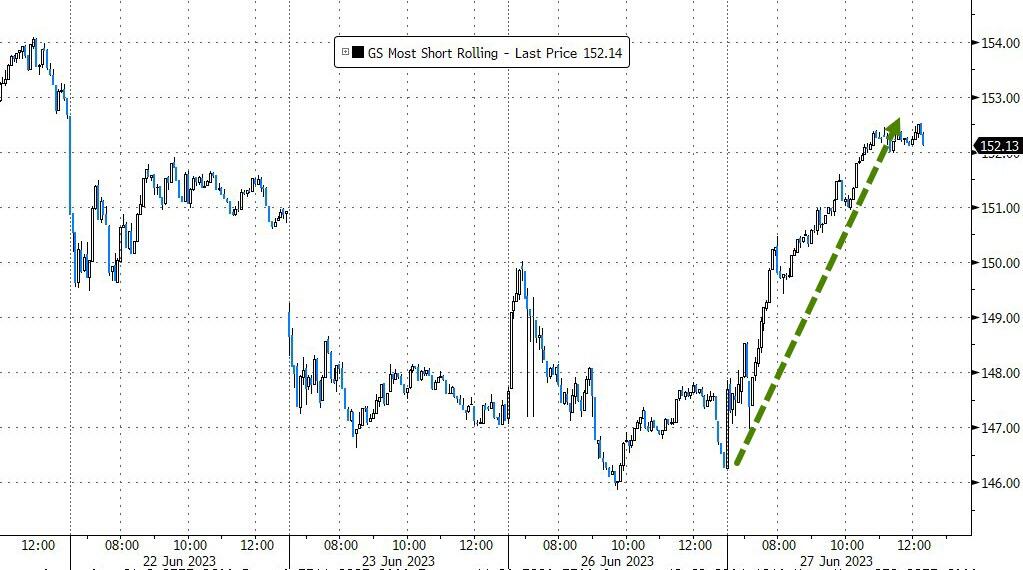
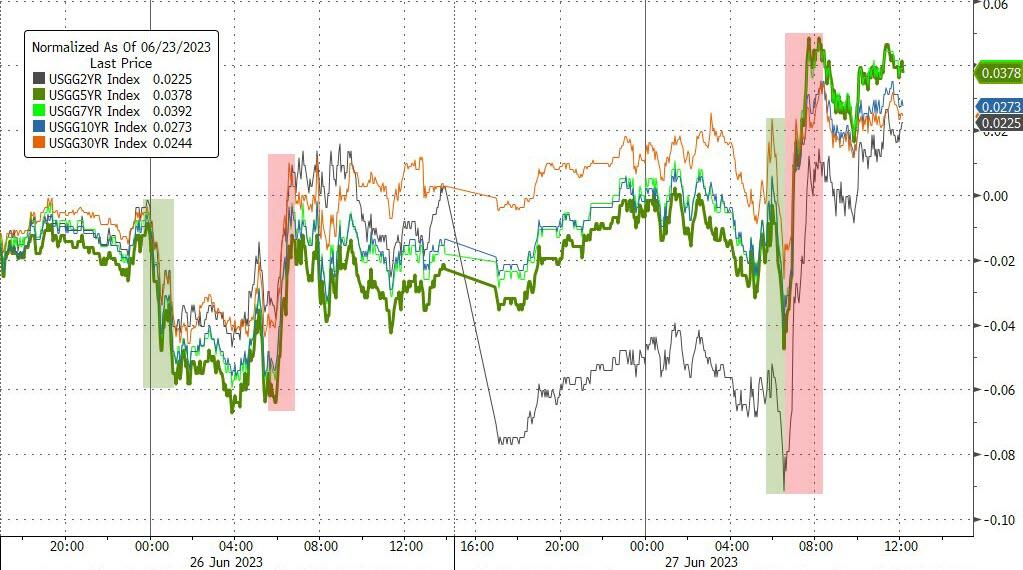
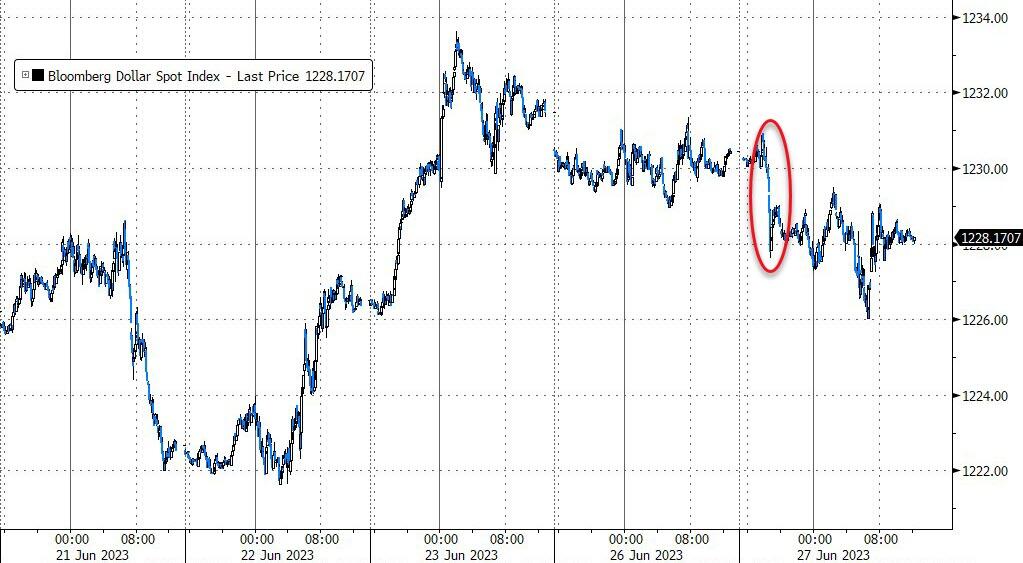
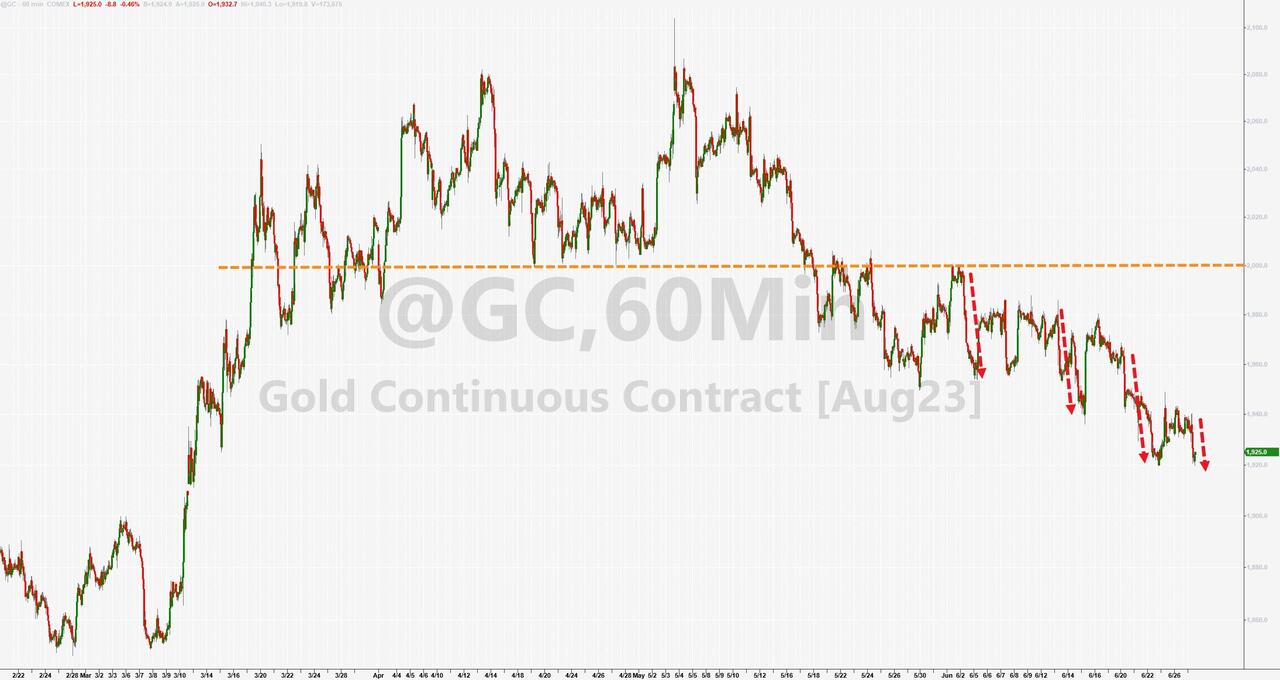
The upbeat data also triggered a short squeeze, as bond yields jumped higher. The dollar, however, weakened, while gold fell to its lowest level in three months.
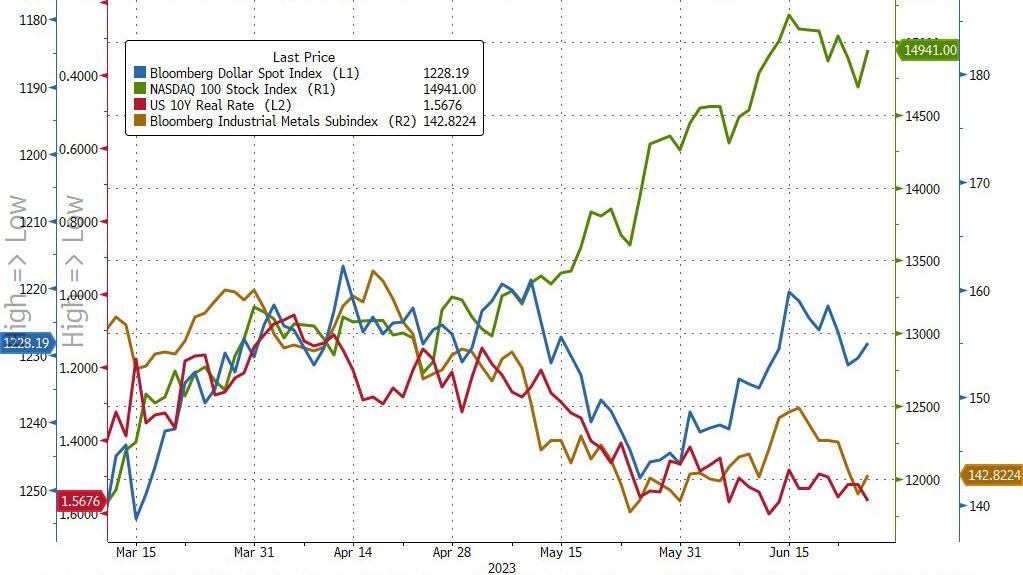
The big question is: how long can stocks keep defying economic reality? This chart shows how out of sync they are with the rest of the data. I expect them to come back down to earth in the next quarter.
- “Buy” Cycle Suggestions
The current Buy cycle began on 12/1/2022, and I gave you some ETF tips based on my StatSheet back then. But if you joined me later, you might want to check out the latest StatSheet, which I update and post every Thursday at 6:30 pm PST.
You should also think about how much risk you can handle when picking your ETFs. If you are more cautious, you might want to go for the ones in the middle of the M-Index rankings. And if you don’t want to go all in, you can start with a 33% exposure and see how it goes.
We are in a crazy time, with the economy going downhill and some earnings taking a hit. That will eventually drag down stock prices too. So, in my advisor’s practice, we are looking for some value, growth and dividend ETFs that can weather the storm. And of course, gold is always a good friend.
Whatever you invest in, don’t forget to use a trailing sell stop of 8-12% to protect yourself from big losses.
- Trend Tracking Indexes (TTIs)
The market rose steadily today, thanks to positive economic indicators. Our Trend Tracking Indexes (TTIs) also gained ground and moved further above their respective trend lines, after dropping for most of the past two weeks.
This is how we closed 06/27/2023:
Domestic TTI: +3.82% above its M/A (prior close +2.57%)—Buy signal effective 12/1/2022.
International TTI: +6.65% above its M/A (prior close +5.72%)—Buy signal effective 12/1/2022.
All linked charts above are courtesy of Bloomberg via ZeroHedge.
Contact Ulli