
- Moving the markets
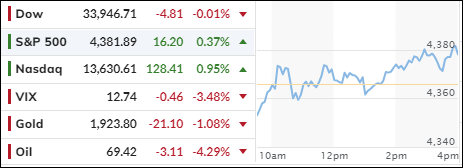
The stock market was a rollercoaster ride yesterday, with the S&P 500 and Nasdaq barely ending in the green after a three-day losing streak. The culprit? Fed chair Powell’s hawkish comments on more rate hikes to tame inflation.
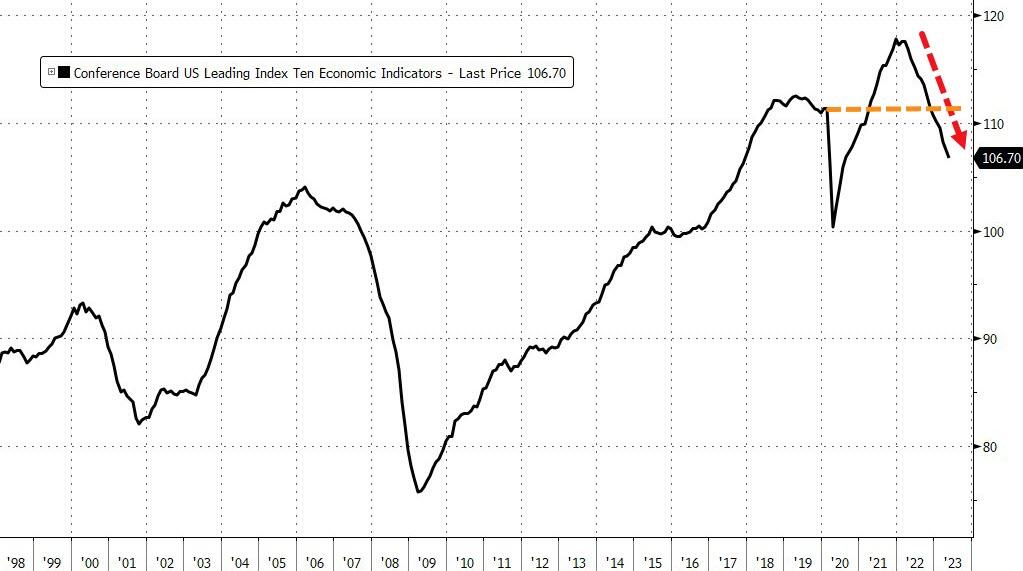
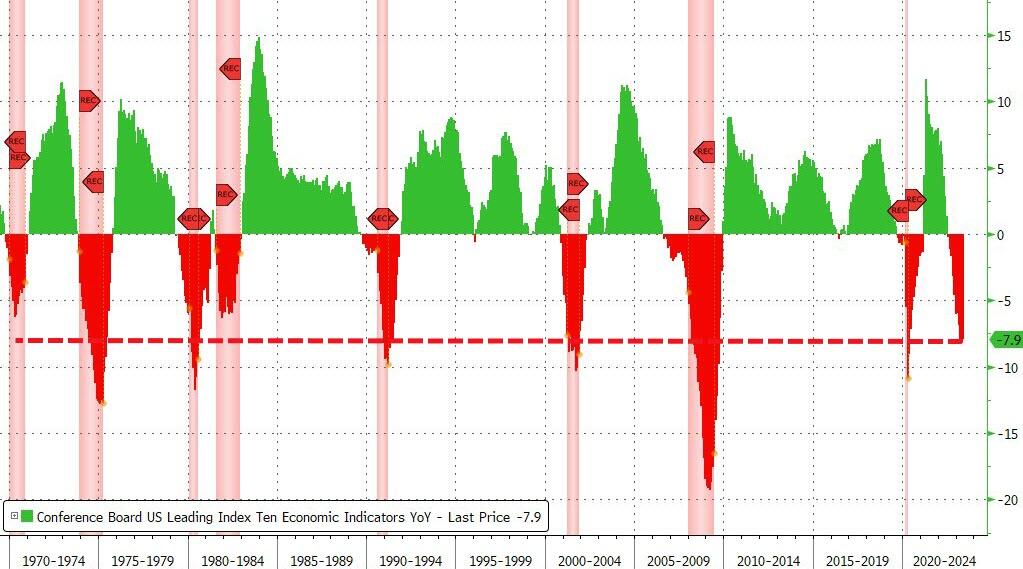
The economic outlook was also gloomy, with the US Leading Economic Indicator (LEI) dropping for the 14th consecutive month, signaling weaker activity ahead. The LEI plunged 7.9% year over year, close to its worst decline since 2008.
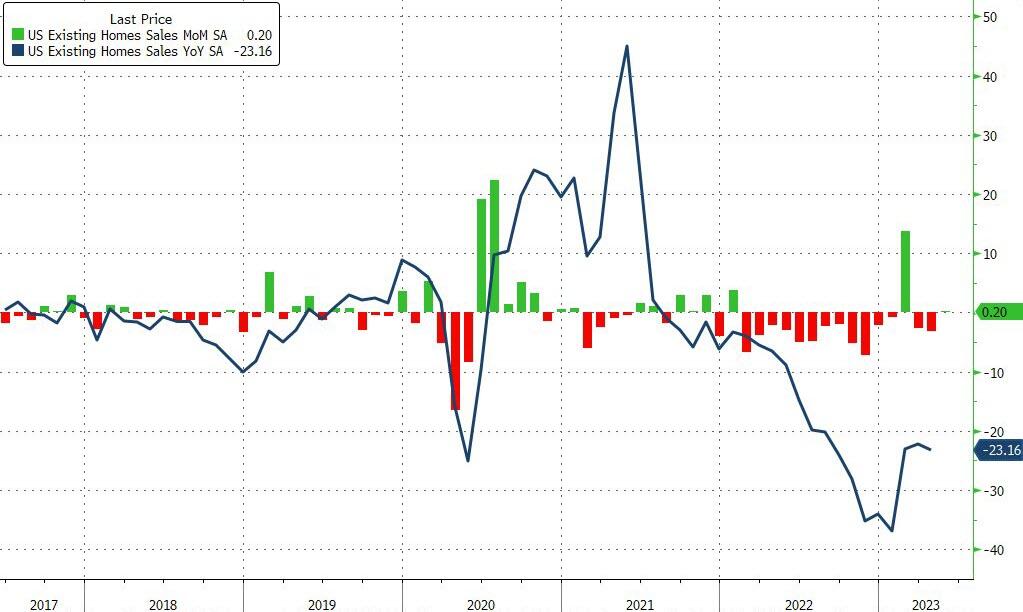
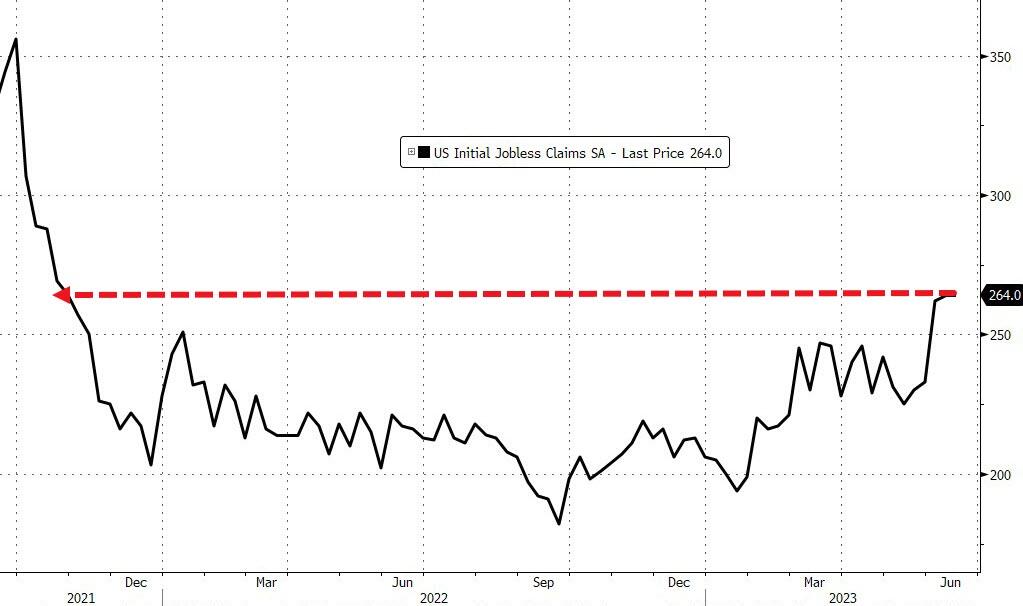
Existing Home Sales edged up 0.2% in May, but prices fell the most since 2011. Meanwhile, initial jobless claims soared to 264k, the highest since October 2021.
Across the pond, the Bank of England (BoE) shocked the markets with a 50-bps rate hike to fight their soaring inflation. Exchequer Jeremy Hunt said that “bringing inflation down is our absolute priority.”
That sounds familiar, doesn’t it? But US traders and algos seem to ignore Powell and keep buying stocks in the hope of lower rates.
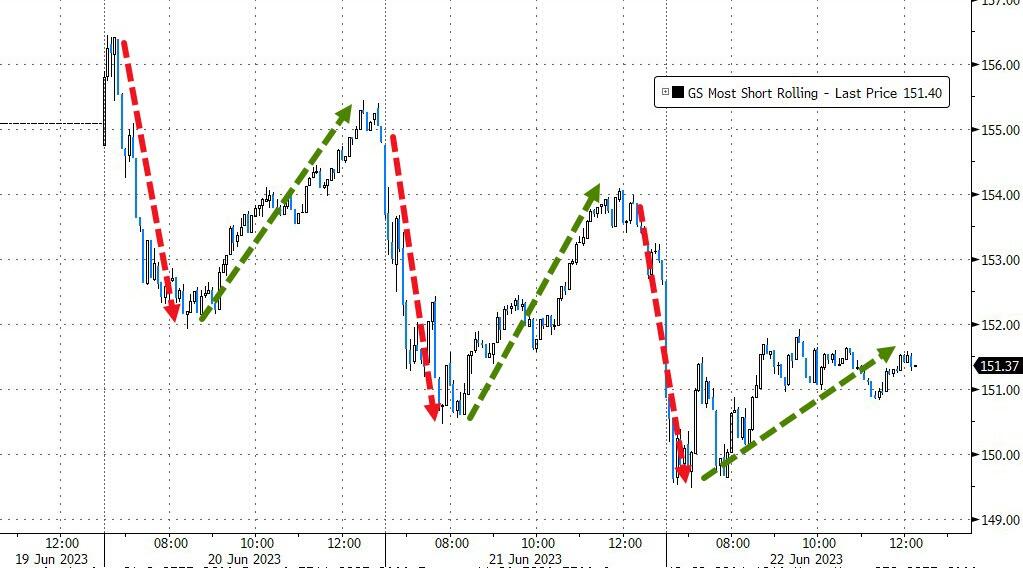
The only thing that saved the day was a short squeeze, which lacked conviction but managed to lift two of the three major indexes into positive territory.
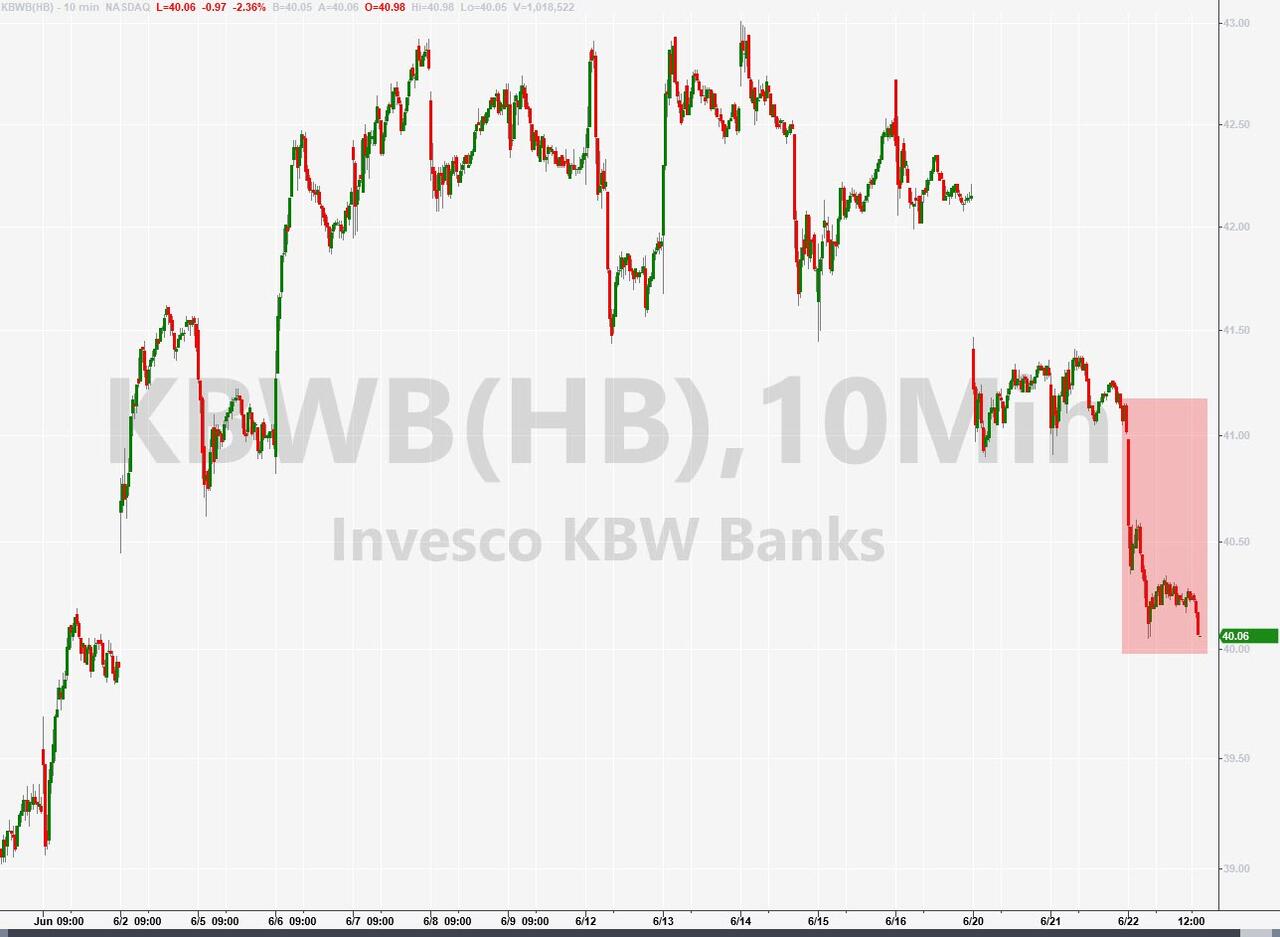
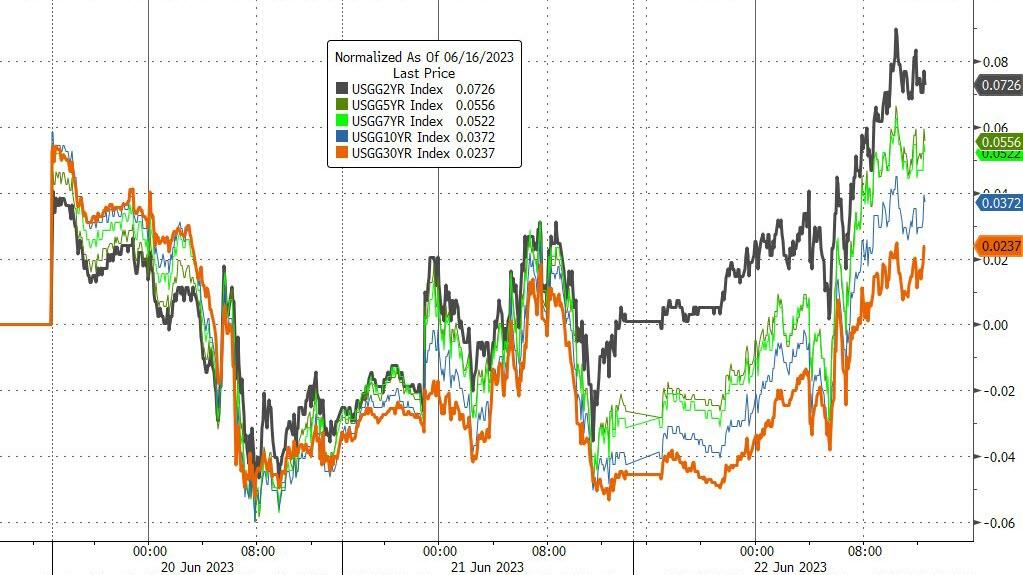
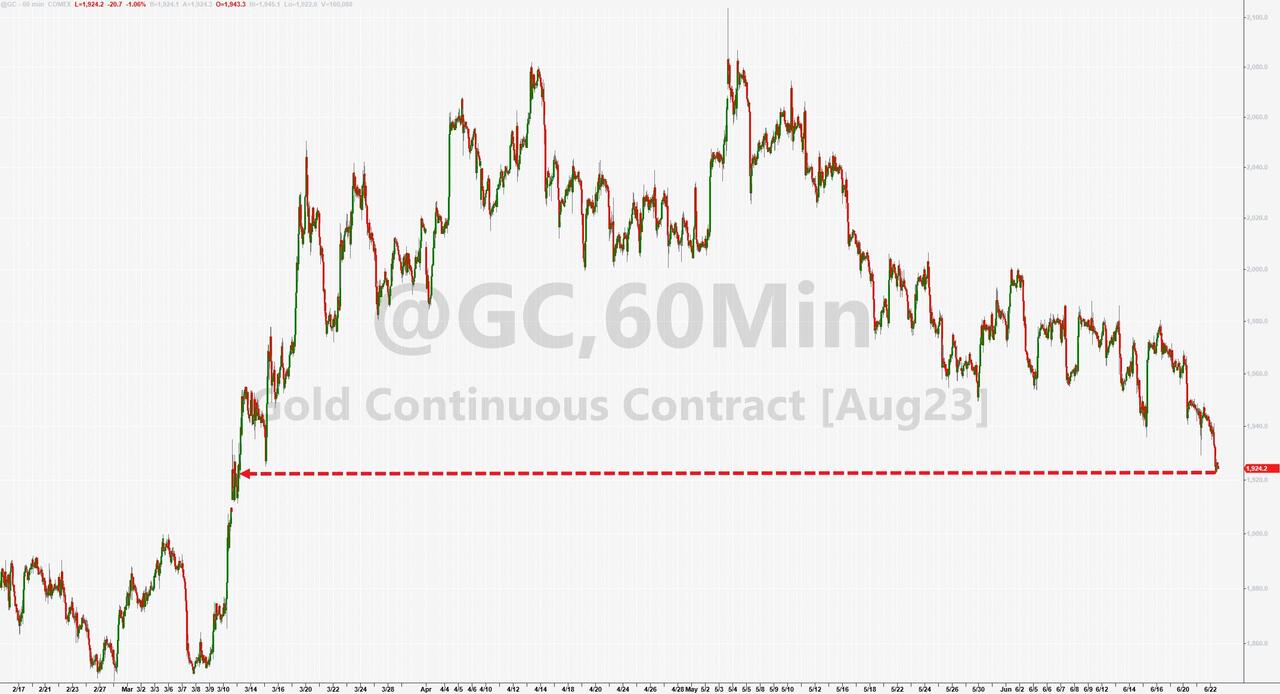
Banks continued to slide, bond yields rose, boosting the dollar and hurting gold, which sank to 3-month lows.
If you’re confused by all this market madness, you’re not alone. Cartoonist Bob Mankoff summed it up for you in this hilarious illustration:

- “Buy” Cycle Suggestions
The current Buy cycle began on 12/1/2022, and I gave you some ETF tips based on my StatSheet back then. But if you joined me later, you might want to check out the latest StatSheet, which I update and post every Thursday at 6:30 pm PST.
You should also think about how much risk you can handle when picking your ETFs. If you are more cautious, you might want to go for the ones in the middle of the M-Index rankings. And if you don’t want to go all in, you can start with a 33% exposure and see how it goes.
We are in a crazy time, with the economy going downhill and some earnings taking a hit. That will eventually drag down stock prices too. So, in my advisor’s practice, we are looking for some value, growth and dividend ETFs that can weather the storm. And of course, gold is always a good friend.
Whatever you invest in, don’t forget to use a trailing sell stop of 8-12% to protect yourself from big losses.
- Trend Tracking Indexes (TTIs)
The S&P 500 barely closed higher, thanks to some bargain hunting in the tech sector. Our Trend Tracking Indexes (TTIs) moved lower and diverged from the index, getting closer to our trend line. We are still in bullish territory for now.
This is how we closed 06/22/2023:
Domestic TTI: +2.69% above its M/A (prior close +3.12%)—Buy signal effective 12/1/2022.
International TTI: +7.54% above its M/A (prior close +8.10%)—Buy signal effective 12/1/2022.
All linked charts above are courtesy of Bloomberg via ZeroHedge.
Contact Ulli