Stocks Rally Despite Earnings Gloom and Fed Silence

Ulli Market Commentary Contact

[Chart courtesy of MarketWatch.com]

  1. Moving the markets

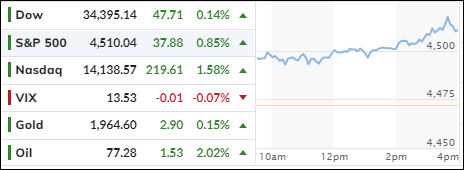
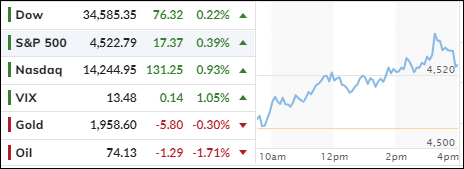
The bulls were in charge as the market awaited earnings reports from big banks like BofA, Morgan Stanley and Goldman Sachs.

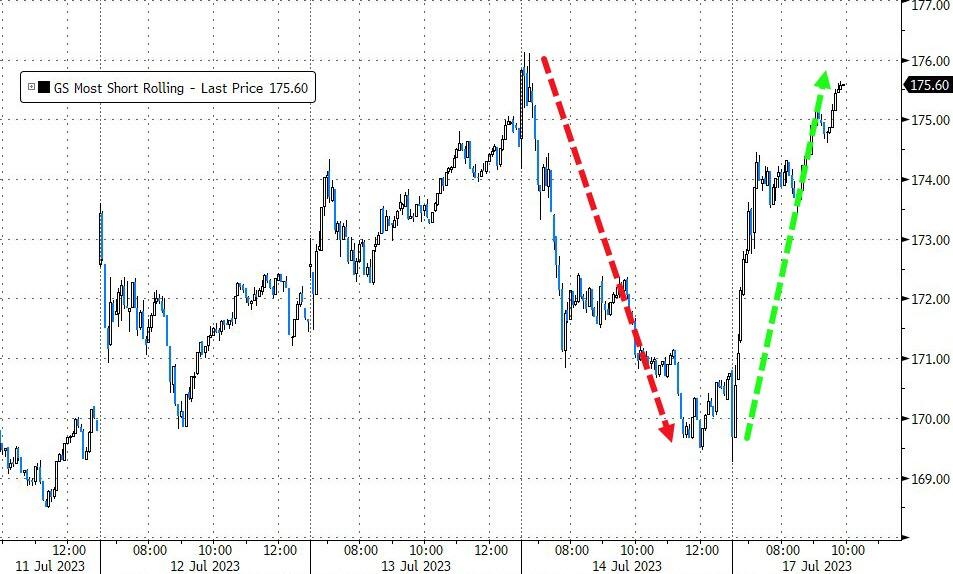
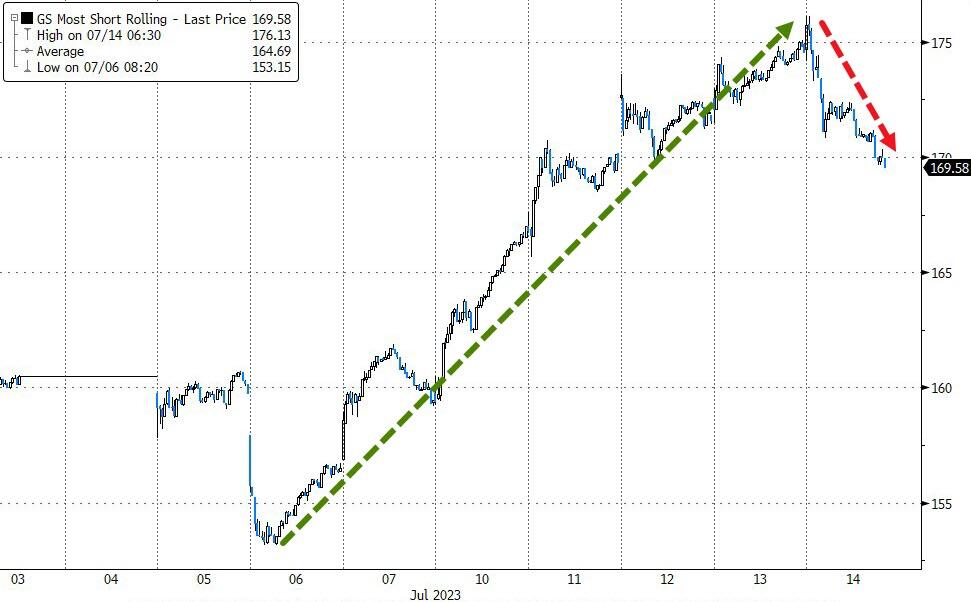
The major indexes ended the day in positive territory, thanks to another round of short squeezing. Even tech giants like Apple, Tesla and JPMorgan saw their shares rise, despite the gloomy outlook for the earnings season.

Analysts expect a 7% drop in S&P 500 earnings compared to last year, according to FactSet. So how can stocks keep soaring at these lofty levels?

Maybe it’s because of the wishful thinking expressed by Yardeni Research:

“I think the market is kind of overjoyed with the disinflationary, soft-landing scenario. I’ve been thinking for quite some time that we’re in a recession, but I argued that it’s a rolling recession, not an economy-wide recession. Now I think we’re in a rolling recovery.”

Sure, buddy. This week also marks the start of the Fed’s blackout period when Fed officials and staff zip their lips about the economy and monetary policy. The idea is to avoid messing with the market’s expectations or confusing anyone about the Fed’s plans before and after the FOMC meetings, where the Fed decides on interest rates and other monetary tools.

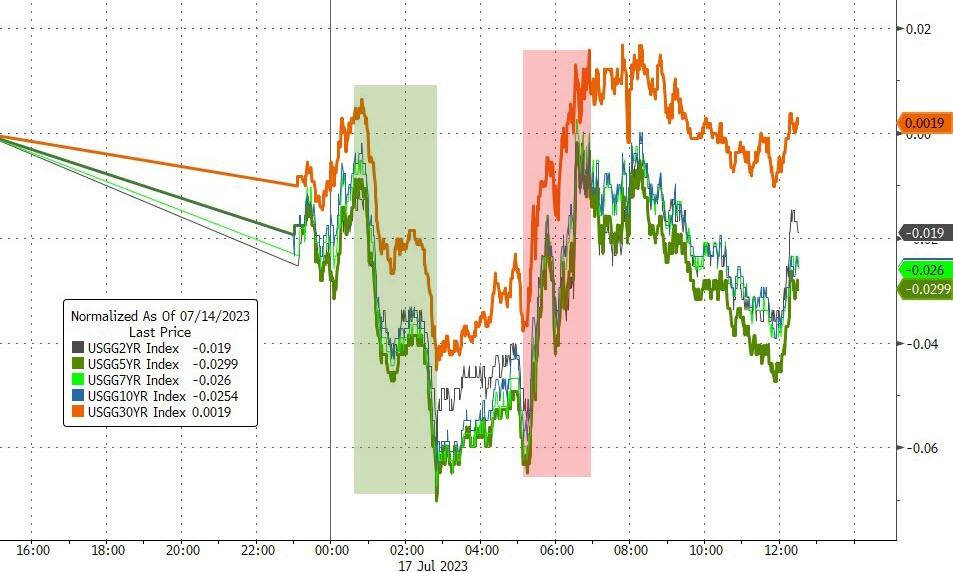
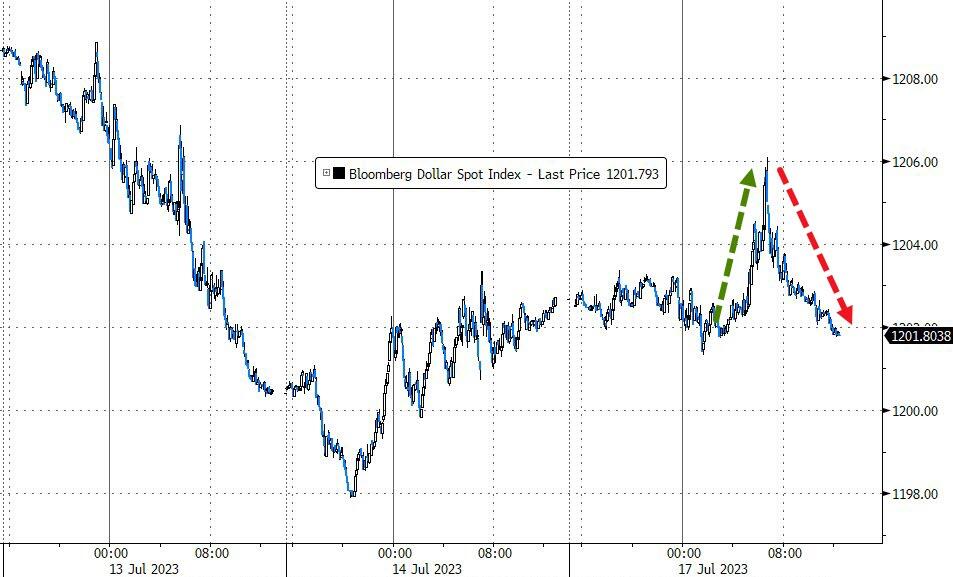
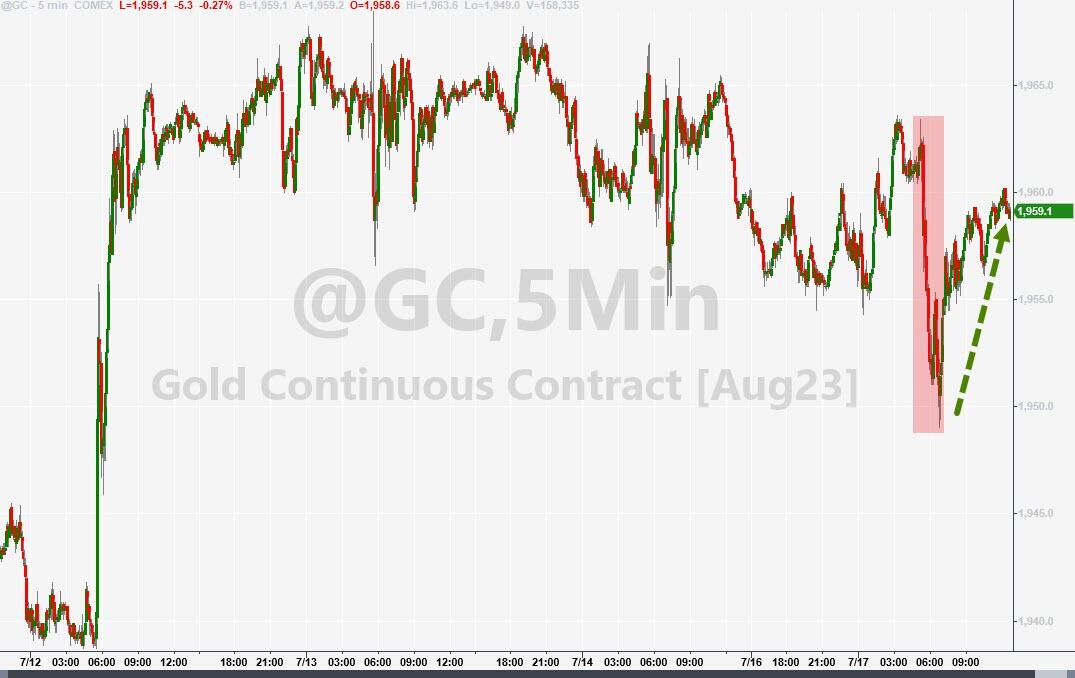
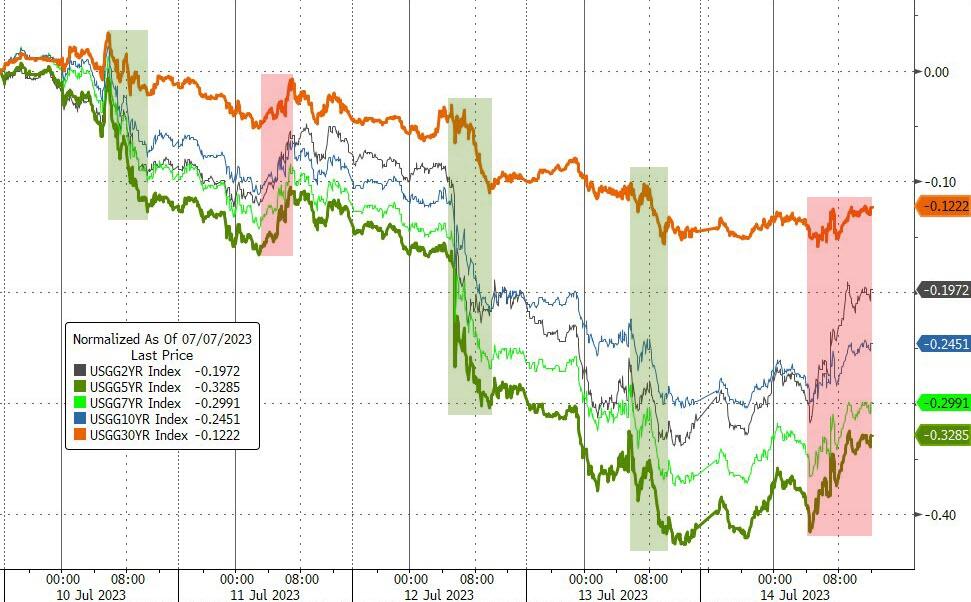
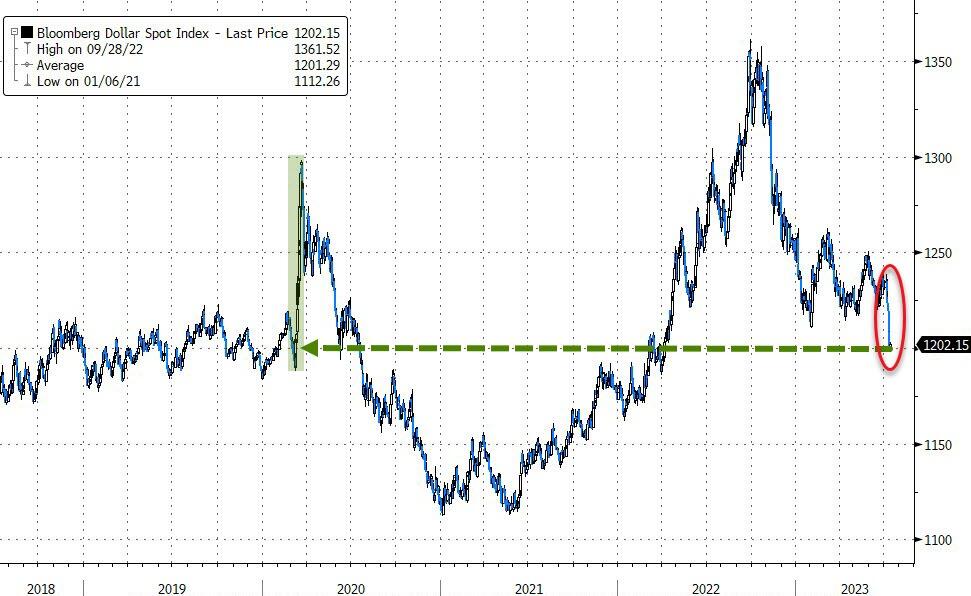
Bond yields were mixed, the US Dollar spiked and then dropped, Gold slid lower but recovered in the end.

Billionaire investor Seth Klarman is not buying into the current hype:

“You had a bubble, it was really a credit bubble, which became an everything bubble, and super-low interest rates, at times zero rates, made capital easily available and incredibly cheap.

That fueled frenzy over startups, SPACs, meme stocks and crypto, and all kinds of risky bets. I’m just not sure why you couldn’t have more trouble.

We haven’t seen a lot of casualties yet, I don’t know what that means, but I’d be worried.”

In other words, don’t get too greedy and be ready to bail if this bubble pops.

Read More
ETFs On The Cutline – Updated Through 07/14/2023

Ulli ETFs on the Cutline Contact

Do you want to know which ETFs are hot and which ones are not? Then you need my High-Volume ETF Cutline report. It tells you how close or far each of the 311 ETFs I follow is from its long-term trend line (39-week SMA). These are the ETFs that trade more than $5 million a day, so they are not some obscure funds that nobody cares about.

The report is split into two parts: The winners that are above their trend line (%M/A), and the losers that are below it. The yellow line is the line of shame that separates them. You can see how many ETFs are in each group and how they have changed since the last report (153 vs. 217 current).

Take a peek:

The HV ETF Master Cutline Report

If you are confused by some of the terms we use, don’t panic. I have a helpful Glossary of Terms for you.

If you want to learn more about the Cutline method and how it can make you rich (or at least less poor), read my original post here.

ETF Tracker Newsletter For July 14, 2023

Ulli ETF Tracker Contact

ETF Tracker StatSheet          

You can view the latest version here.

DOW CLINGS TO GAINS AS EARNINGS SEASON BEGINS

[Chart courtesy of MarketWatch.com]

  1. Moving the markets

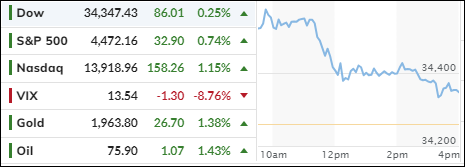
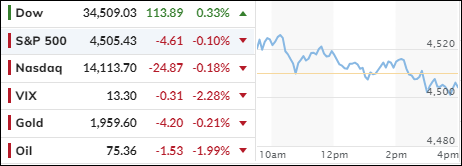
The Dow managed to squeeze out another positive close, thanks to strong bank earnings that beat the low bar set by analysts. The S&P 500 and Nasdaq started off strong, but lost steam and ended in the red. Still, both hit their highest levels since April 2022.

Analysts are bracing for a dismal earnings season, with S&P 500 profits expected to fall by about 7% year-over-year, according to FactSet. That would be the worst performance since the second quarter of 2020, when earnings plunged by 31.6%.

You might wonder how the stock market can stay so high amid such gloomy prospects. One reason is the hope that inflation is easing, based on recent economic data. Traders are betting that the economy can keep growing without overheating, despite the Fed’s hawkish signals. So far, their optimism has paid off.

The “Goldilocks” scenario is still alive: “not too hot, not too cold, but just right.” The Citi Surprise index shows that economic data has been mostly positive and above expectations. But the Fed is the ultimate judge of whether this fairy tale can last.

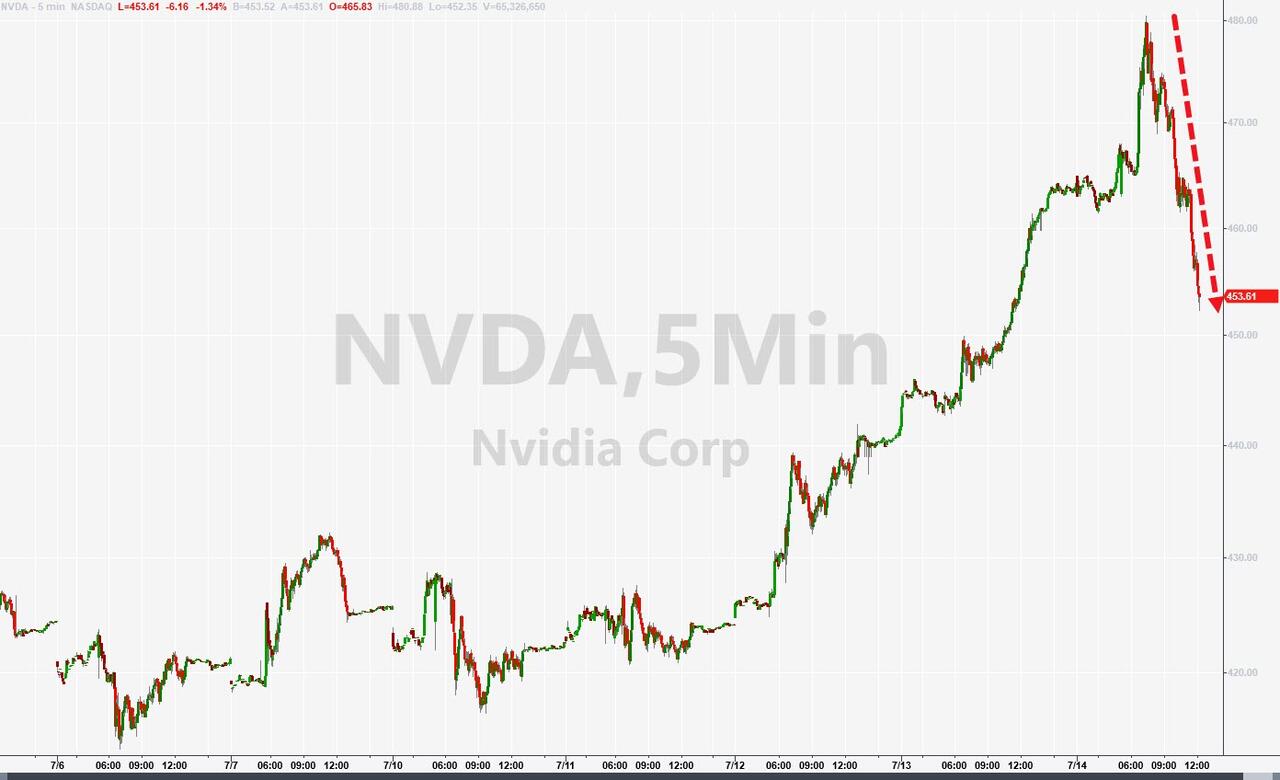
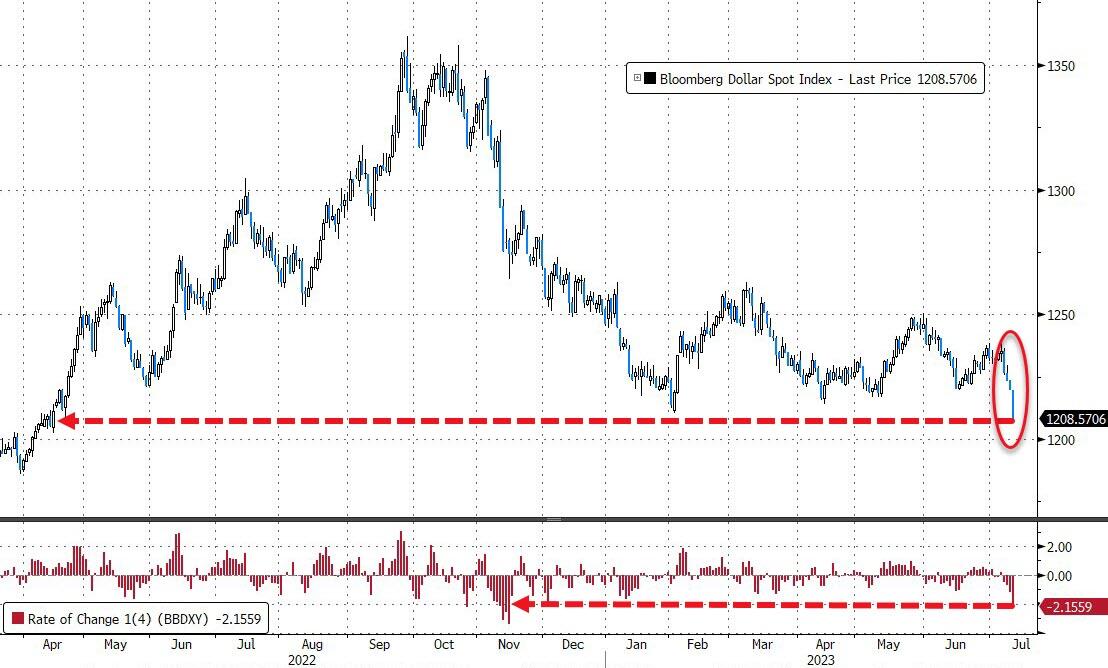
The short squeeze frenzy fizzled out today, while tech giant Nvidia gave up its early gains and turned negative. Bond yields bounced back today, with the 10-year approaching 4%, but falling short. The dollar has been on a losing streak, posting its second biggest weekly drop since March 2020.

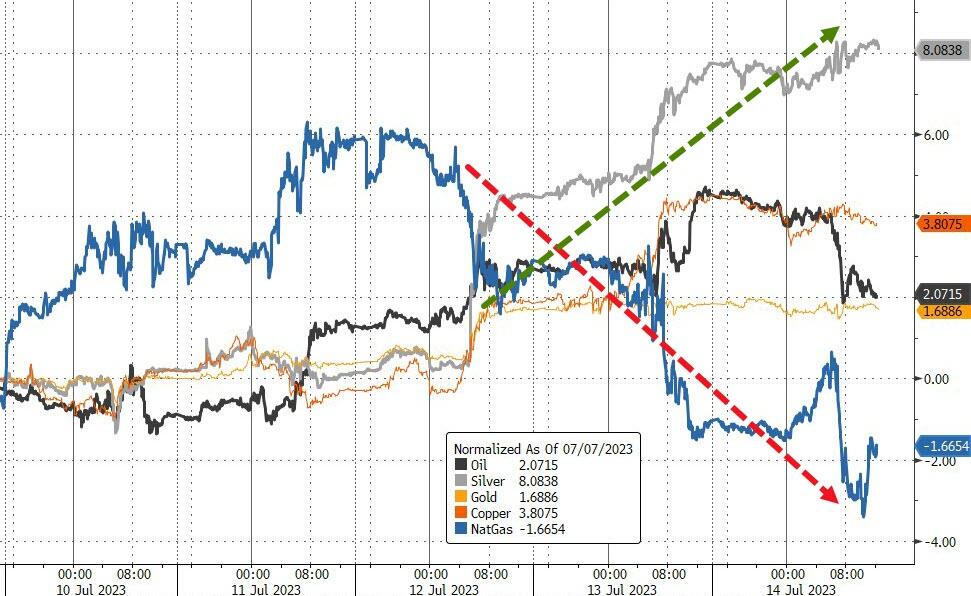
The precious metals market was busy this week, with silver outshining gold and other commodities.

Next week, earnings season will ramp up, and we will see if low expectations can justify high valuations.

Read More
Weekly StatSheet For The ETF Tracker Newsletter – Updated Through 07/13/2023

Ulli ETF StatSheet Contact

ETF Data updated through Thursday, July 13, 2023

How to use this StatSheet:

  1. Out of the 1,800+ ETFs out there, I only pick the ones that trade over $5 million per day (HV ETFs), so you don’t get stuck with a lemon that nobody wants to buy or sell.
  1. Trend Tracking Indexes (TTIs)

These are the main indicators that tell you when to buy or sell Domestic and International ETFs (section 1 and 2). They do that by comparing their position to their long-term M/A (Moving Average). If they cross above, and stay there, it’s a green light to buy. If they fall below, and keep going, it’s a red light to sell. And to make sure you don’t lose your shirt if things go south, I also use a 12% trailing stop loss on all positions in these categories.

  1. All other investment areas don’t have a TTI and should be traded based on the position of each ETF relative to its own trend line (%M/A). That’s why I call them “Selective Buy.” In other words, if an ETF goes above its own trend line, you can buy it. But don’t forget to use a trailing sell stop of 12%, or less if you’re feeling nervous.

If some of these words sound like Greek to you, please check out the Glossary of Terms and new subscriber information in section 9.

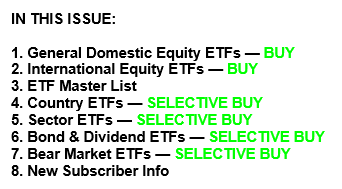
  1. DOMESTIC EQUITY ETFs: BUY— since 12/01/2022

Click on chart to enlarge

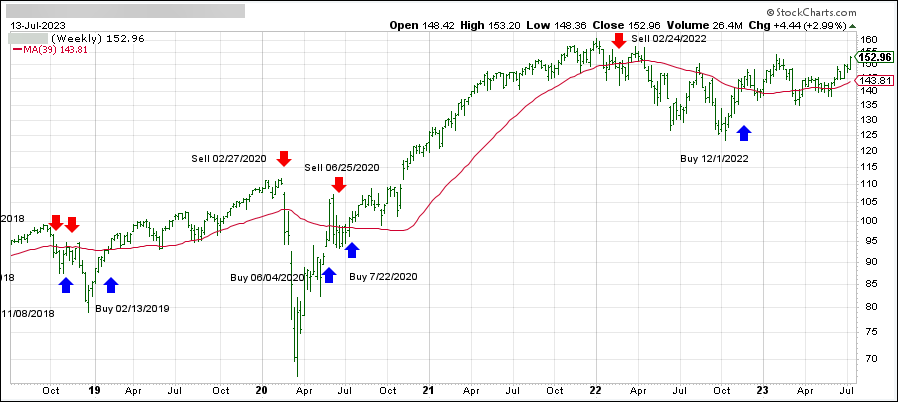
This is our main compass, the Domestic Trend Tracking Index (TTI-green line in the above chart). It has now broken above its long-term trend line (red) by +6.87% and remains in “Buy” mode.

Read More
Dollar Slumps As Inflation Data Boosts Stocks

Ulli Uncategorized Contact

[Chart courtesy of MarketWatch.com]

  1. Moving the markets

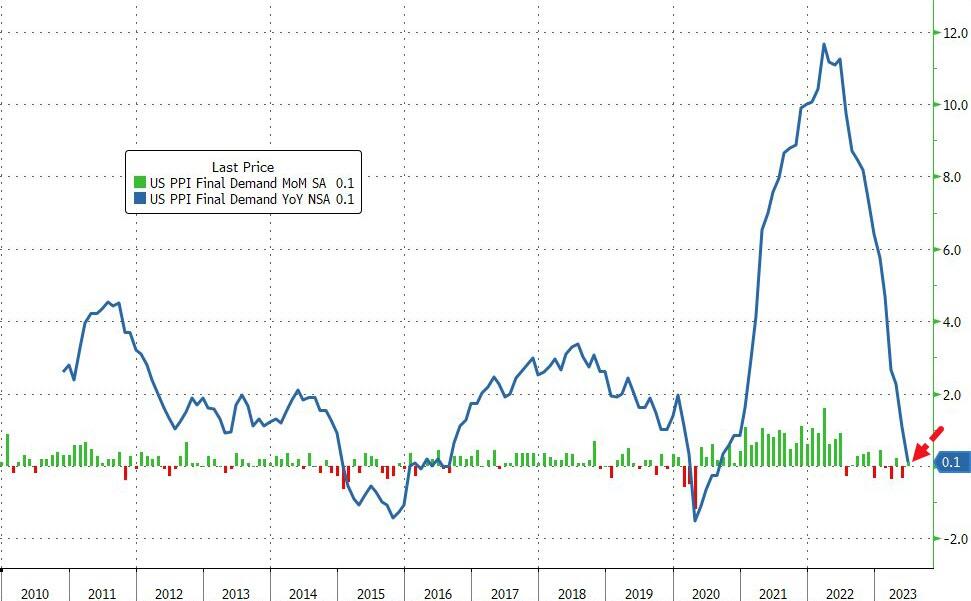
The stock market celebrated another day of low inflation, as the Producer Price Index (PPI) for June came in much weaker than expected. The PPI measures the change in prices that producers charge for their goods and services. It was supposed to rise by 0.4% year-over-year, but it barely budged at 0.1%.

This was music to the ears of Wall Street, which loves cheap money and hates high interest rates. The major indexes rallied for the fourth day in a row, except for the Dow, which fizzled out after a strong start and ended with a tiny gain.

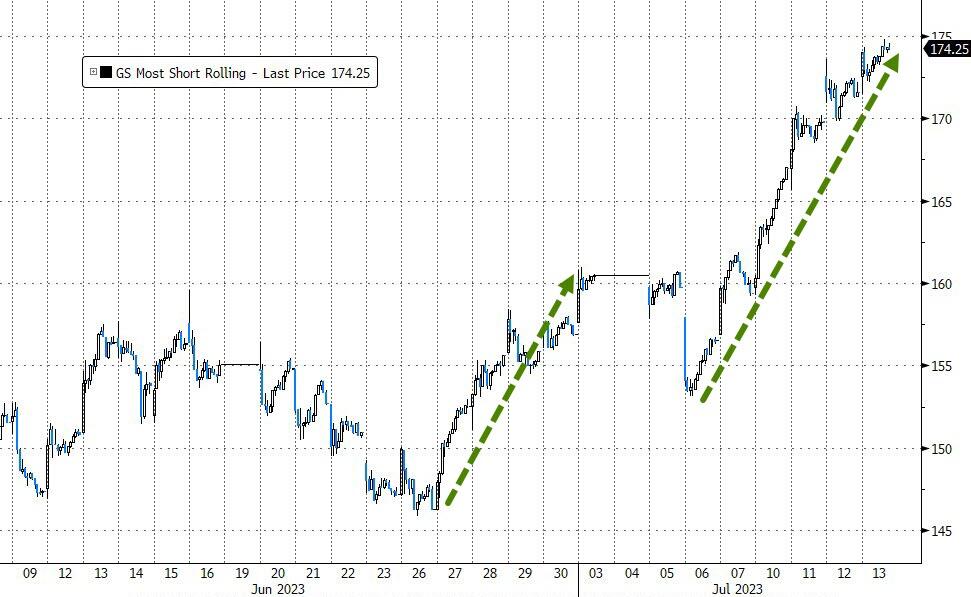
The short sellers, who bet against the market, got squeezed again and had to cover their losses by buying back the stocks they sold. The PPI report followed yesterday’s Consumer Price Index (CPI), which also showed a slower pace of inflation than anticipated.

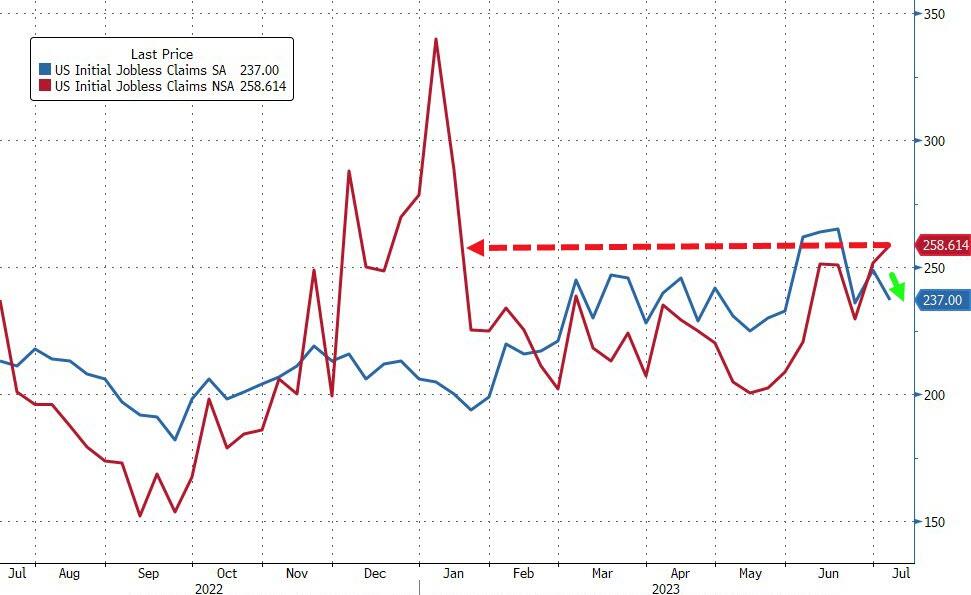
However, the labor market remains tight, as the weekly jobless claims did not fall as much as hoped. In fact, without some seasonal adjustments, they would have risen to the highest level since January.

The market’s reaction to these reports was to lower its expectations for future rate hikes by the Federal Reserve. Traders now think that the Fed will raise rates by 0.25% later this month, but then pause until next year and even cut rates in January 2024. That sounds too good to be true, and I’m not sure if the market is being realistic or delusional.

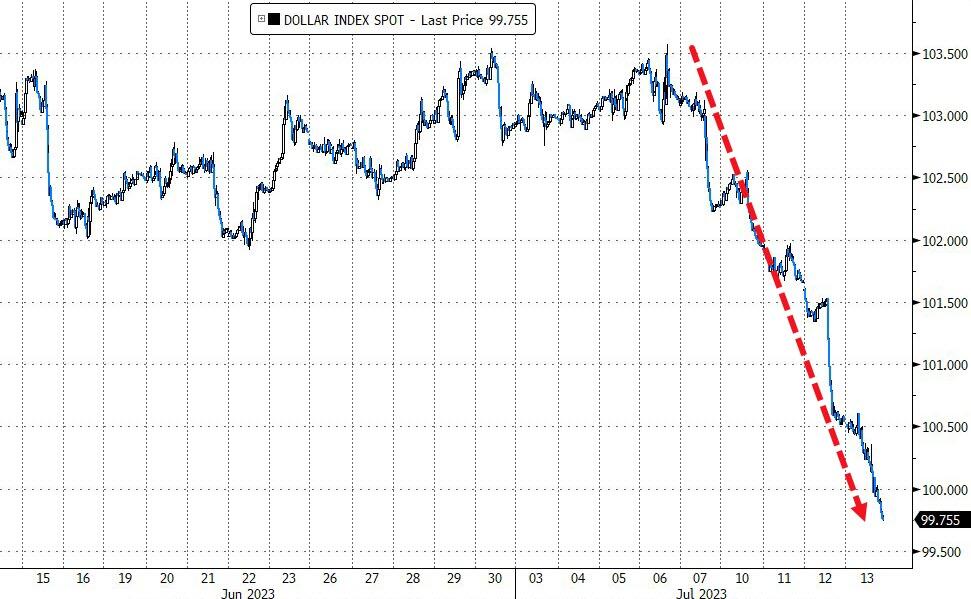
The dollar took a beating and dropped for the sixth consecutive day, which was its worst streak since July 2020. And that’s the problem. A weaker dollar makes imports more expensive and fuels inflation, which could force the Fed to raise rates faster and more aggressively than the market expects.

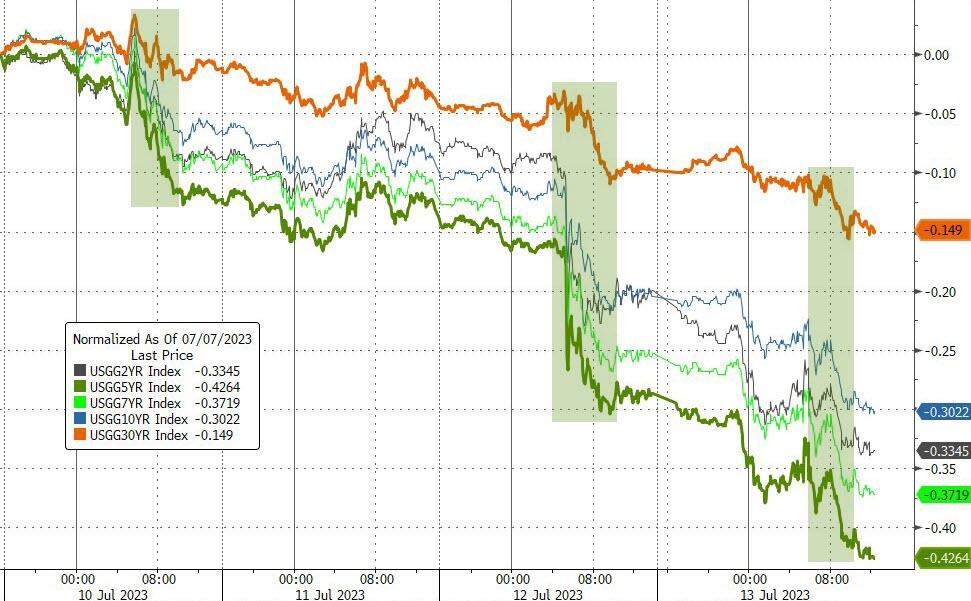
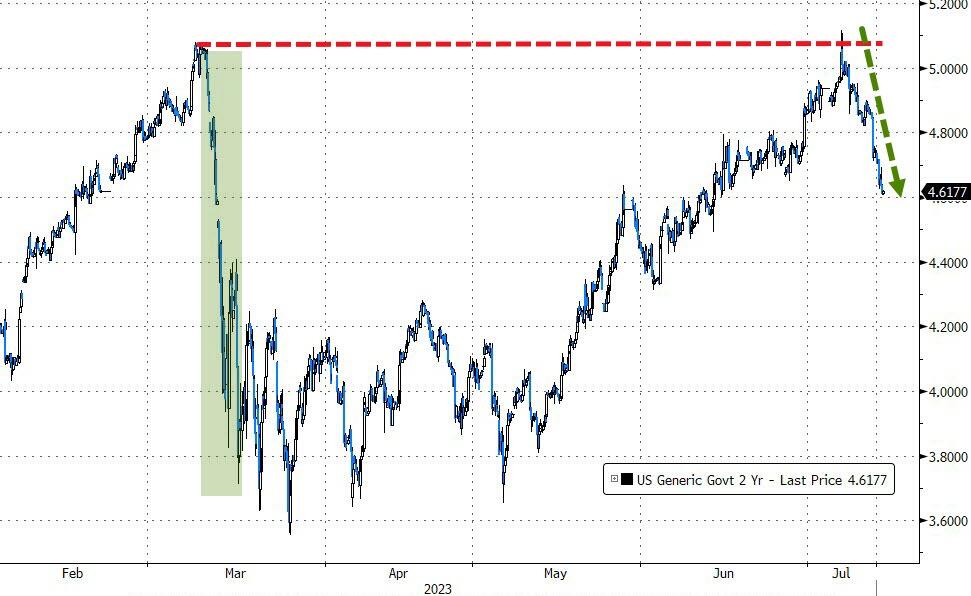
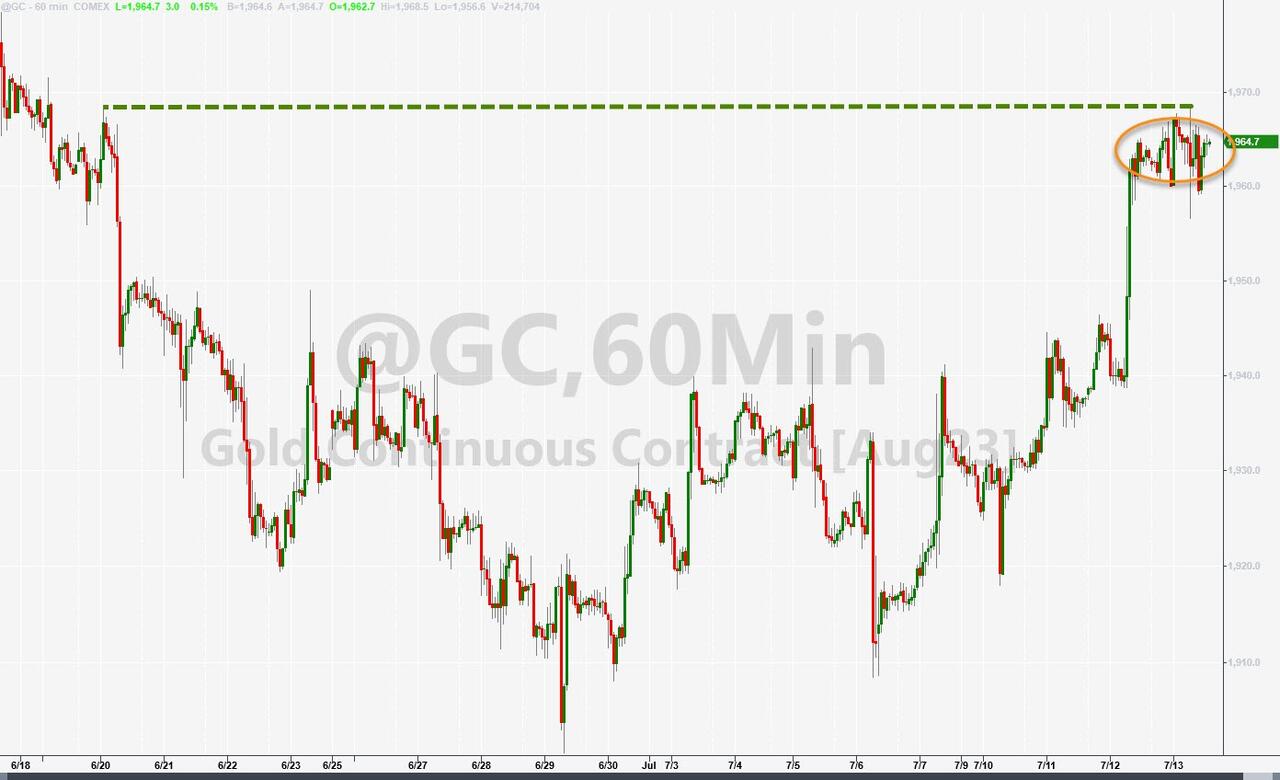
Bond yields fell, with the 2-year yield hitting 4.6%, while gold drifted sideways but kept its gains from yesterday.

Tomorrow, we will see the start of the earnings season, with the big banks reporting first. Expect some swings in the market, but also some positive surprises.

Why?

Because the earnings expectations are so low that even a turtle could clear them.

Read More
Inflation Eases, Stocks Soar, Bonds Breathe

Ulli Market Commentary Contact

[Chart courtesy of MarketWatch.com]

  1. Moving the markets

The latest CPI report was a pleasant surprise for Wall Street, as US consumer prices rose less than expected in June. The core CPI, which excludes food and energy, increased by only 0.2% month-over-month, the smallest gain since February 2020.

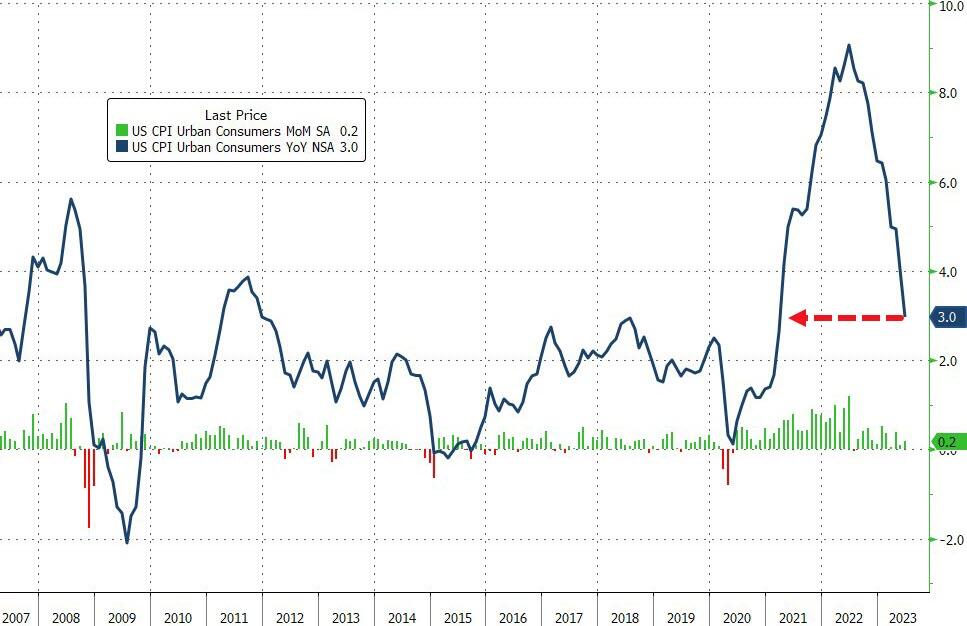
The annual inflation rate eased to 3.0%, the lowest since March 2021. This was music to the ears of traders and algos, who celebrated by lifting the S&P 500 to a new record intra-day high.

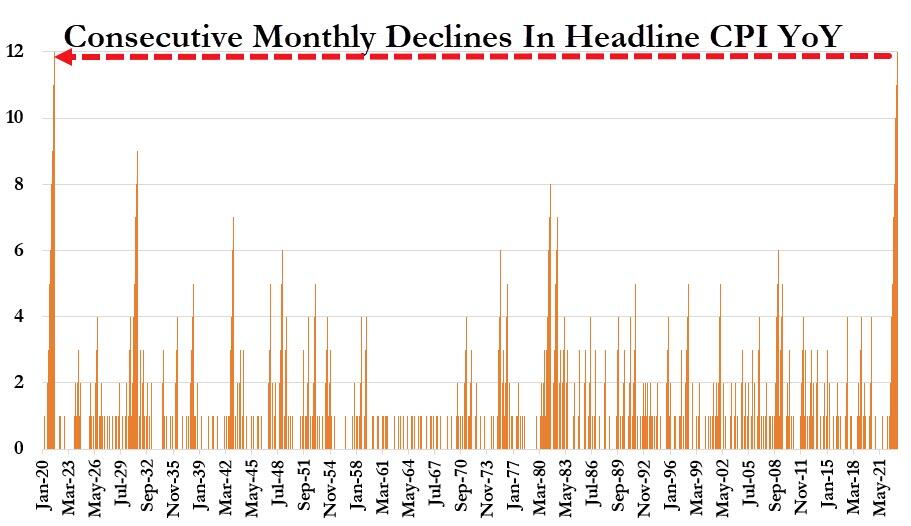
They were also encouraged by the fact that headline inflation has been slowing down for 12 consecutive months, suggesting that the worst of the inflation scare is over. But is it really?

Some analysts were not so optimistic, pointing out that the Fed still has to deal with some sticky sources of inflation, such as services, wages and housing. These components have moderated a bit, but they are still running too hot for comfort. That means the Fed will likely keep tightening its monetary policy, at least for now.

Traders, however, seem to think that the Fed is almost done raising rates, ignoring the fact that the cost of capital is now 5% higher than it was when the market was at similar levels and rates were near zero. Something doesn’t add up here.

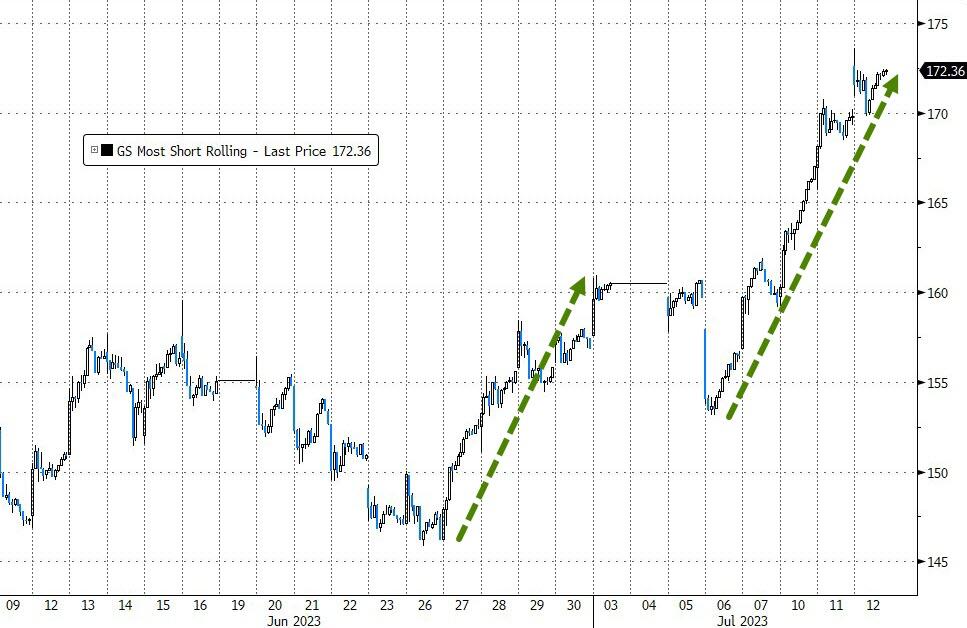
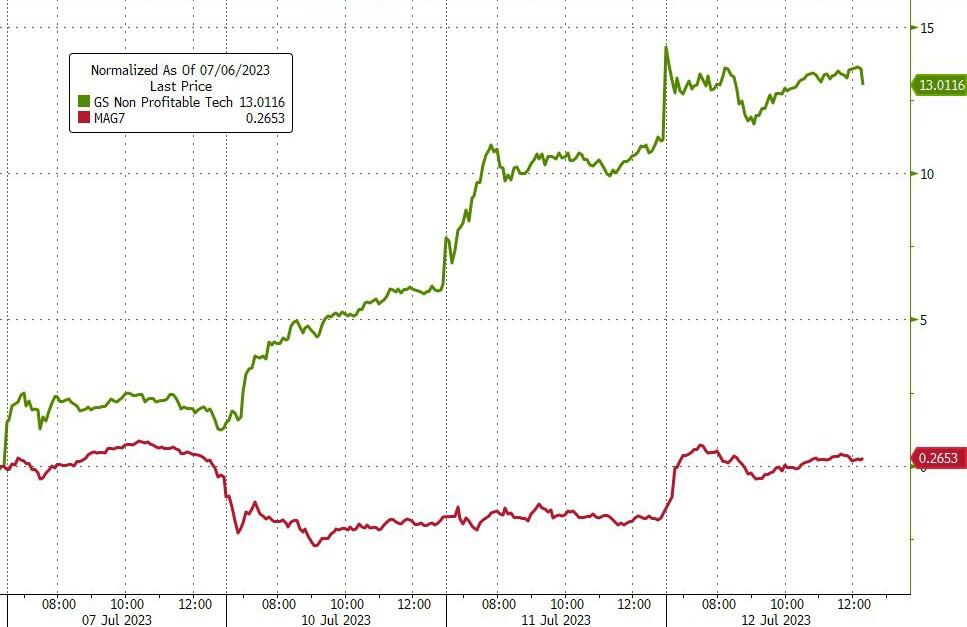
Of course, no rally is complete without a good old-fashioned short squeeze, and today we had plenty of that. Interestingly, some of the biggest winners were unprofitable tech stocks, which surged 13% in four days, while the seven most valuable companies in the world barely budged. Go figure.

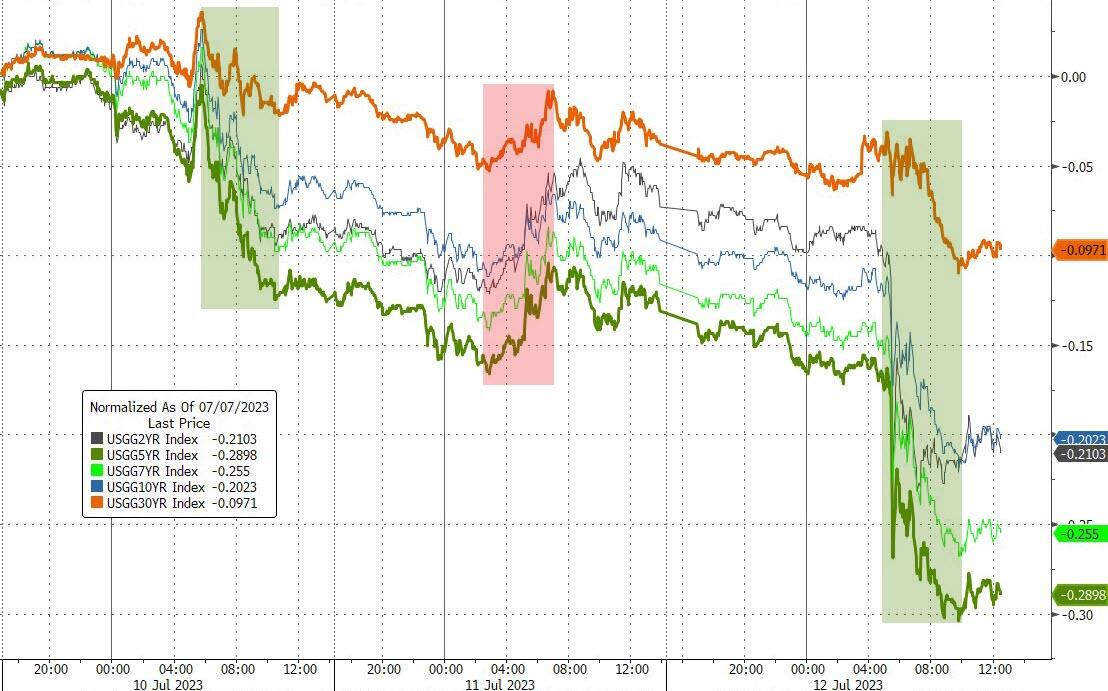
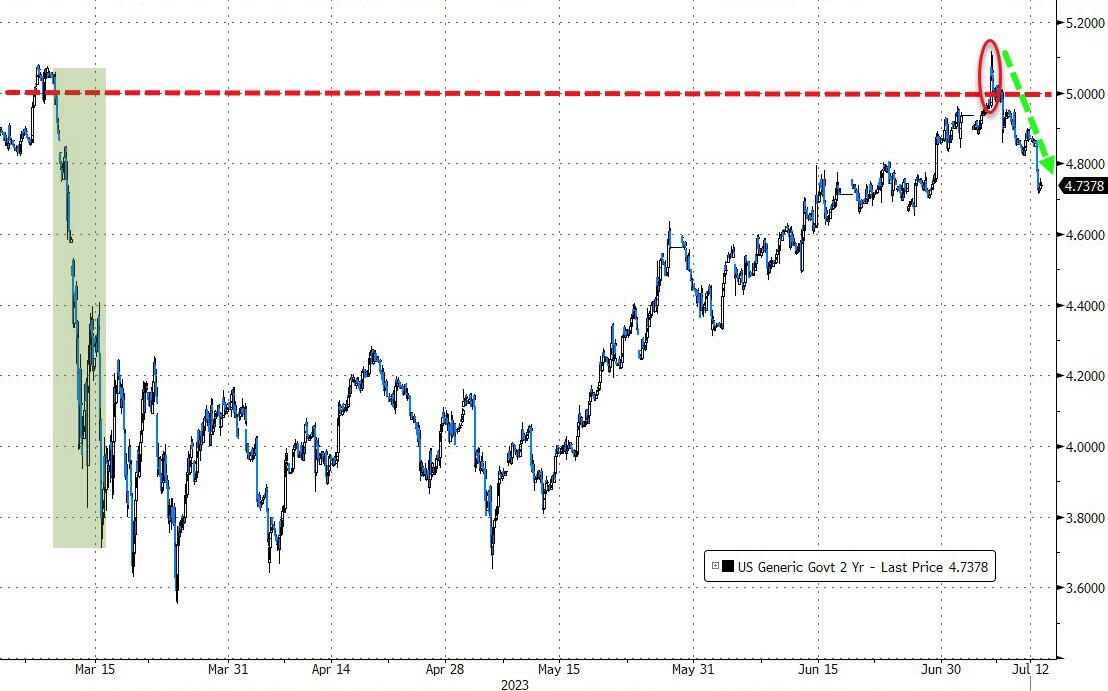
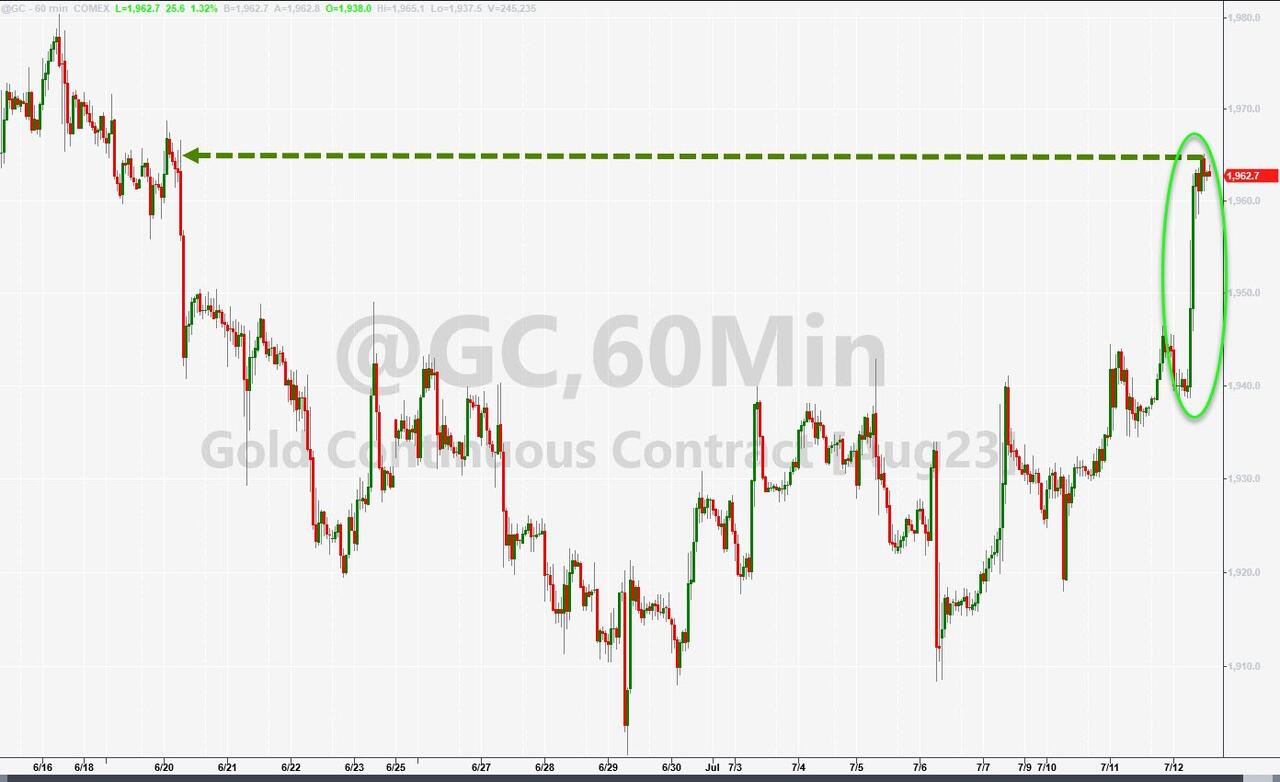
Bond yields also retreated, giving some relief to bond investors. The 2-year yield, which reflects the expectations of the Fed policy, fell almost 40 basis points from its recent high of over 5%. The dollar also took a beating and posted its biggest 4-day drop since April 2022. Gold shone brightly and climbed +1.38%.

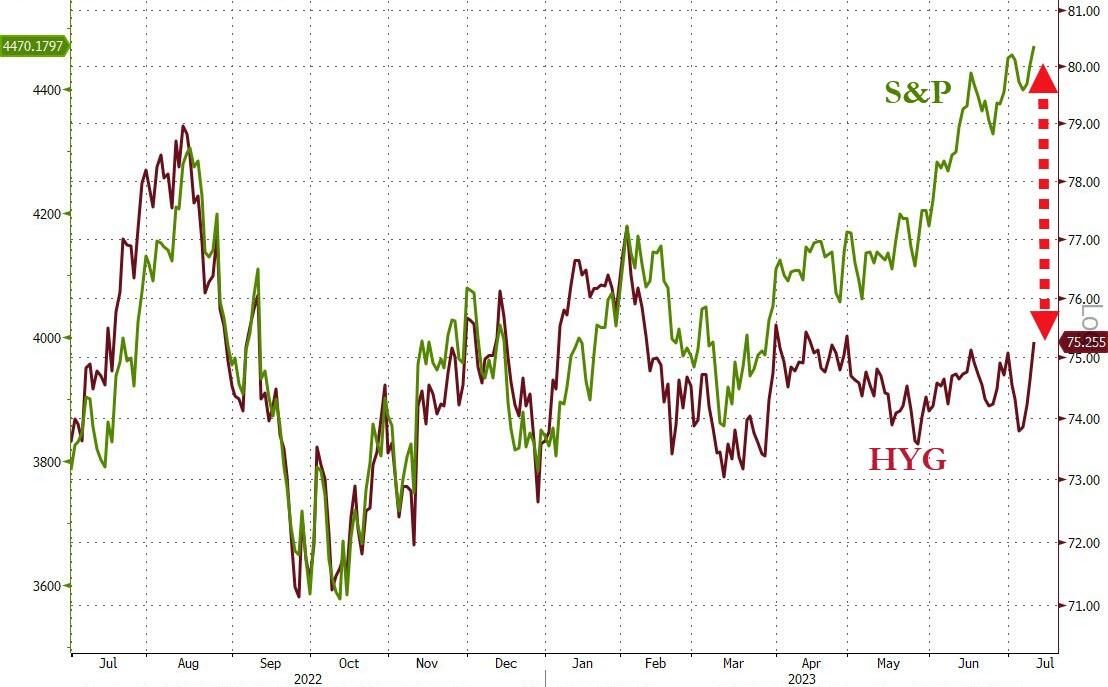
Tomorrow we’ll get another inflation report, this time on producer prices. If it comes in lower than expected, it could fuel more optimism in the market. On the other hand, if we look at the huge divergence between the S&P 500 and high-yield corporate bonds, we might wonder if this party can last much longer.

Read More