
- Moving the markets
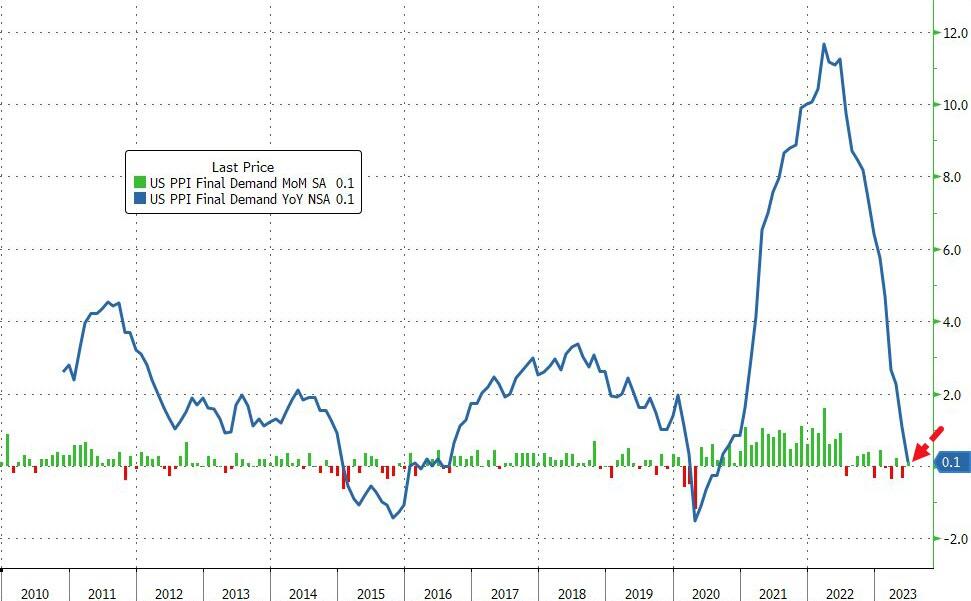
The stock market celebrated another day of low inflation, as the Producer Price Index (PPI) for June came in much weaker than expected. The PPI measures the change in prices that producers charge for their goods and services. It was supposed to rise by 0.4% year-over-year, but it barely budged at 0.1%.
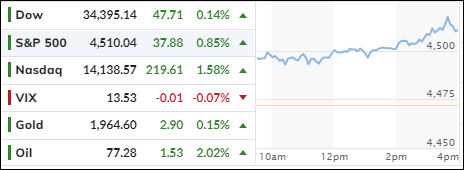
This was music to the ears of Wall Street, which loves cheap money and hates high interest rates. The major indexes rallied for the fourth day in a row, except for the Dow, which fizzled out after a strong start and ended with a tiny gain.
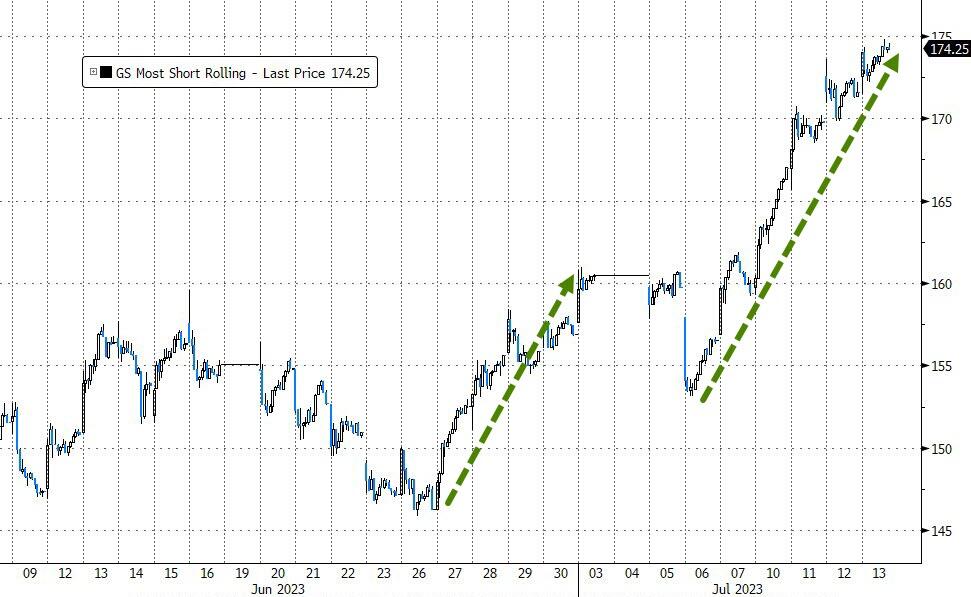
The short sellers, who bet against the market, got squeezed again and had to cover their losses by buying back the stocks they sold. The PPI report followed yesterday’s Consumer Price Index (CPI), which also showed a slower pace of inflation than anticipated.
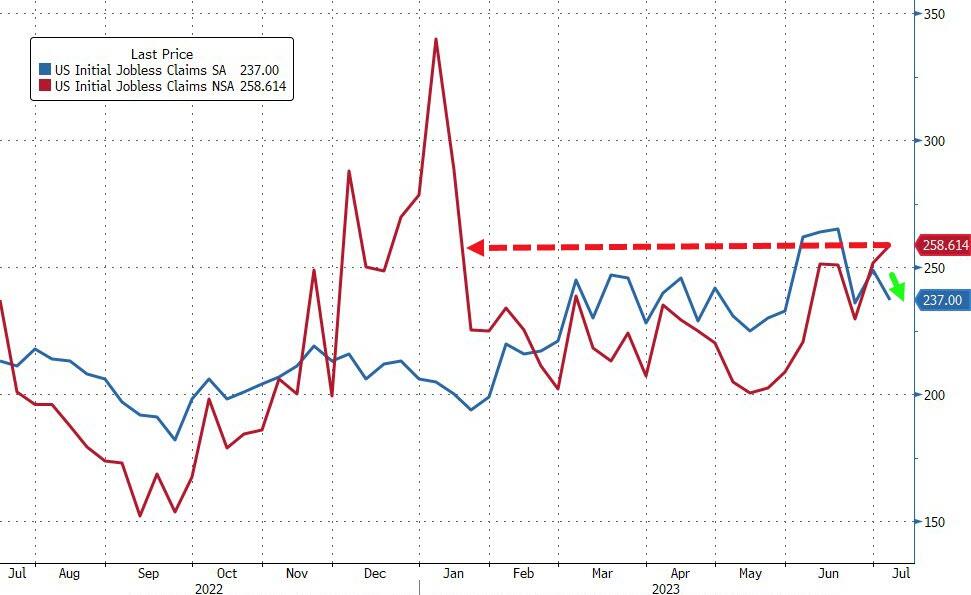
However, the labor market remains tight, as the weekly jobless claims did not fall as much as hoped. In fact, without some seasonal adjustments, they would have risen to the highest level since January.
The market’s reaction to these reports was to lower its expectations for future rate hikes by the Federal Reserve. Traders now think that the Fed will raise rates by 0.25% later this month, but then pause until next year and even cut rates in January 2024. That sounds too good to be true, and I’m not sure if the market is being realistic or delusional.
The dollar took a beating and dropped for the sixth consecutive day, which was its worst streak since July 2020. And that’s the problem. A weaker dollar makes imports more expensive and fuels inflation, which could force the Fed to raise rates faster and more aggressively than the market expects.
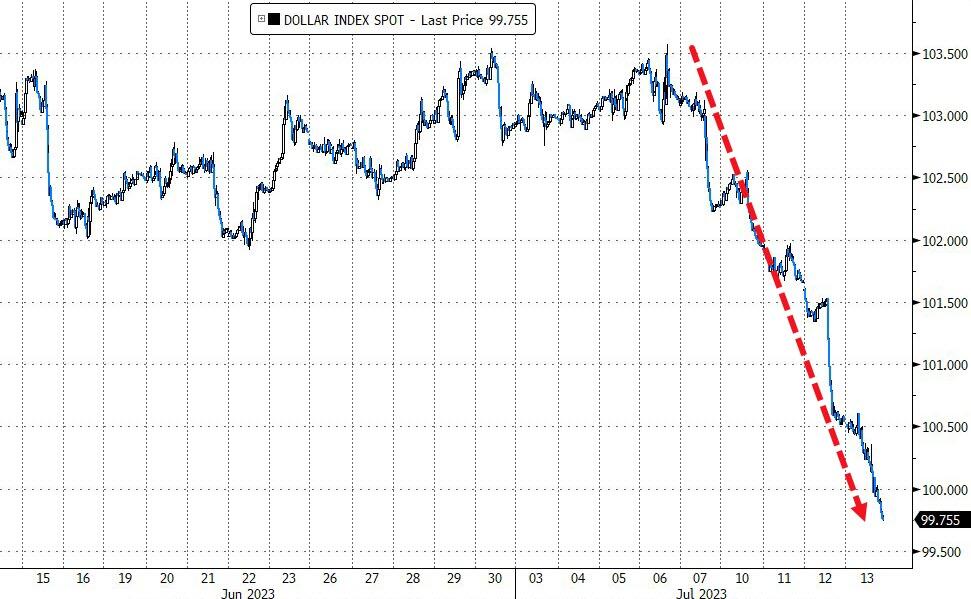
Bond yields fell, with the 2-year yield hitting 4.6%, while gold drifted sideways but kept its gains from yesterday.
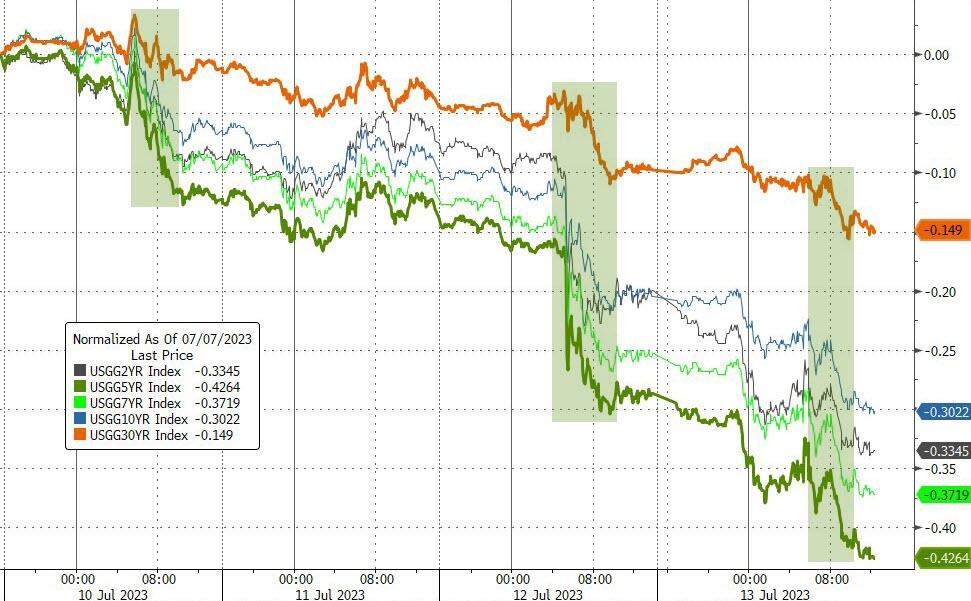
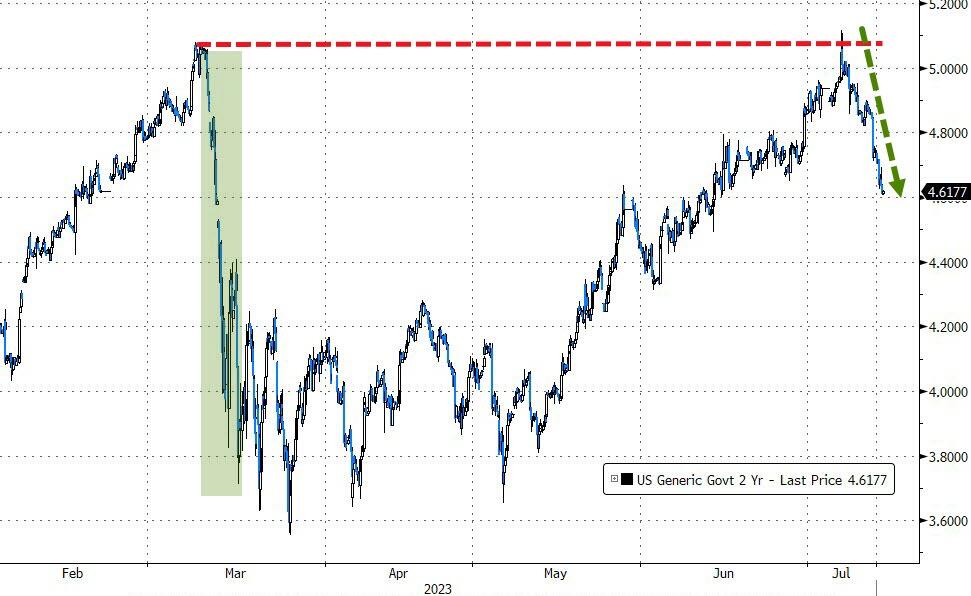
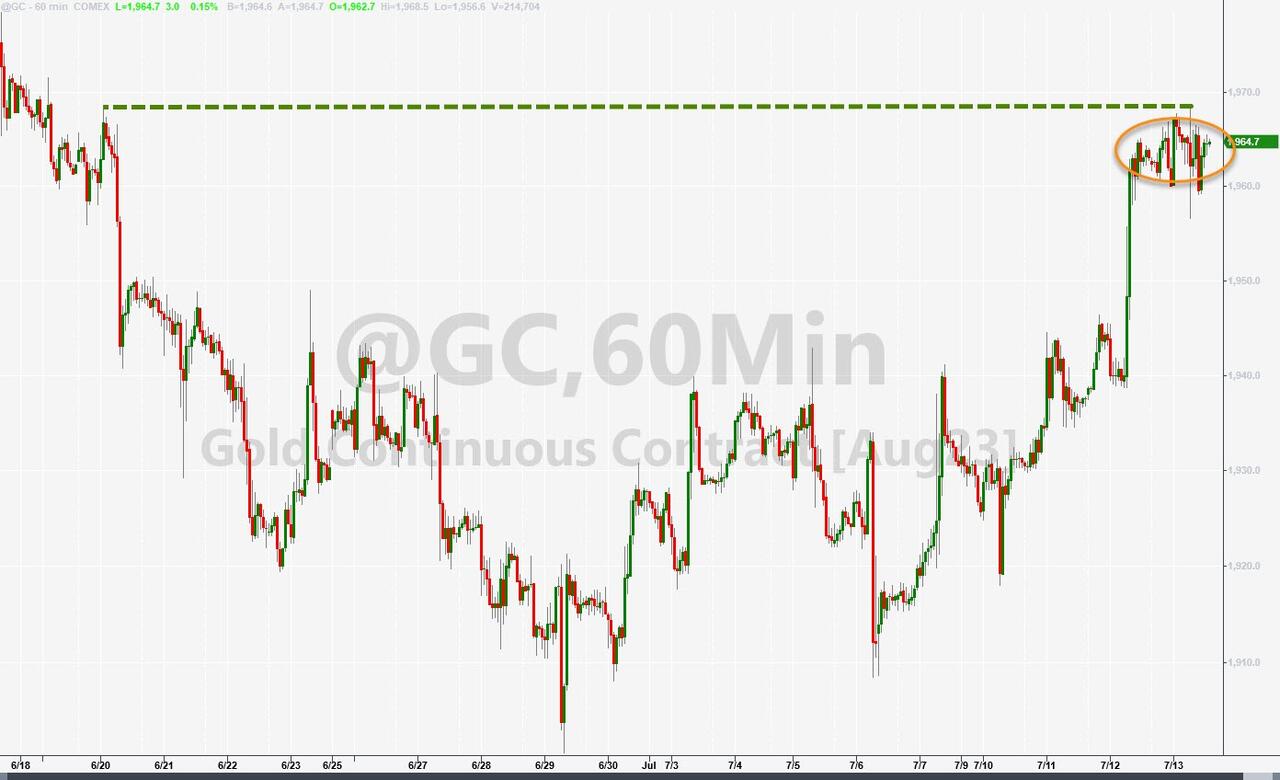
Tomorrow, we will see the start of the earnings season, with the big banks reporting first. Expect some swings in the market, but also some positive surprises.
Why?
Because the earnings expectations are so low that even a turtle could clear them.
- “Buy” Cycle Suggestions
The current Buy cycle began on 12/1/2022, and I gave you some ETF tips based on my StatSheet back then. But if you joined me later, you might want to check out the latest StatSheet, which I update and post every Thursday at 6:30 pm PST.
You should also think about how much risk you can handle when picking your ETFs. If you are more cautious, you might want to go for the ones in the middle of the M-Index rankings. And if you don’t want to go all in, you can start with a 33% exposure and see how it goes.
We are in a crazy time, with the economy going downhill and some earnings taking a hit. That will eventually drag down stock prices too. So, in my advisor’s practice, we are looking for some value, growth and dividend ETFs that can weather the storm. And of course, gold is always a good friend.
Whatever you invest in, don’t forget to use a trailing sell stop of 8-12% to protect yourself from big losses.
- Trend Tracking Indexes (TTIs)
The Producer Price Index (PPI), which measures the change in prices that producers charge for their goods and services, matched the previous Consumer Price Index (CPI), which measures the change in prices that consumers pay for goods and services.
Both reports showed a slower pace of inflation than expected, which encouraged the bulls to push the stock market higher. Our Trend Tracking Indexes (TTIs), which track the direction and strength of the market trends, widened their bullish gap, with the International TTI outperforming the Domestic TTI.
This is how we closed 07/13/2023:
Domestic TTI: +6.87% above its M/A (prior close +6.36%)—Buy signal effective 12/1/2022.
International TTI: +9.30% above its M/A (prior close +8.16%)—Buy signal effective 12/1/2022.
All linked charts above are courtesy of Bloomberg via ZeroHedge.
Contact Ulli