Market Rises On Short Squeeze And CPI Optimism

Ulli Market Commentary Contact

[Chart courtesy of MarketWatch.com]

  1. Moving the markets

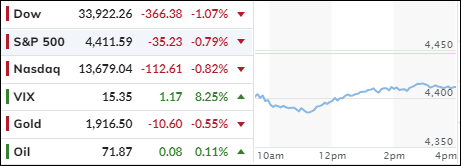
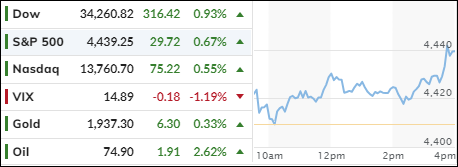
The major indexes climbed higher for the second day in a row, as investors waited for the latest inflation report due tomorrow. The report is expected to show a slight drop in the annual inflation rate to 3.1%, which would ease some of the worries about rising rates.

Investors have already accepted that the Fed will hike interest rates by 0.25% at its next meeting on July 25-26. The question is what the Fed will do in September, given the strong job growth in recent months. The Fed doesn’t want to see wages and prices go up too fast, so it may signal more rate hikes to come.

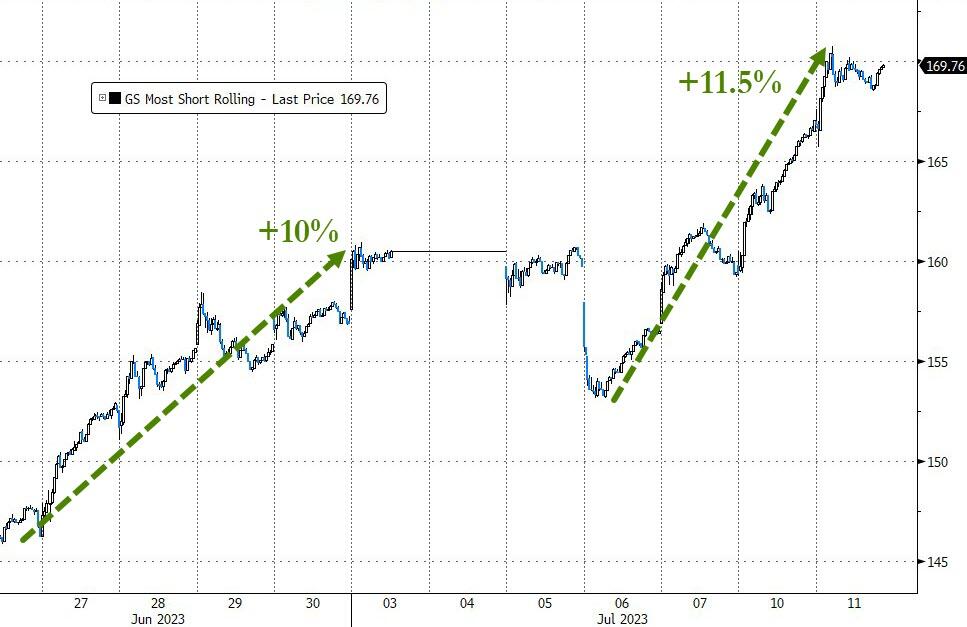
The market rally today was driven by a short squeeze, which pushed up the Small Caps stocks, especially in the last half hour of trading. Some investors jumped on the bandwagon, fearing they would miss out on the gains.

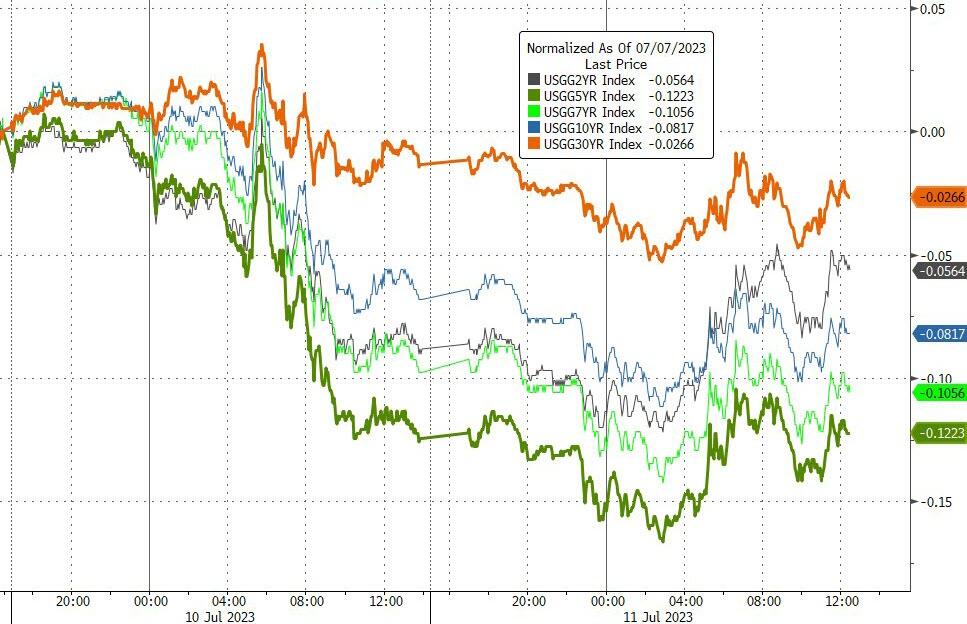
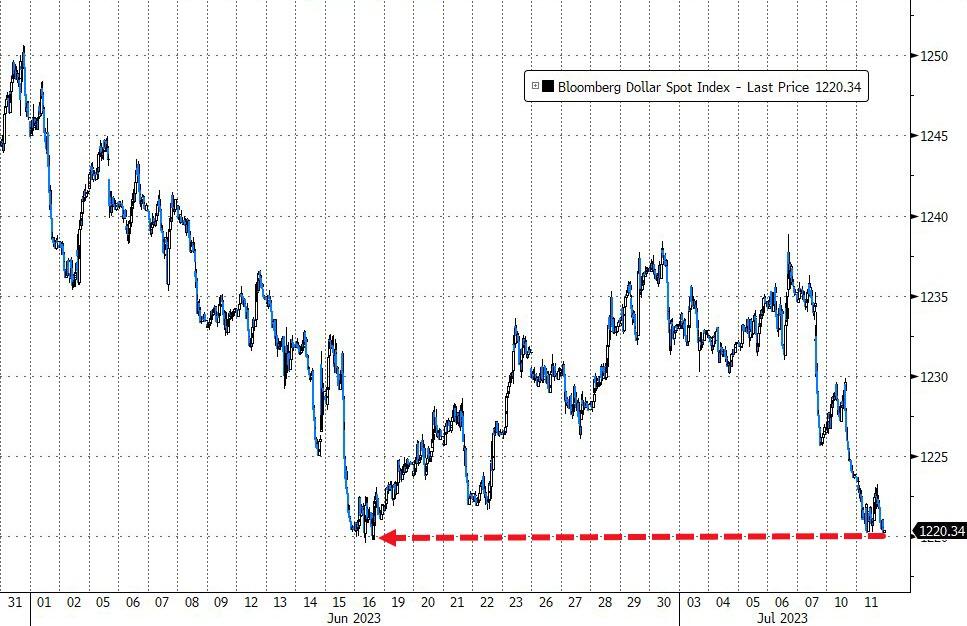
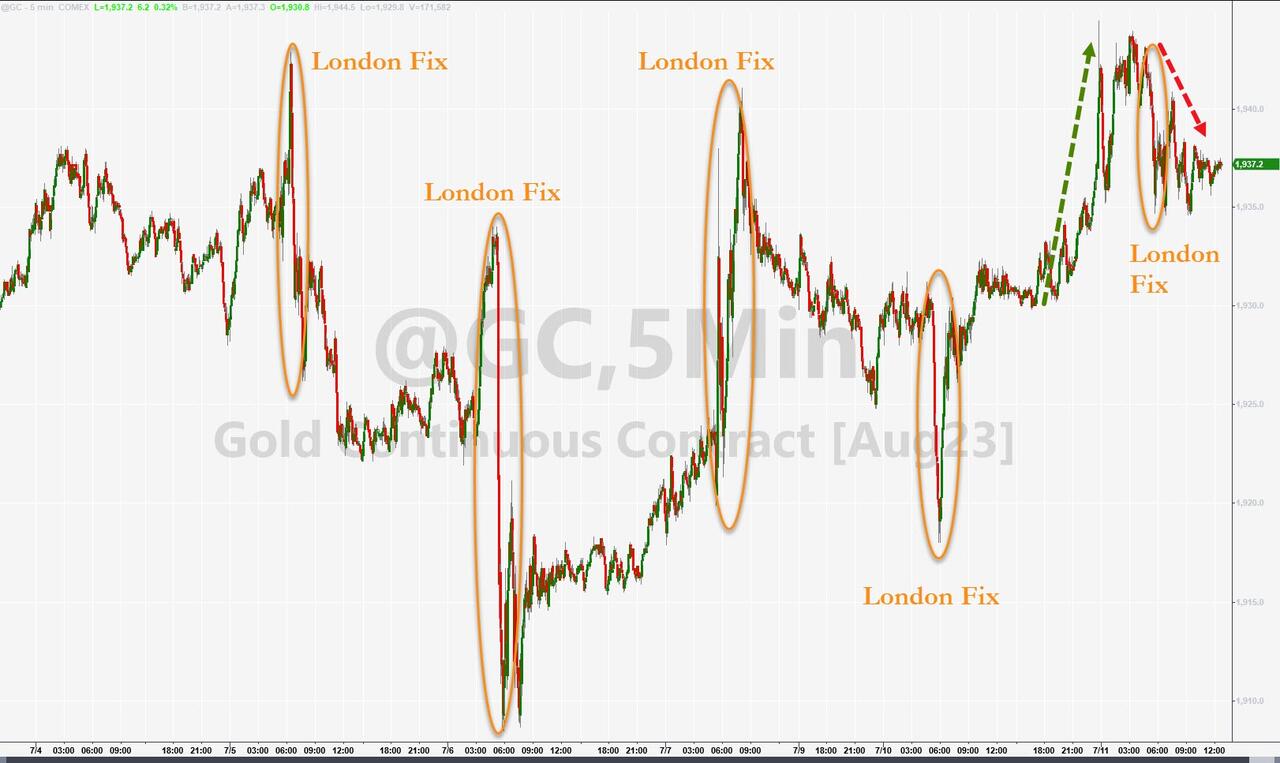
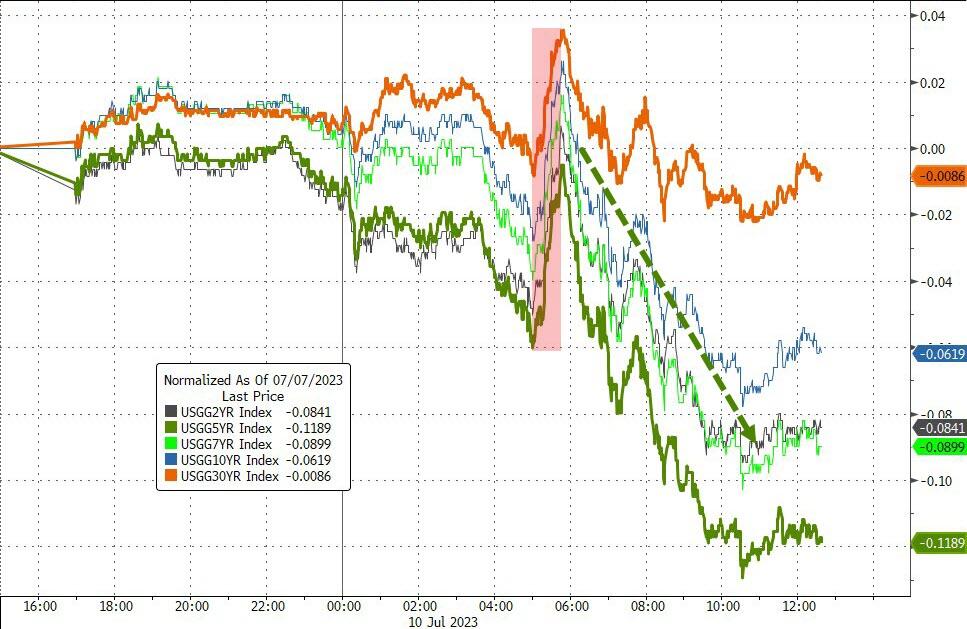
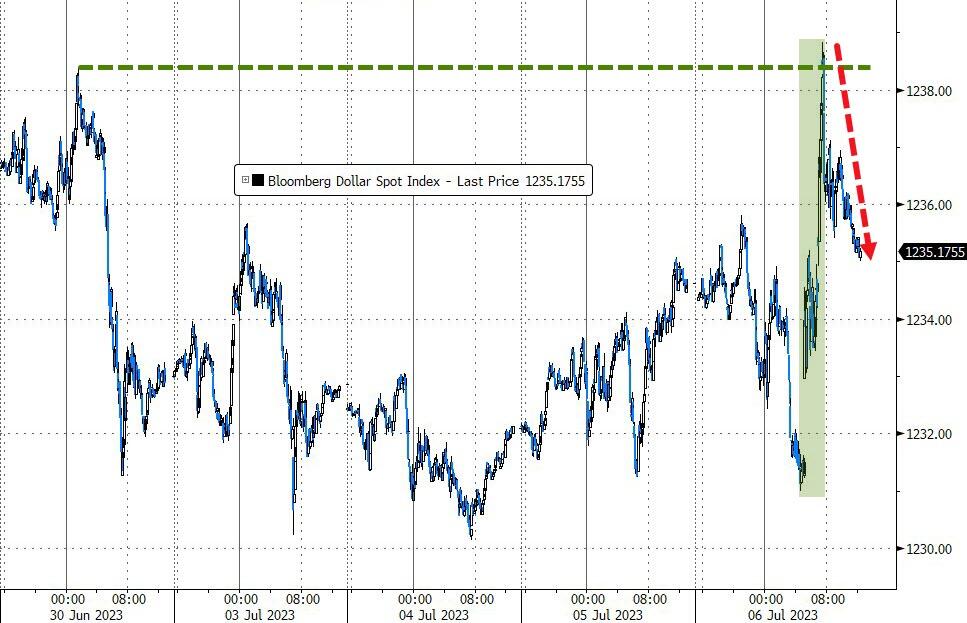
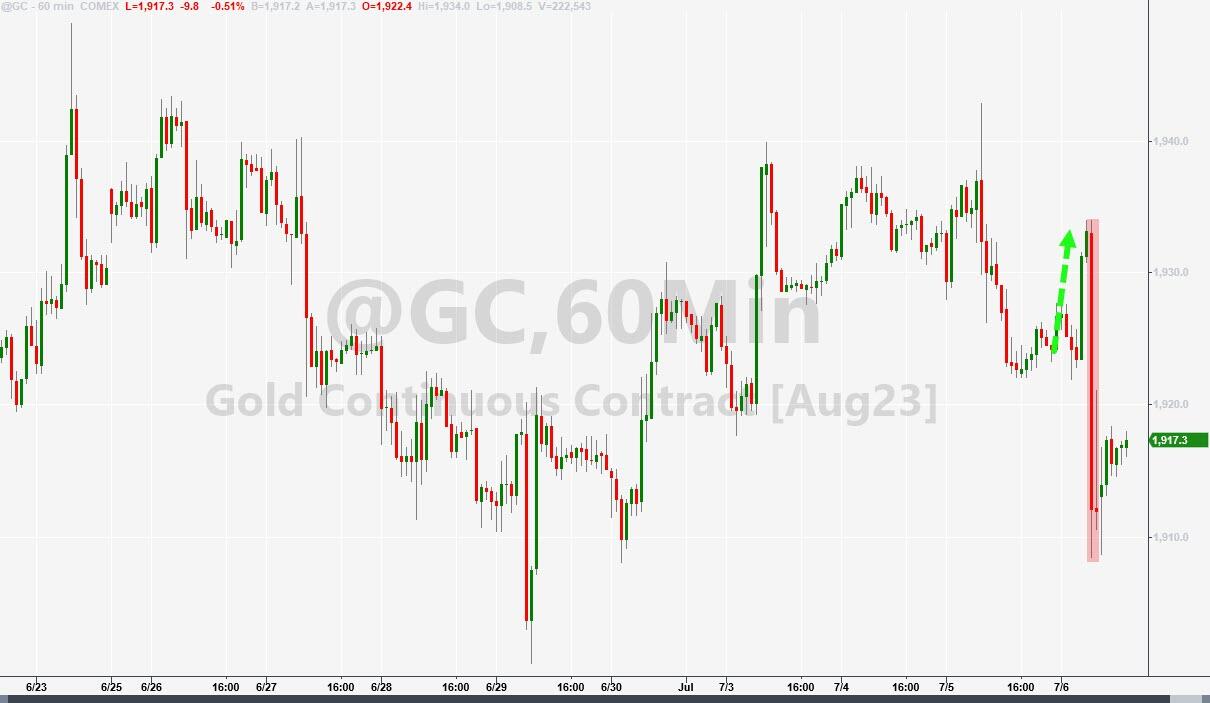
The bond market was mixed, with the 10-year yield falling slightly, while the US dollar weakened and hit its lowest level since June. Gold finally kept its momentum and moved closer to its $1,950 mark.

The market mood could stay positive if the inflation report tomorrow meets or beats expectations. But if inflation turns out to be higher than expected, equities could turn sour quickly.

Read More
Market Mixed As Inflation Worries Clash With Earnings Hopes

Ulli Market Commentary Contact

[Chart courtesy of MarketWatch.com]

  1. Moving the markets

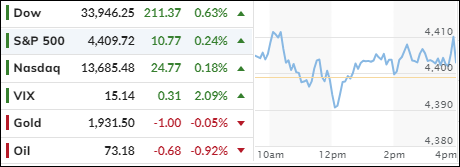
The Dow bounced back from last week’s slump, but the S&P and Nasdaq barely budged as investors waited for inflation and earnings news.

The CPI and PPI reports are due on Wednesday and Thursday, respectively, and could ease some inflation fears if they come in lower than expected.

Meanwhile, big banks will kick off the second quarter earnings season, but some analysts worry that stock prices are too high.

The bond market shrugged off the Fed’s hawkish rhetoric, as several officials repeated their calls for more rate hikes to tame inflation.

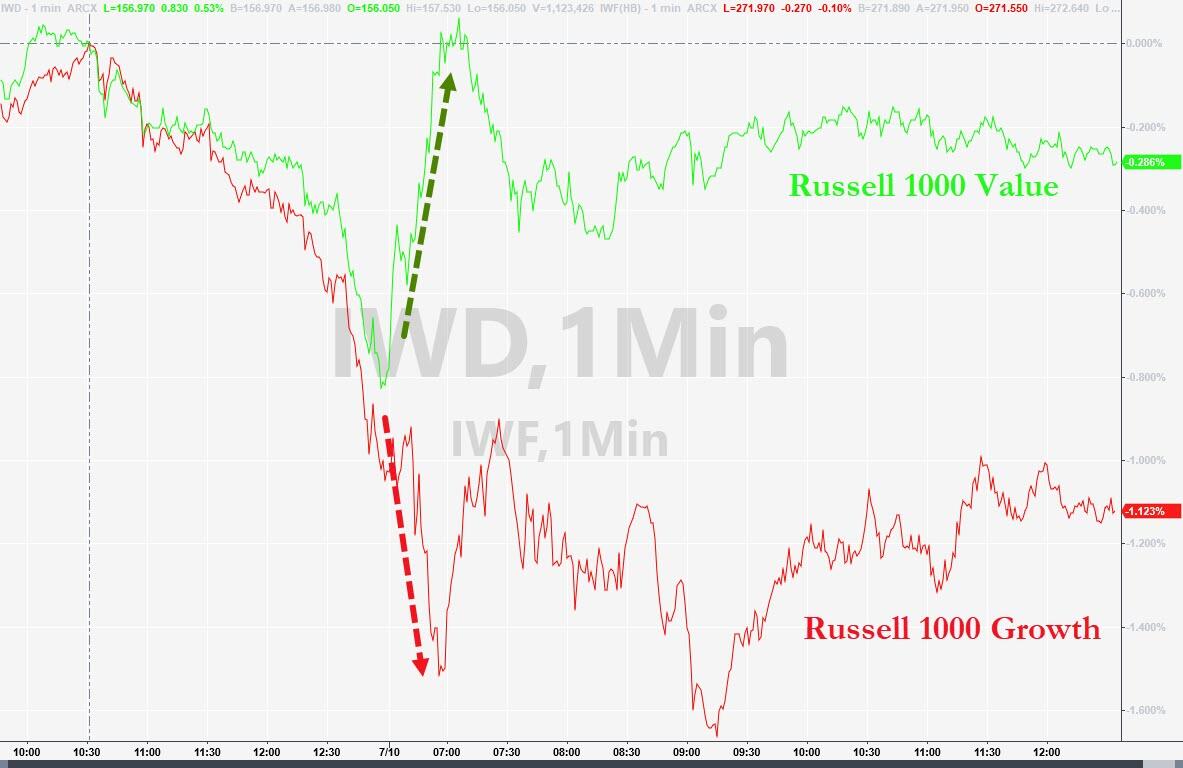
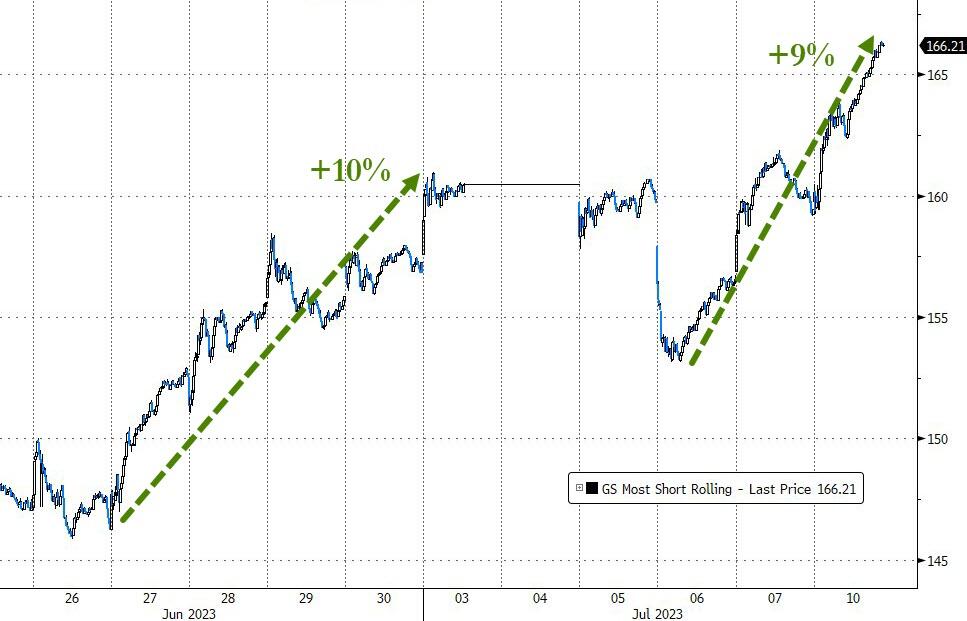
Big tech stocks stumbled but recovered by the end of the day, while small caps surged by more than 2%. Value stocks outperformed growth stocks, and short sellers got squeezed again.

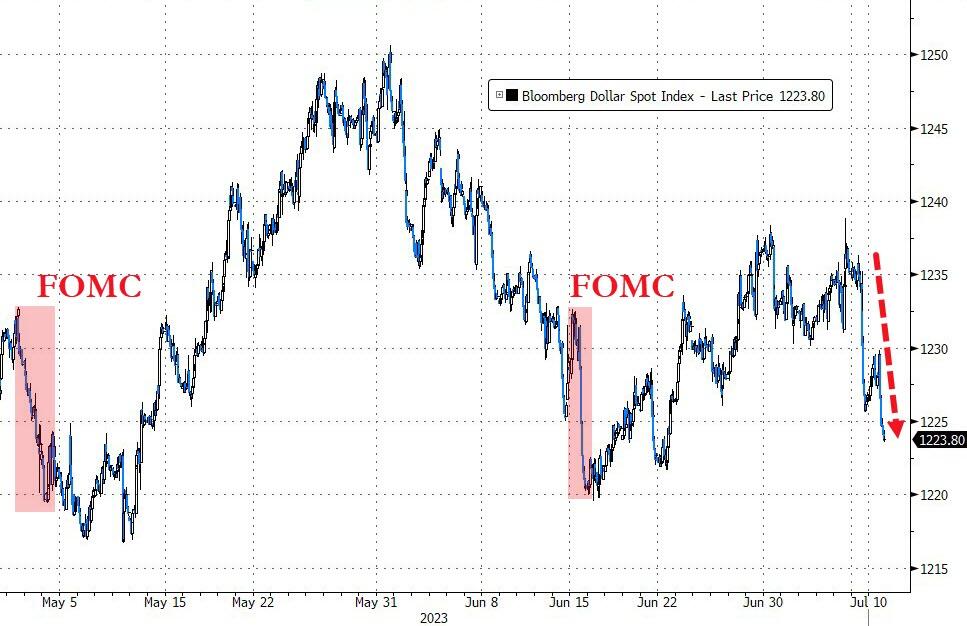
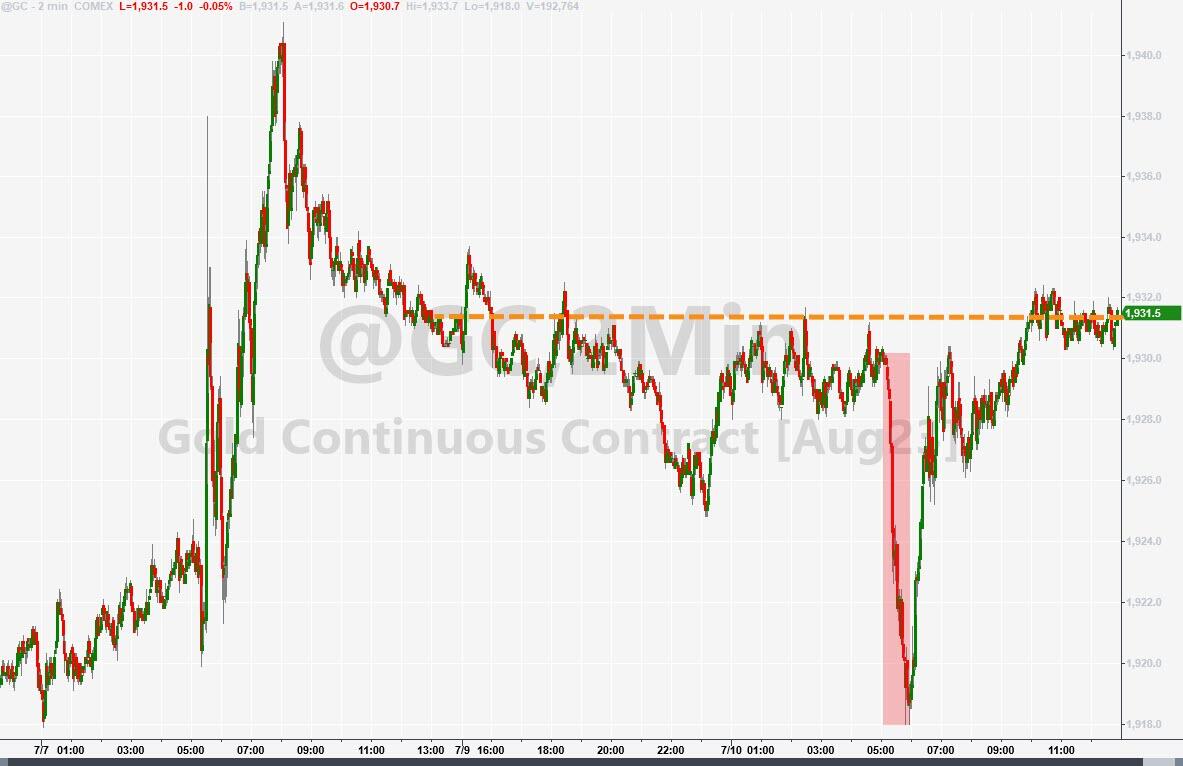
The US dollar took another beating and fell back into its familiar range. Gold was flat, but its ETF edged up slightly.

Will the CPI report surprise the market or confirm its fears?

Stay tuned for Wednesday’s action.

Read More
ETFs On The Cutline – Updated Through 07/07/2023

Ulli ETFs on the Cutline Contact

Do you want to know which ETFs are hot and which ones are not? Then you need my High-Volume ETF Cutline report. It tells you how close or far each of the 311 ETFs I follow is from its long-term trend line (39-week SMA). These are the ETFs that trade more than $5 million a day, so they are not some obscure funds that nobody cares about.

The report is split into two parts: The winners that are above their trend line (%M/A), and the losers that are below it. The yellow line is the line of shame that separates them. You can see how many ETFs are in each group and how they have changed since the last report (198 vs. 153 current).

Take a peek:

The HV ETF Master Cutline Report

If you are confused by some of the terms we use, don’t panic. I have a helpful Glossary of Terms for you.

If you want to learn more about the Cutline method and how it can make you rich (or at least less poor), read my original post here.

ETF Tracker Newsletter For July 7, 2023

Ulli ETF Tracker Contact

ETF Tracker StatSheet          

You can view the latest version here.

JOBS, WAGES, AND REVISIONS: THE GOOD, THE BAD, AND THE UGLY

[Chart courtesy of MarketWatch.com]

  1. Moving the markets

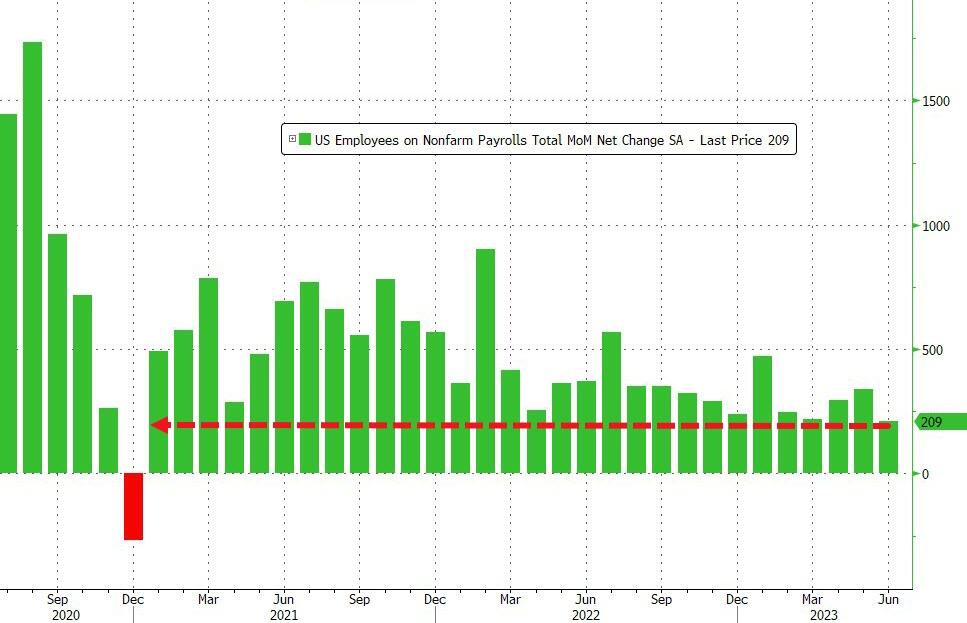
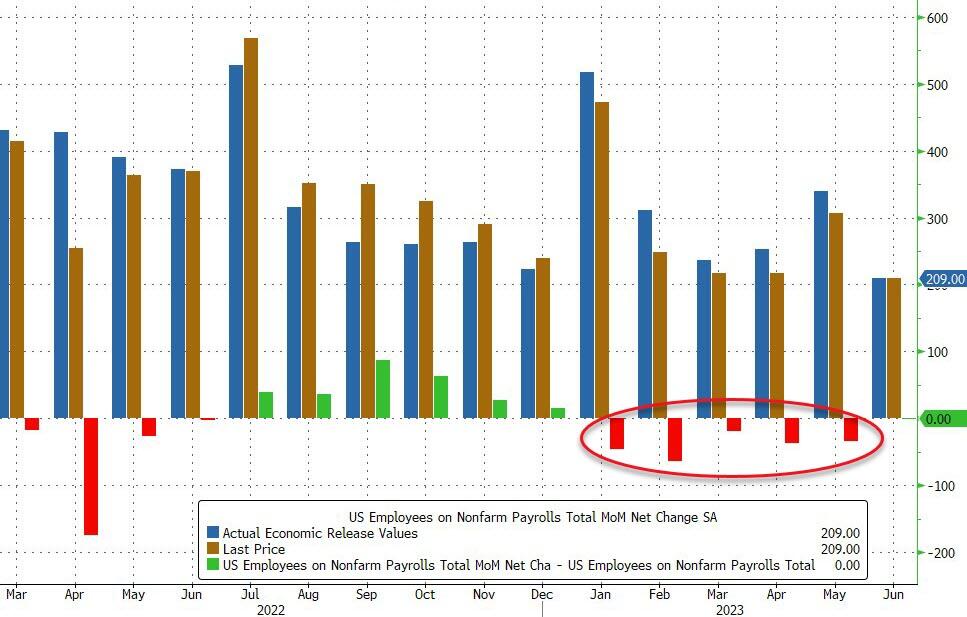
The June jobs report was a mixed bag for the markets. The economy added 209k jobs, less than the forecast of 240k, but wages grew faster than expected, raising fears of inflation and more Fed rate hikes. The unemployment rate stayed at 3.6%, the lowest since 1969.

But wait, there’s more. The previous two months’ job numbers were revised down by a whopping 110k, making 2023 the year of downward revisions. Every month this year has seen lower job growth than initially reported.

And here’s a curious fact. The government was the biggest employer in June, adding 60k jobs. That’s more than twice the average monthly increase in 2022. Maybe Uncle Sam is feeling generous, or maybe he’s preparing for something big. Wall Street didn’t know what to make of it.

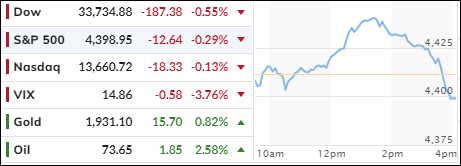
The major indexes opened lower, then rallied briefly in the afternoon, only to plunge again before the closing bell. It was a roller coaster ride that left investors feeling queasy.

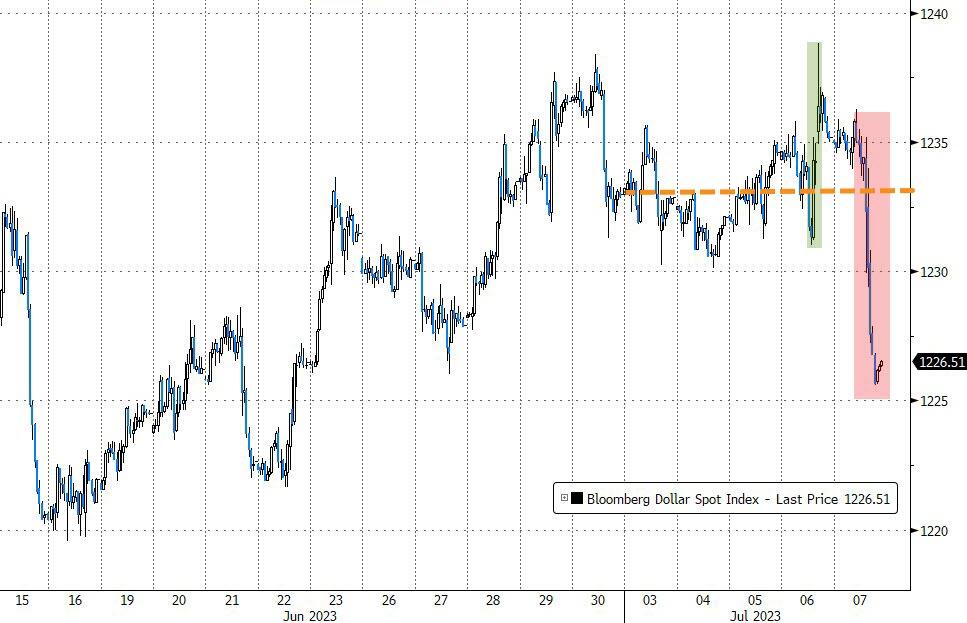
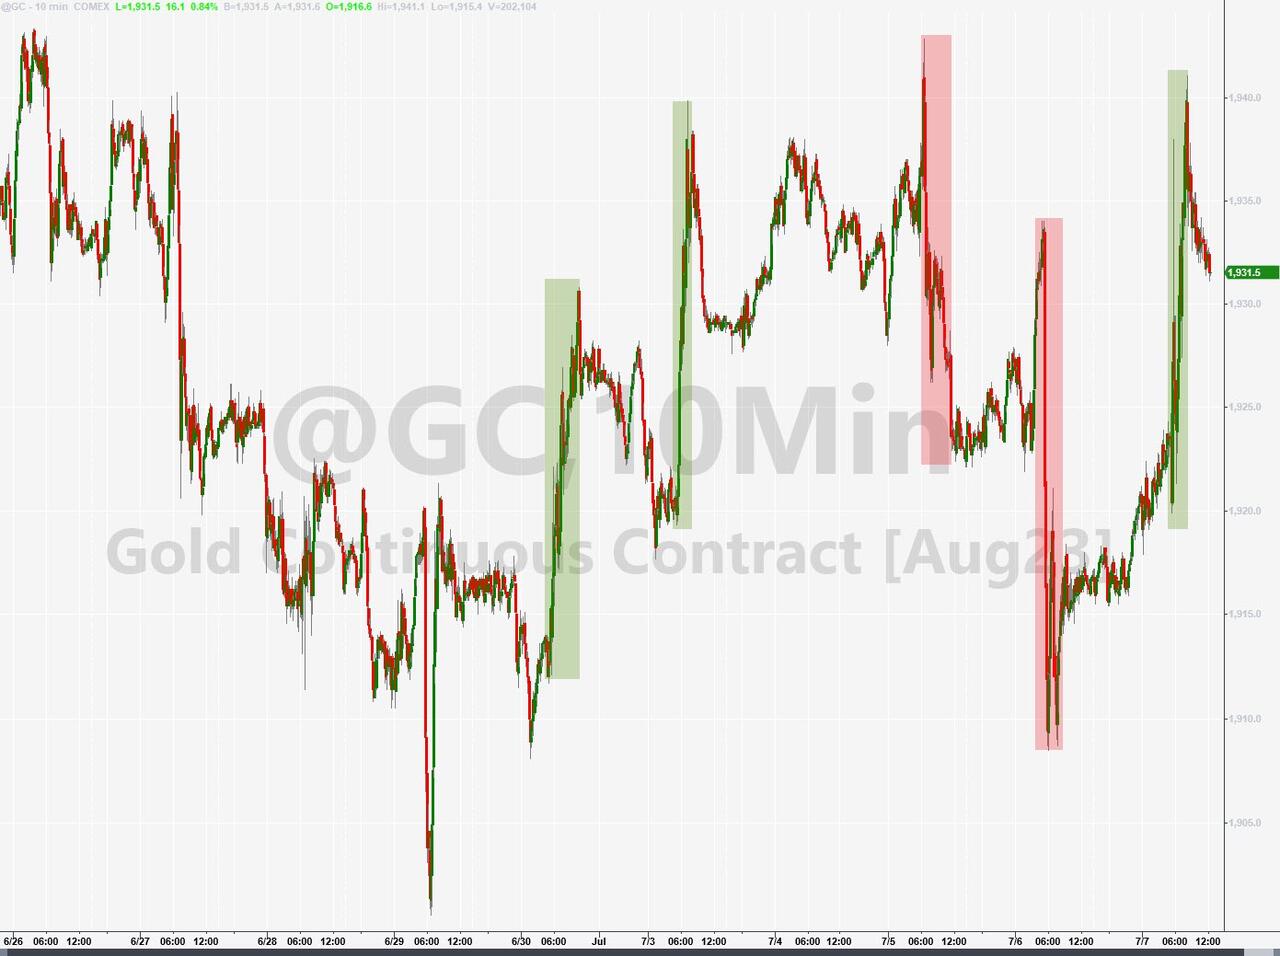
Bond yields spiked this week, but the short end of the curve fell back below 5%, the highest level since 2007. The dollar also took a dive, hitting a three-week low against other currencies. Gold had a wild day, swinging up and down before ending slightly higher.

The Fed is widely expected to raise rates by 0.25% later this month, but traders are still doubtful about two more hikes this year. Maybe they’re hoping for a miracle, or maybe they’re just in denial.

Read More
Weekly StatSheet For The ETF Tracker Newsletter – Updated Through 07/06/2023

Ulli ETF StatSheet Contact

ETF Data updated through Thursday, July 6, 2023

How to use this StatSheet:

  1. Out of the 1,800+ ETFs out there, I only pick the ones that trade over $5 million per day (HV ETFs), so you don’t get stuck with a lemon that nobody wants to buy or sell.
  1. Trend Tracking Indexes (TTIs)

These are the main indicators that tell you when to buy or sell Domestic and International ETFs (section 1 and 2). They do that by comparing their position to their long-term M/A (Moving Average). If they cross above, and stay there, it’s a green light to buy. If they fall below, and keep going, it’s a red light to sell. And to make sure you don’t lose your shirt if things go south, I also use a 12% trailing stop loss on all positions in these categories.

  1. All other investment areas don’t have a TTI and should be traded based on the position of each ETF relative to its own trend line (%M/A). That’s why I call them “Selective Buy.” In other words, if an ETF goes above its own trend line, you can buy it. But don’t forget to use a trailing sell stop of 12%, or less if you’re feeling nervous.

If some of these words sound like Greek to you, please check out the Glossary of Terms and new subscriber information in section 9.

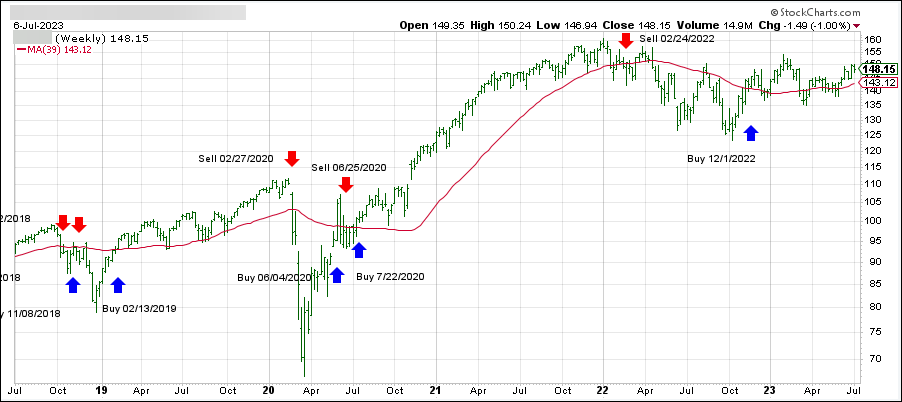
  1. DOMESTIC EQUITY ETFs: BUY— since 12/01/2022

Click on chart to enlarge

This is our main compass, the Domestic Trend Tracking Index (TTI-green line in the above chart). It has now broken above its long-term trend line (red) by +3.88% and remains in “Buy” mode.

Read More

Good Jobs Data Turns Sour For Stocks And Bonds

Ulli Market Commentary Contact

[Chart courtesy of MarketWatch.com]

  1. Moving the markets

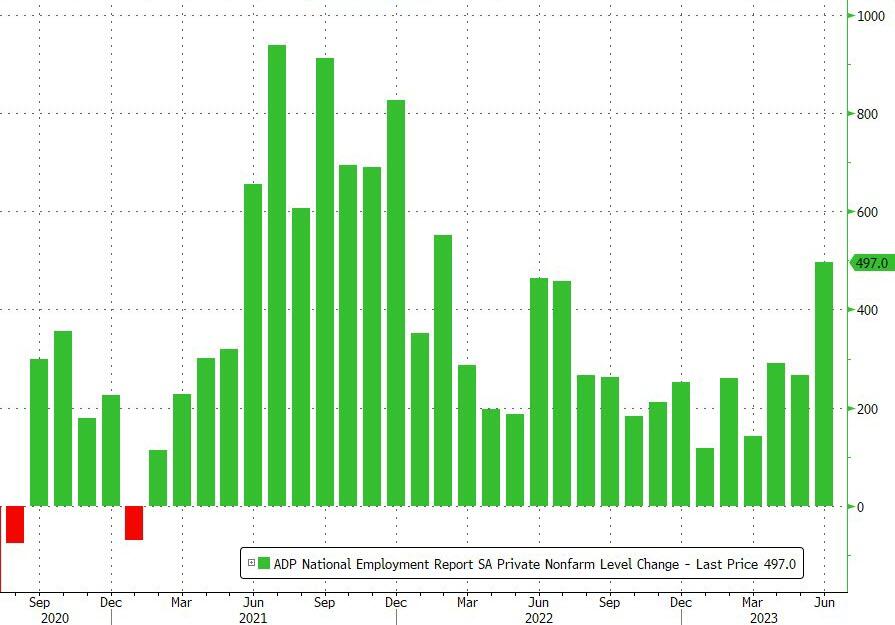
We all know the saying “when good news is bad news.” Well, today we got a reminder of what that means. ADP announced that private sector jobs jumped by 497k in June, smashing expectations and marking the biggest monthly gain since July 2022. That sounds like good news, right? Wrong.

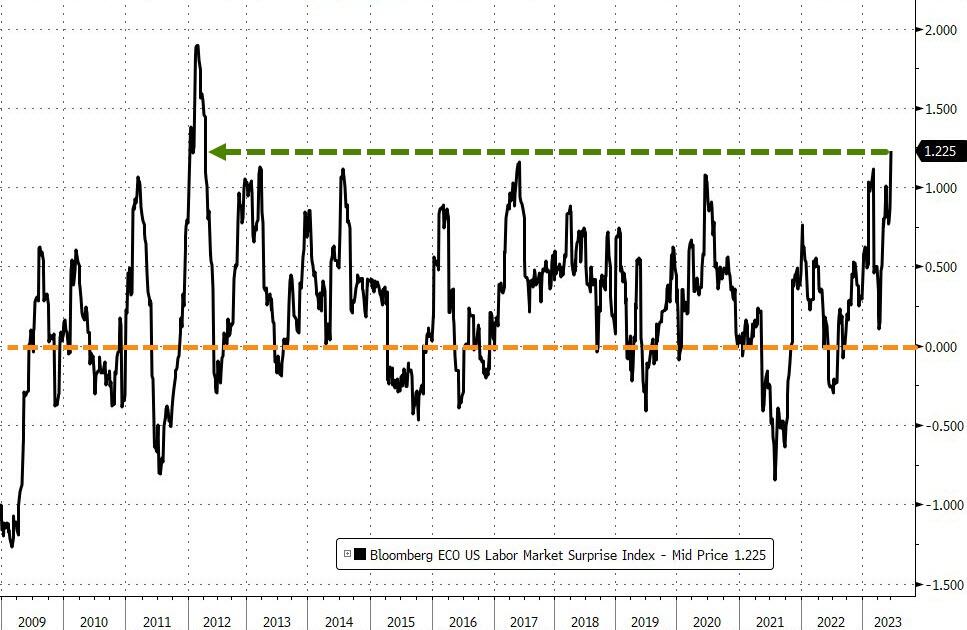
Because this report is not very reliable and often differs from the official payroll data that comes out tomorrow. Economists are expecting a more modest gain of 240k jobs for June, which would still be lower than May’s impressive number of 339k. But even if they are right, the jobs market is still the strongest it has been since 2012, unless some nasty revisions come along.

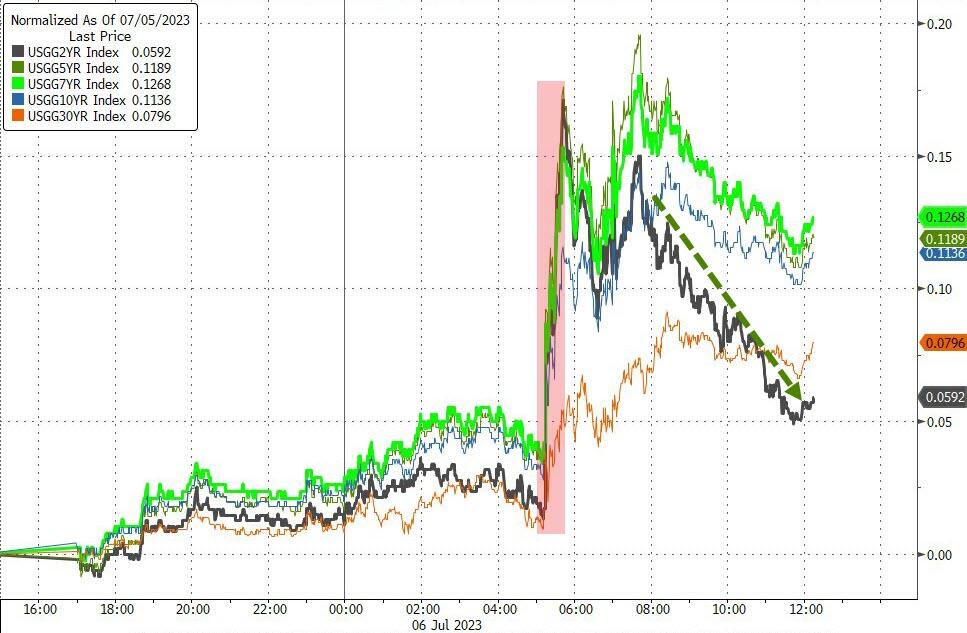
So why is this bad news? Because traders think this means the Fed will keep raising interest rates to cool down the economy and prevent inflation. They are now almost certain that we will see another hike in July, the fourth one this year. And they expect more to come.

This sent bond yields soaring, with the 10-year breaking above 4% and the 2-year hitting its highest level since July 2006. This also pushed up mortgage rates, with the 30-year reaching its highest since November. Ouch.

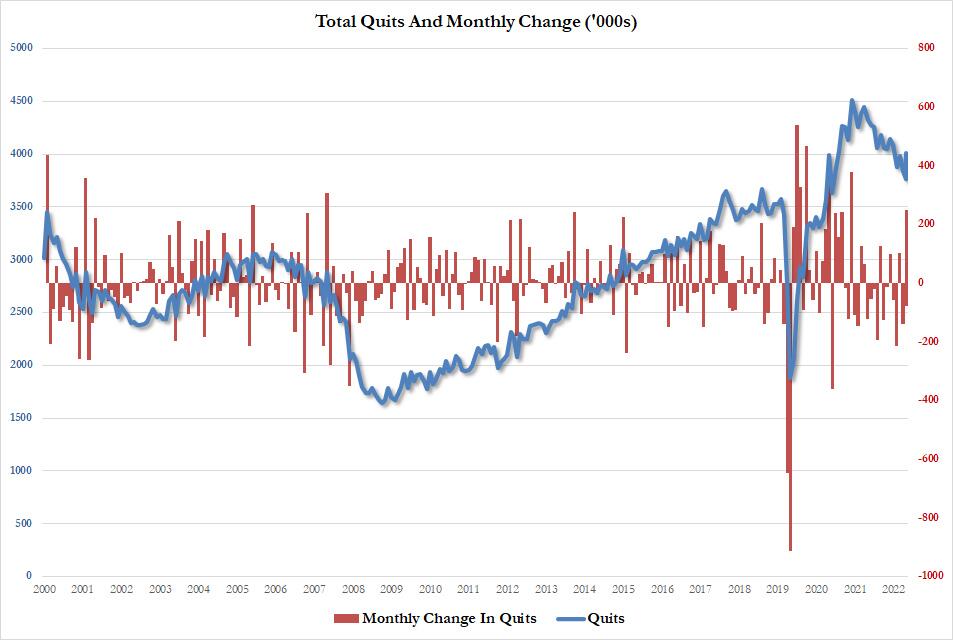
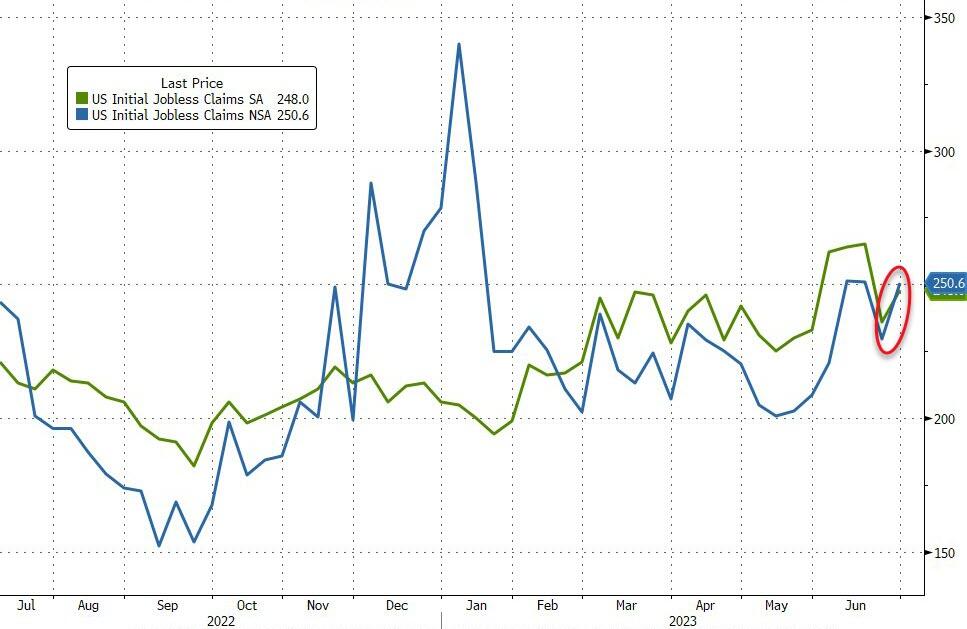
Meanwhile, we also learned that job openings dropped by 500k in May, even though more people quit their jobs. And initial claims for unemployment benefits bounced back up after a holiday-related dip. Not so good news after all.

The stock market didn’t like any of this and closed in the red across the board. Small caps took the biggest hit and got hammered hard. The dollar had a brief rally but then gave up its gains and ended lower. Gold also suffered and slid towards last week’s lows.

But I’m not worried about gold, because it’s a long-term hedge against inflation. And inflation will come eventually, trust me. Why else would central banks be buying so much gold? They bought over 1,100 tons of it in 2022, the most on record since 1950.

Think about that.

Read More