Do you want to know which ETFs are hot and which ones are not? Then you need my High-Volume ETF Cutline report. It tells you how close or far each of the 311 ETFs I follow is from its long-term trend line (39-week SMA). These are the ETFs that trade more than $5 million a day, so they are not some obscure funds that nobody cares about.
The report is split into two parts: The winners that are above their trend line (%M/A), and the losers that are below it. The yellow line is the line of shame that separates them. You can see how many ETFs are in each group and how they have changed since the last report (217 vs. 240 current).
The stock market had a wild ride this week, as investors scrambled to adjust their portfolios before a major reshuffle of the Nasdaq-100 index on Monday. A flurry of options trading added to the volatility.
Corporate earnings were in the spotlight, but they failed to impress. Most of the companies in the S&P 500 beat the analysts’ low expectations, but not by much. The average beat rate was below the norm for the past three years.
Still, some analysts remained optimistic and predicted that the earnings were good enough to keep the market going up. They ignored the rising interest rates and the Fed’s tight monetary policy.
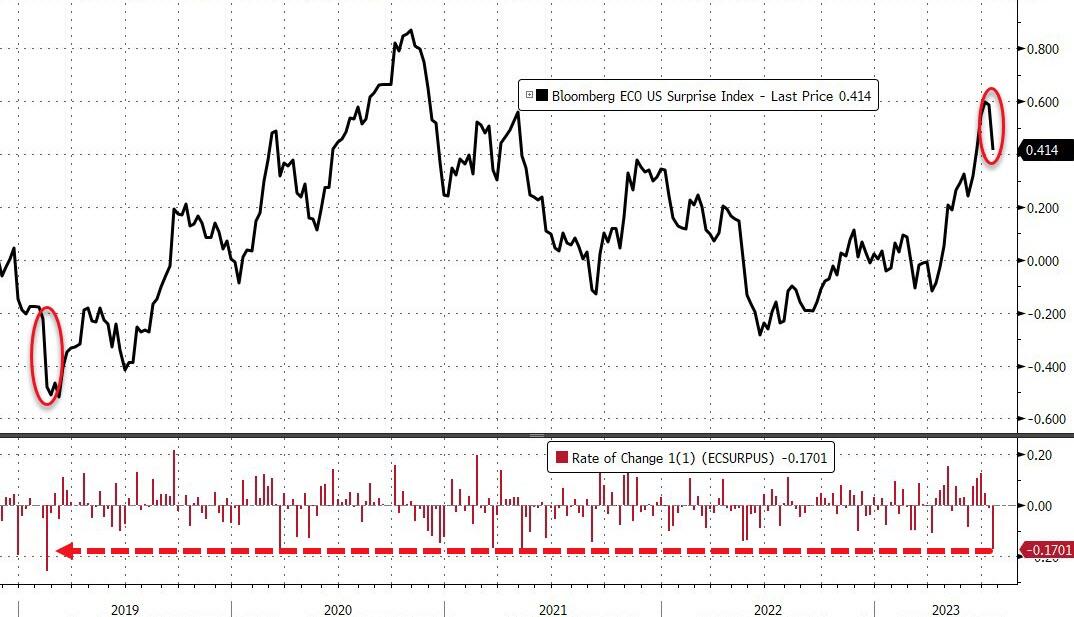
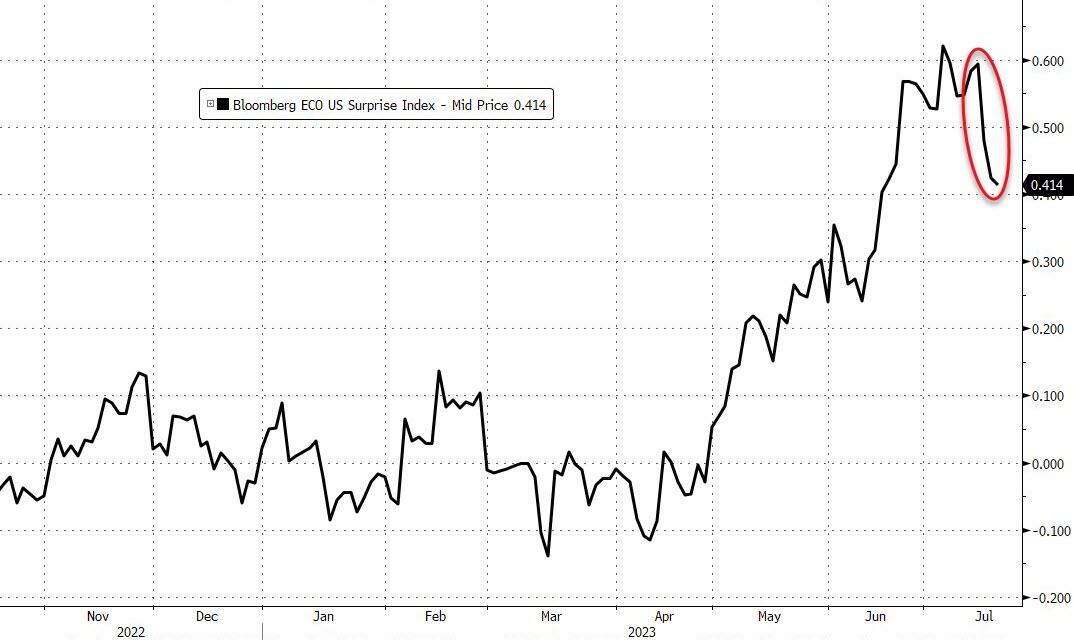
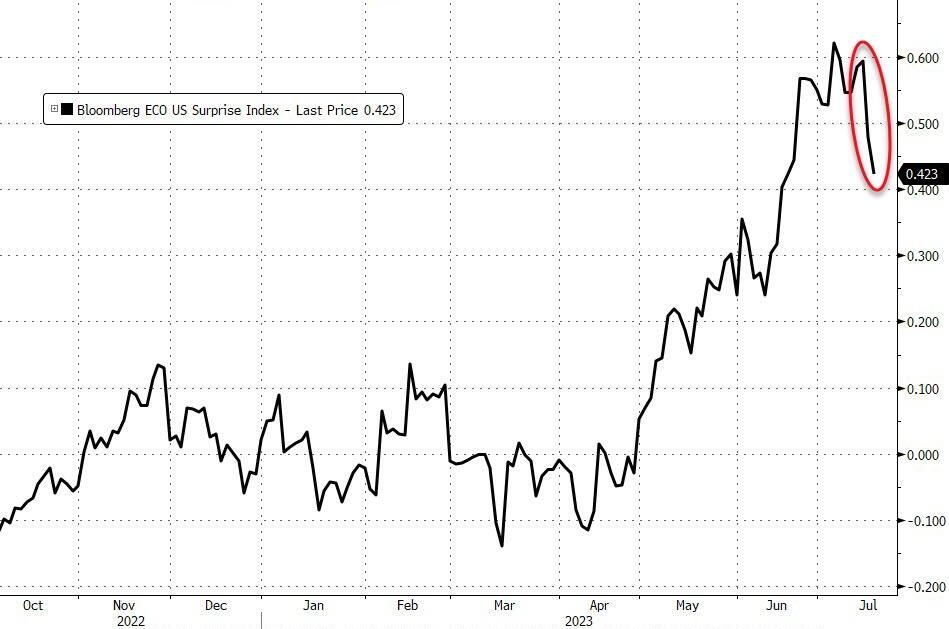
They also overlooked the weakening US economic data, which had its biggest weekly drop in more than two years. That could signal a recession, which usually means lower interest rates. But the Fed may not cut rates anytime soon, because it must protect the dollar from falling further and stoking inflation.
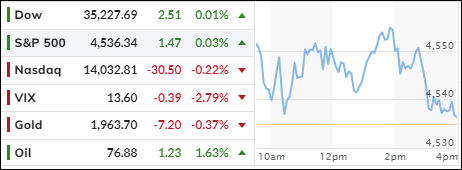
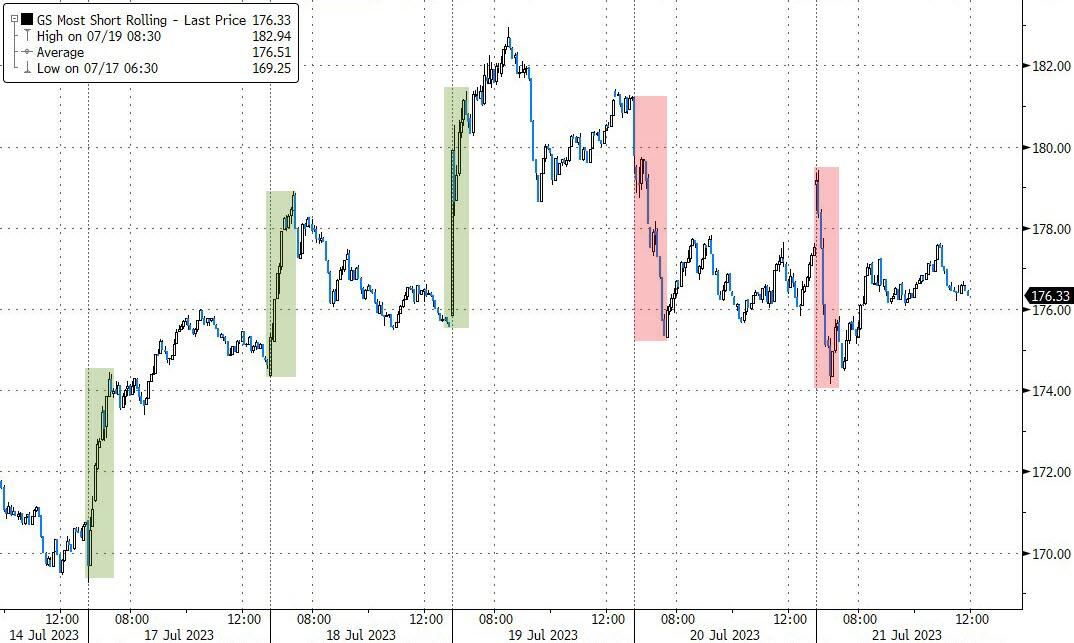
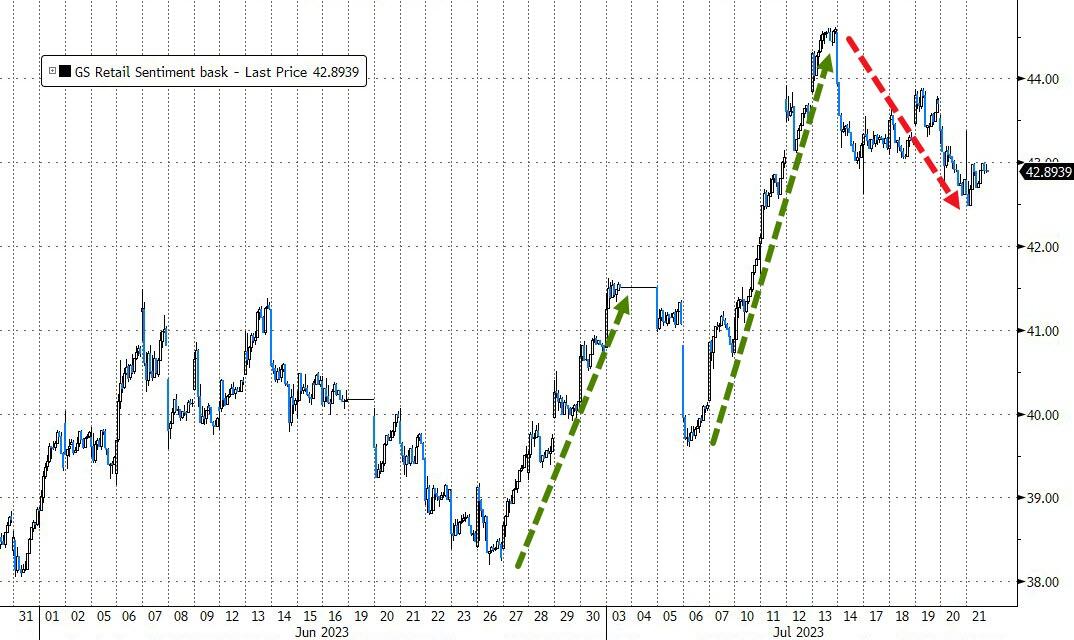
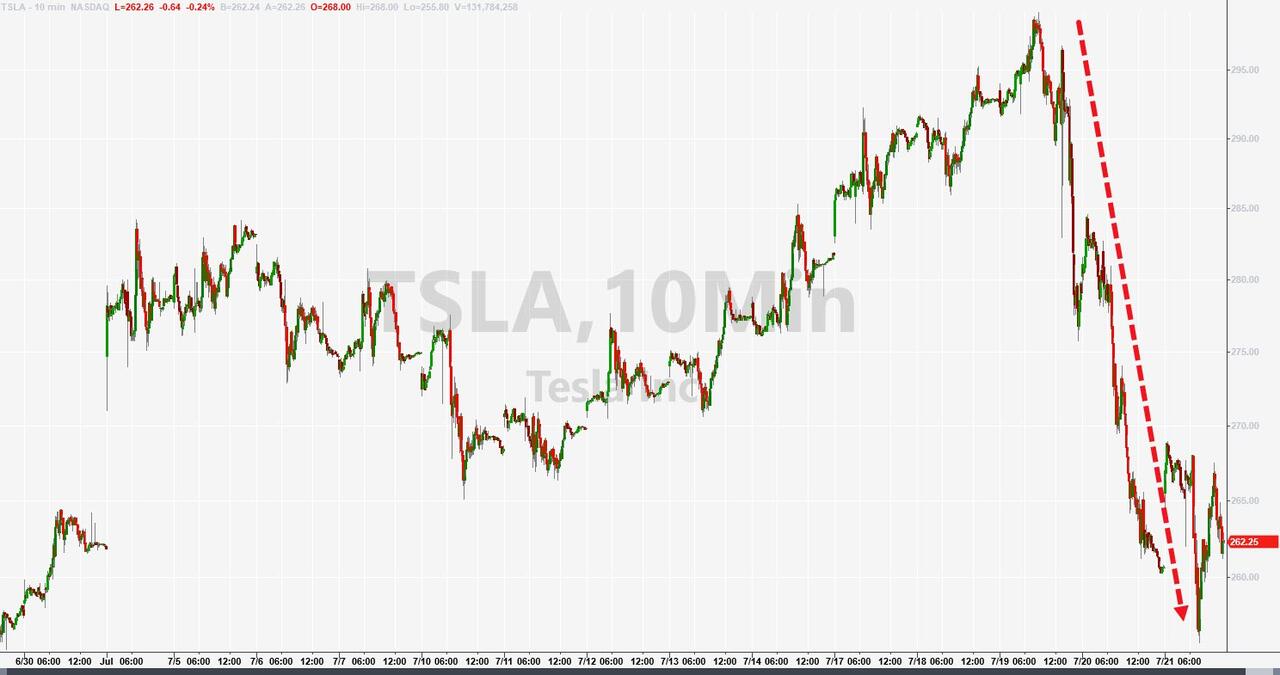
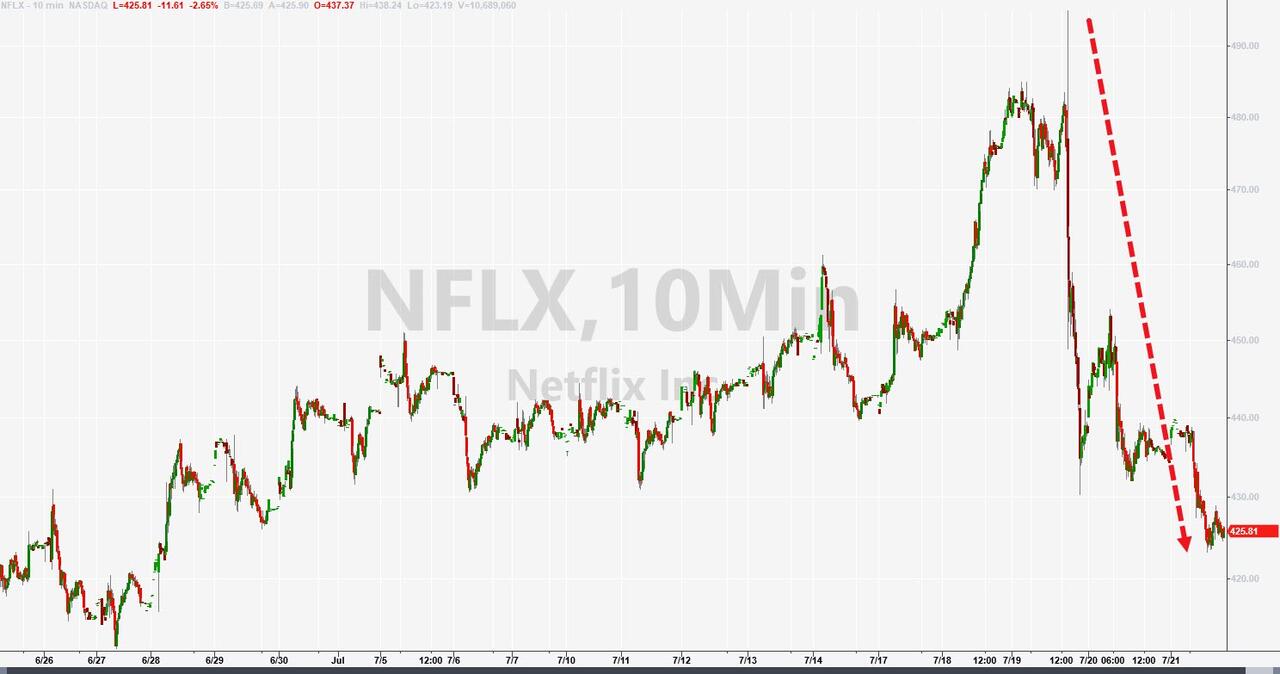
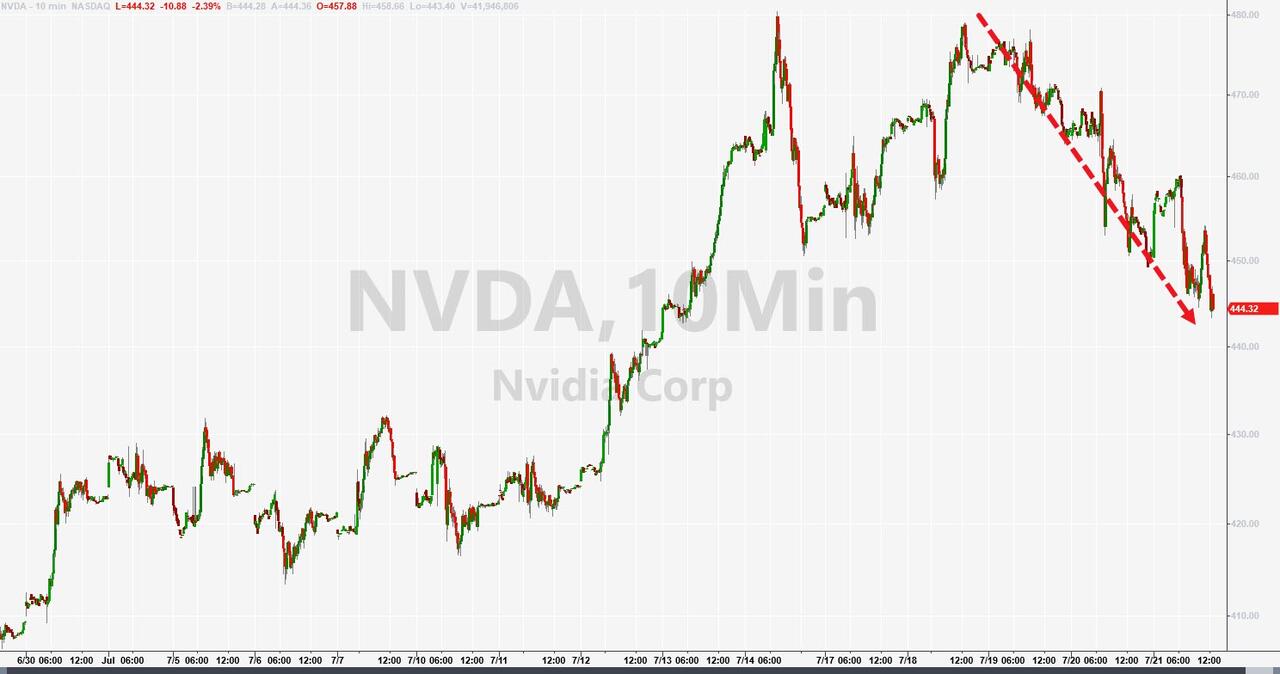
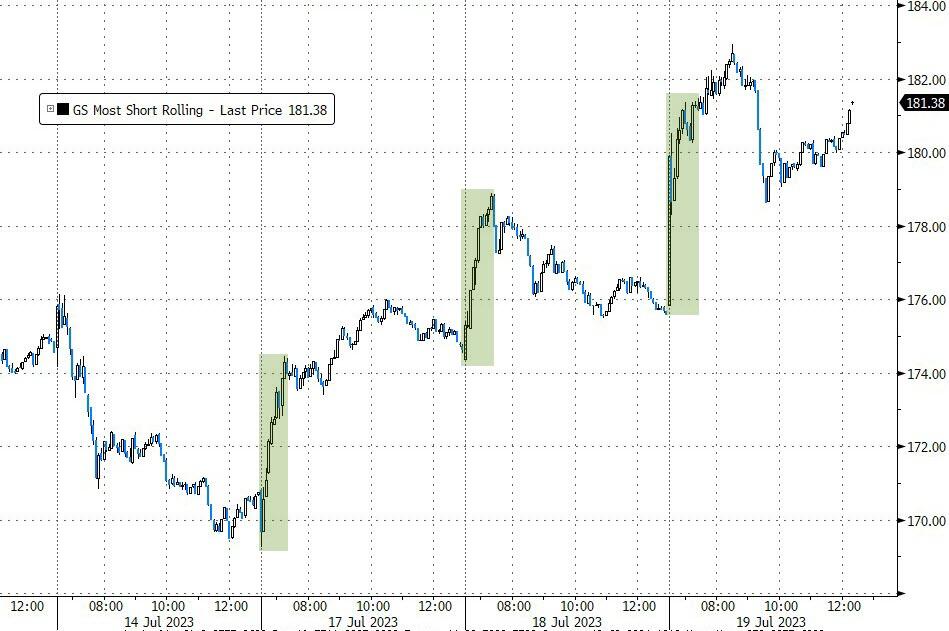
The market ended the week flat, after a short squeeze fizzled out. The squeeze had boosted some stocks earlier in the week, especially unprofitable tech stocks. But those stocks lost their shine by Friday, as did some of the tech giants like Tesla, Netflix and Nvidia.
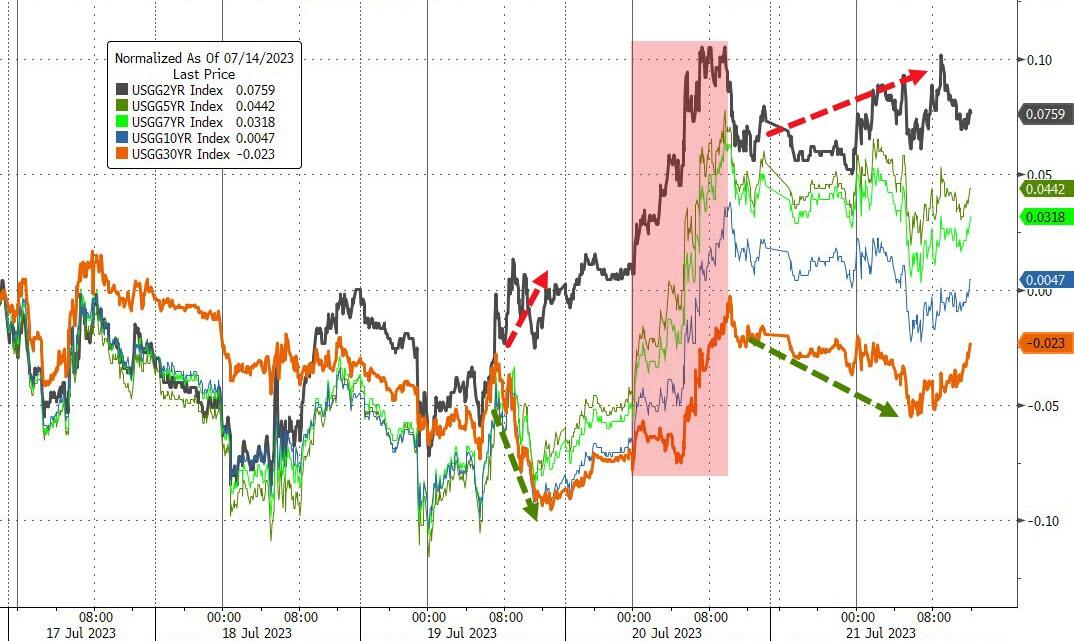
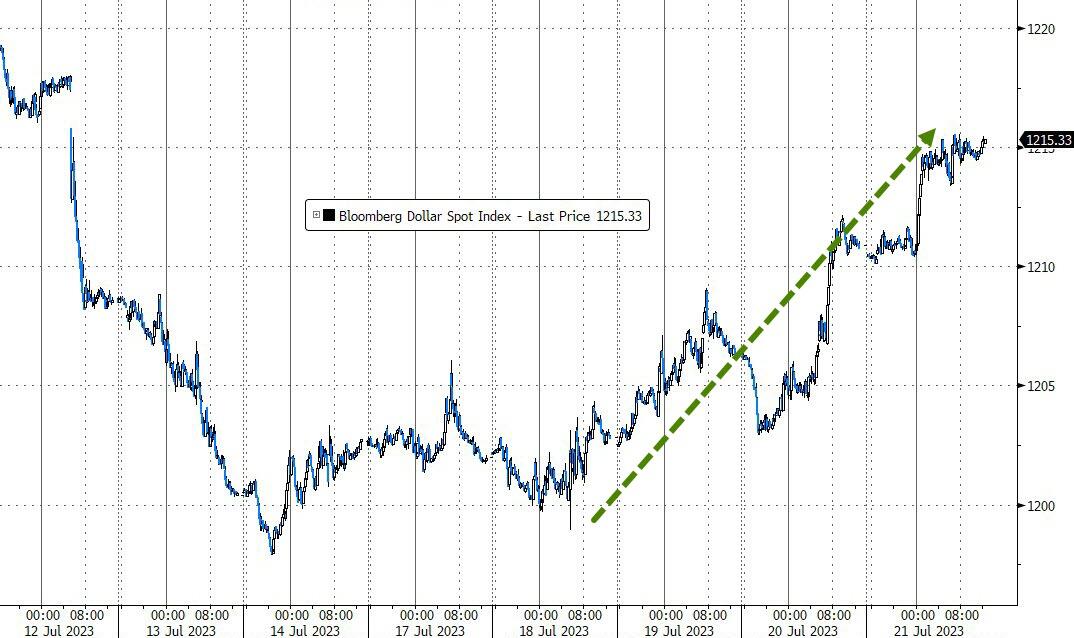
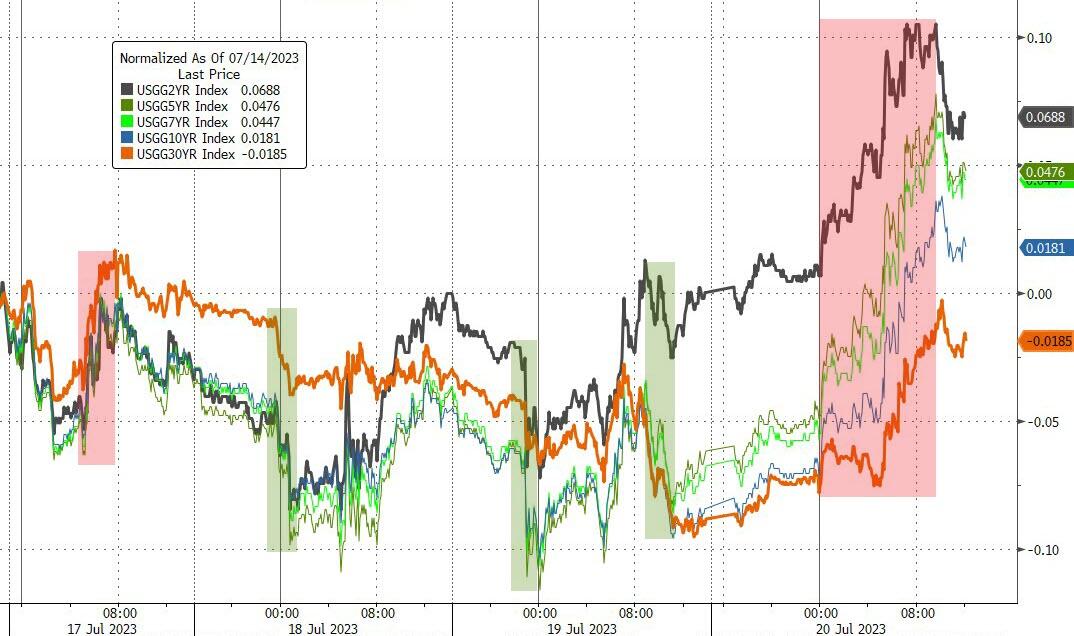
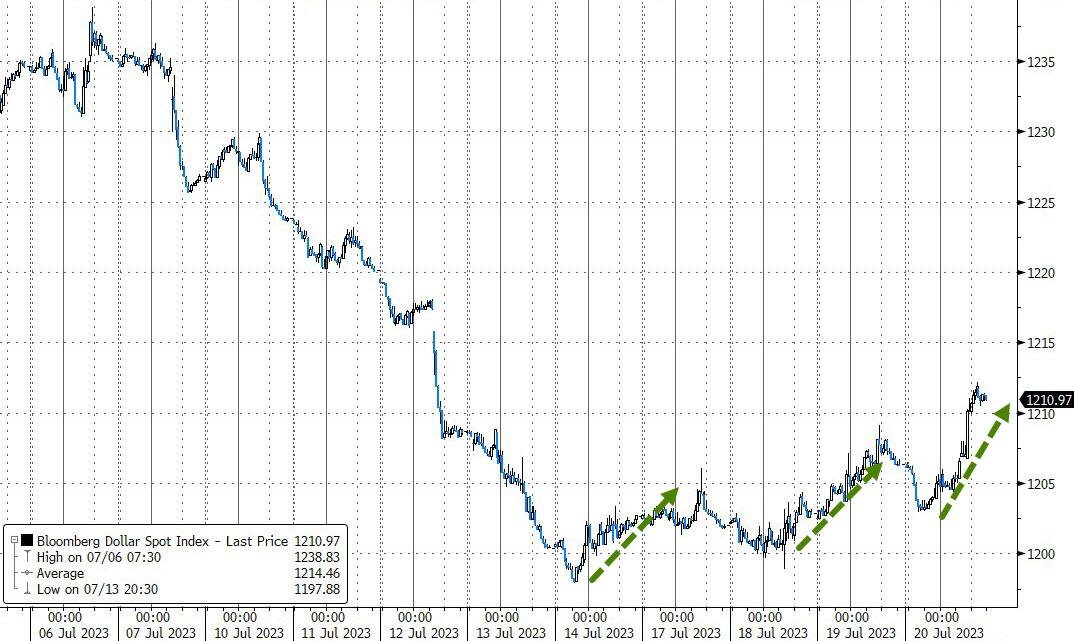
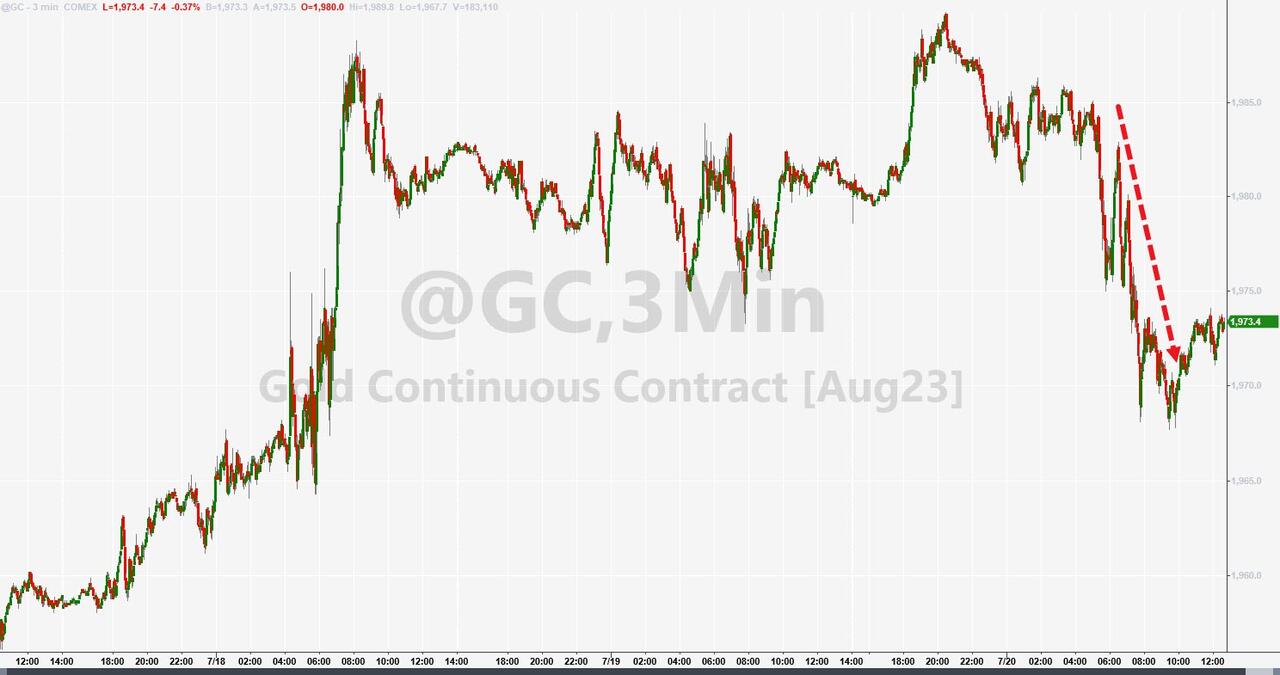
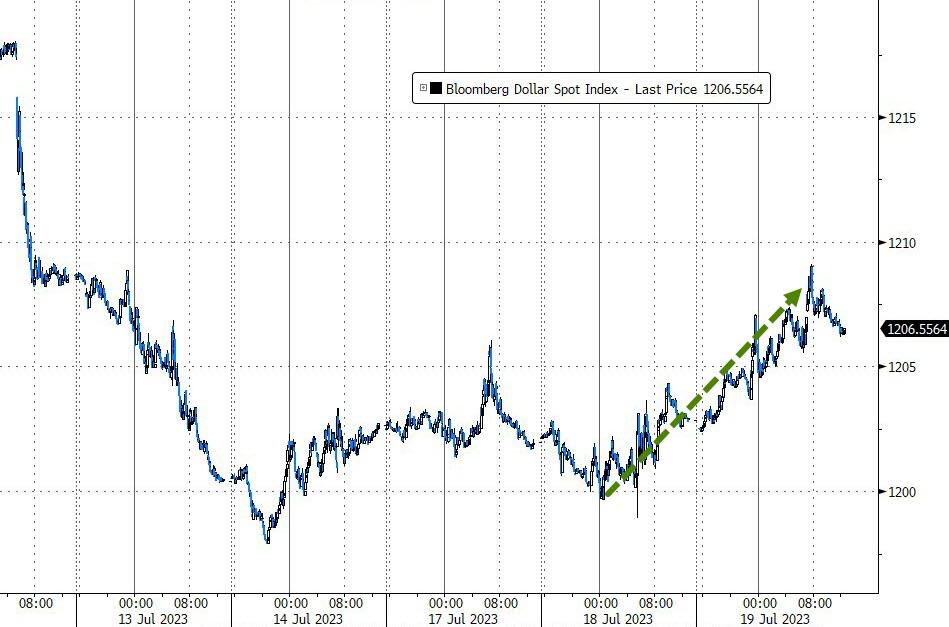
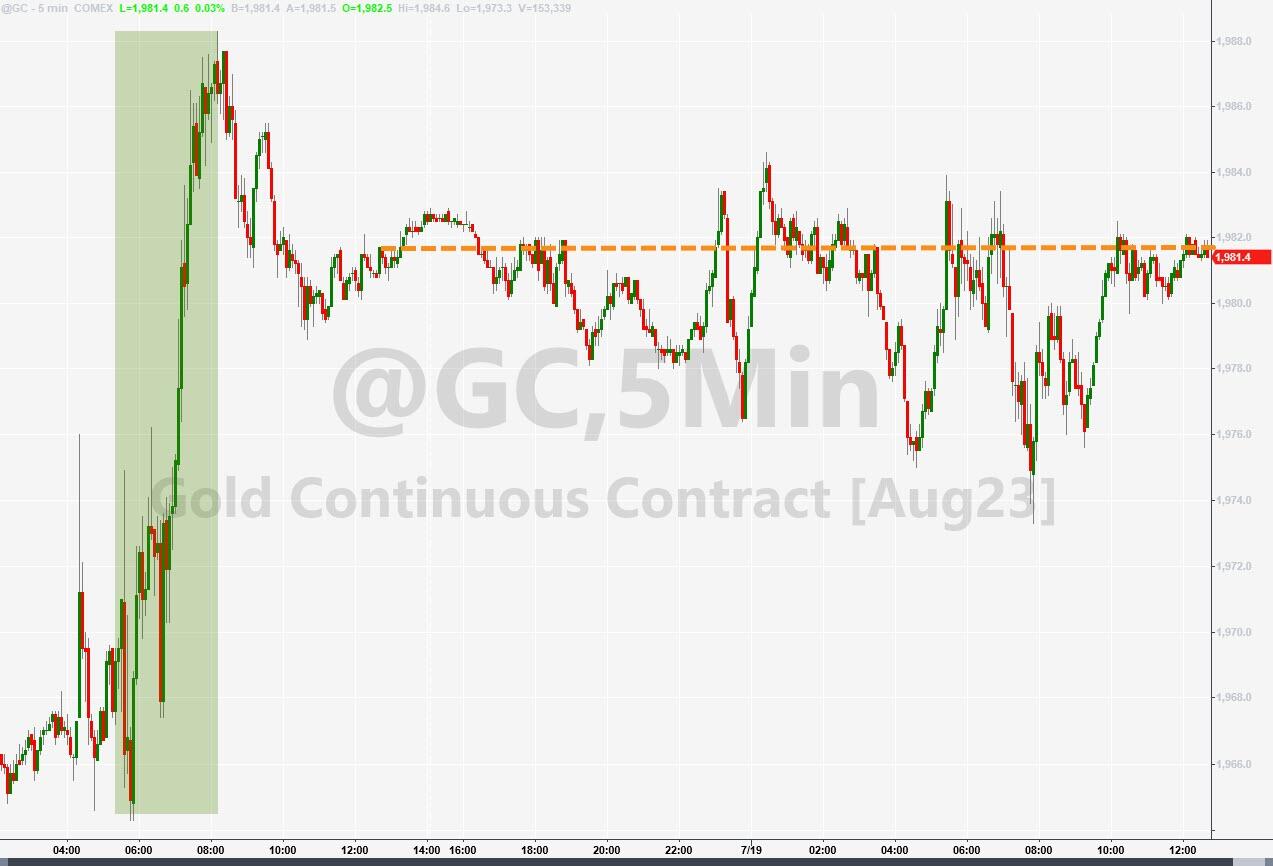
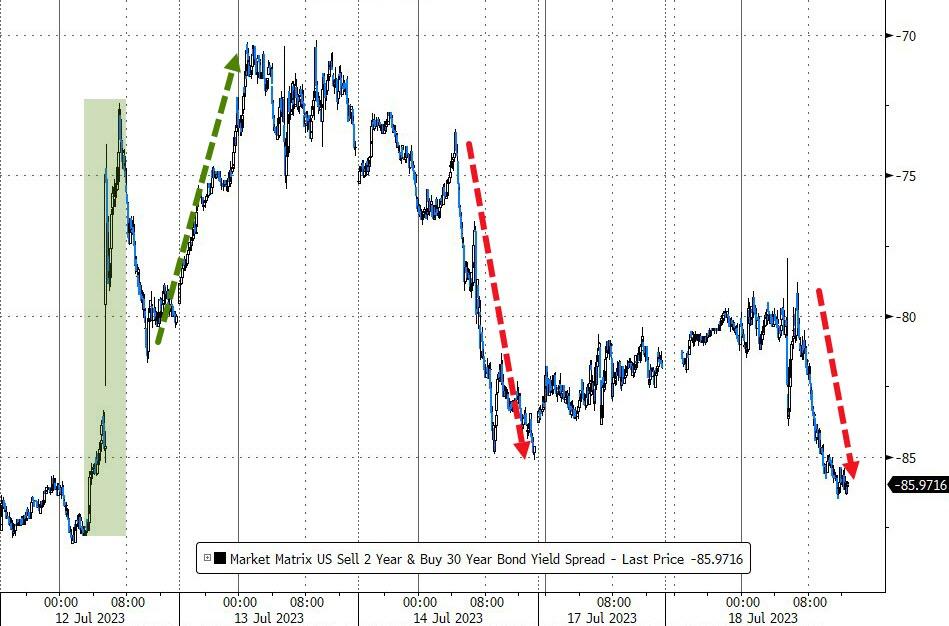
Bond yields were mixed, the dollar had its best week since February, gold edged up and silver slid down.
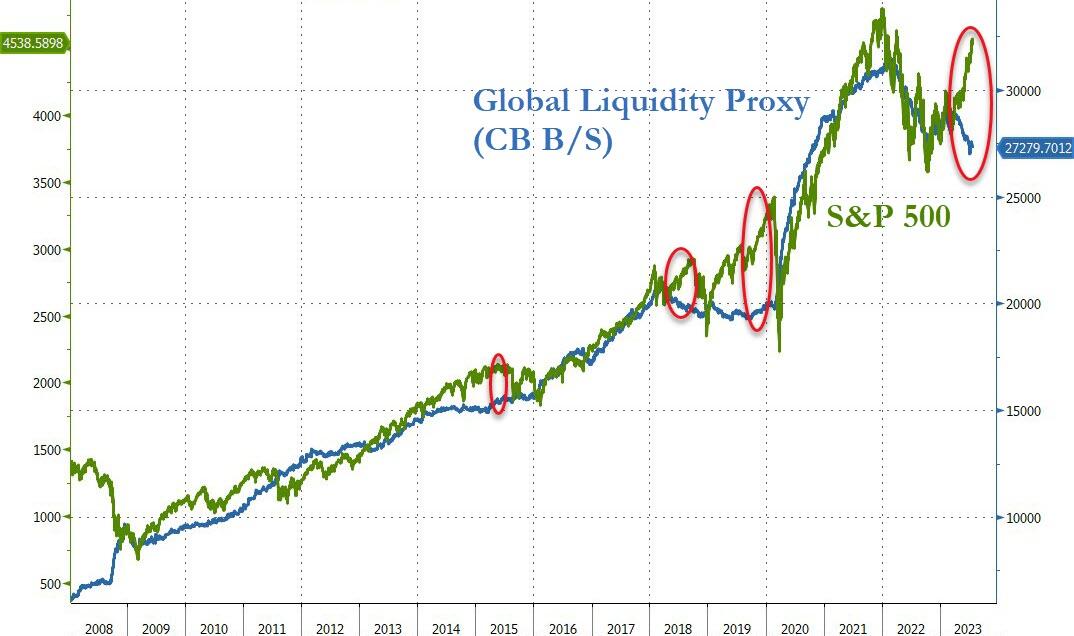
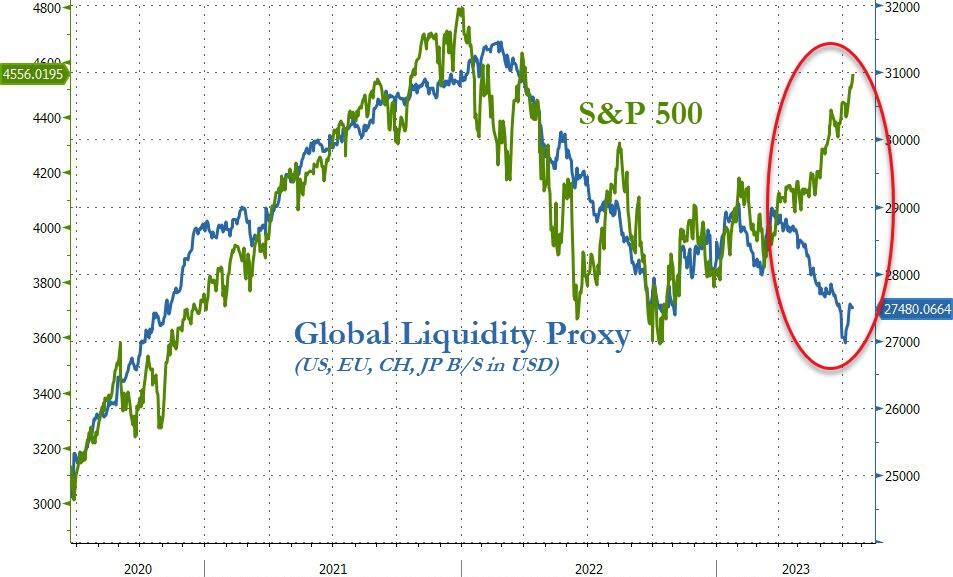
Remember, liquidity is king in the market. Any divergence between liquidity and a stock index will eventually correct itself, as this chart shows.
Which way will it go? History says liquidity always wins.
Out of the 1,800+ ETFs out there, I only pick the ones that trade over $5 million per day (HV ETFs), so you don’t get stuck with a lemon that nobody wants to buy or sell.
Trend Tracking Indexes (TTIs)
These are the main indicators that tell you when to buy or sell Domestic and International ETFs (section 1 and 2). They do that by comparing their position to their long-term M/A (Moving Average). If they cross above, and stay there, it’s a green light to buy. If they fall below, and keep going, it’s a red light to sell. And to make sure you don’t lose your shirt if things go south, I also use a 12% trailing stop loss on all positions in these categories.
All other investment areas don’t have a TTI and should be traded based on the position of each ETF relative to its own trend line (%M/A). That’s why I call them “Selective Buy.” In other words, if an ETF goes above its own trend line, you can buy it. But don’t forget to use a trailing sell stop of 12%, or less if you’re feeling nervous.
If some of these words sound like Greek to you, please check out the Glossary of Terms and new subscriber information in section 9.
DOMESTIC EQUITY ETFs: BUY— since 12/01/2022
Click on chart to enlarge
This is our main compass, the Domestic Trend Tracking Index (TTI-green line in the above chart). It has now broken above its long-term trend line (red) by +7.02% and remains in “Buy” mode.
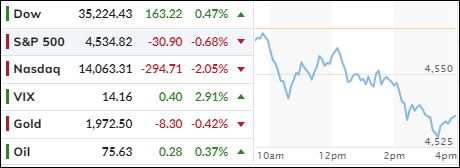
The Dow managed to squeeze out a tiny gain for the 9th day in a row, but the rest of the market was not so lucky. The S&P 500 fell, and the Nasdaq took a big hit.
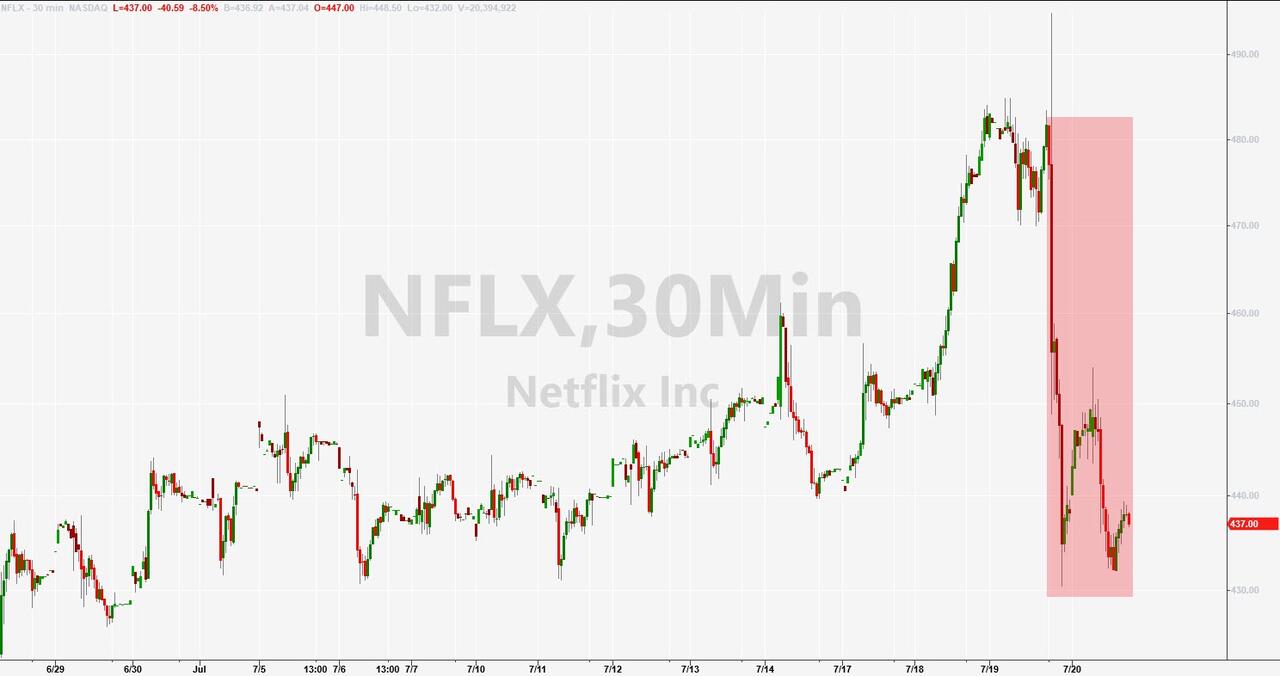
Johnson & Johnson’s strong earnings helped the Dow, but there was no sign of a short squeeze to boost the stock further. The market was weighed down by mixed earnings results, as Netflix lost 8% and Tesla dropped 9% due to production woes.
The Nasdaq also suffered from the news that Taiwan Semiconductor, the world’s biggest chipmaker, cut its revenue forecast for 2023 by half.
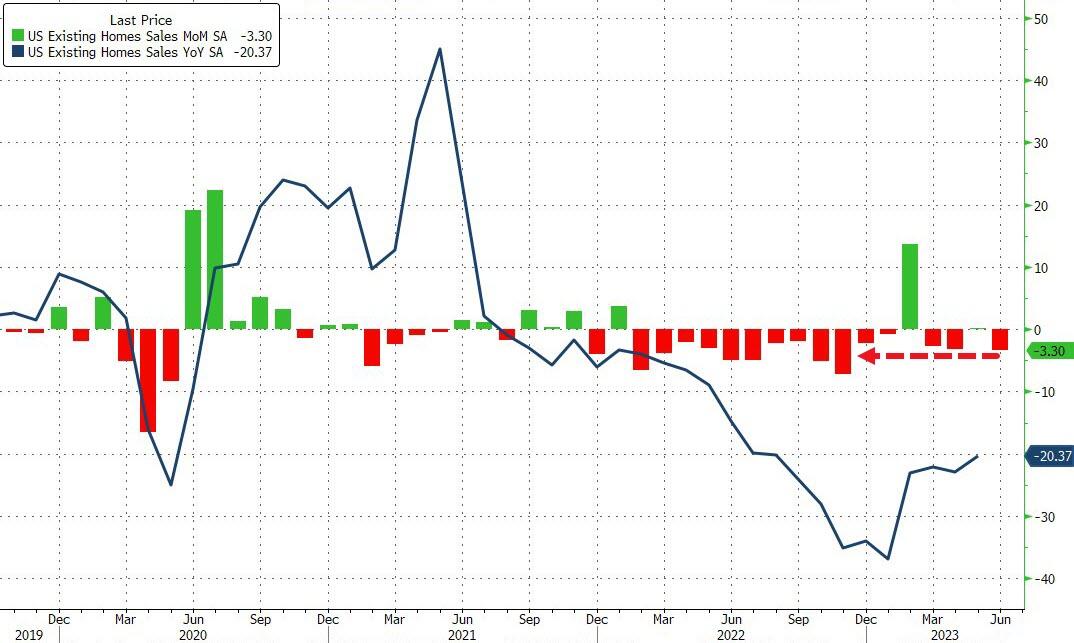
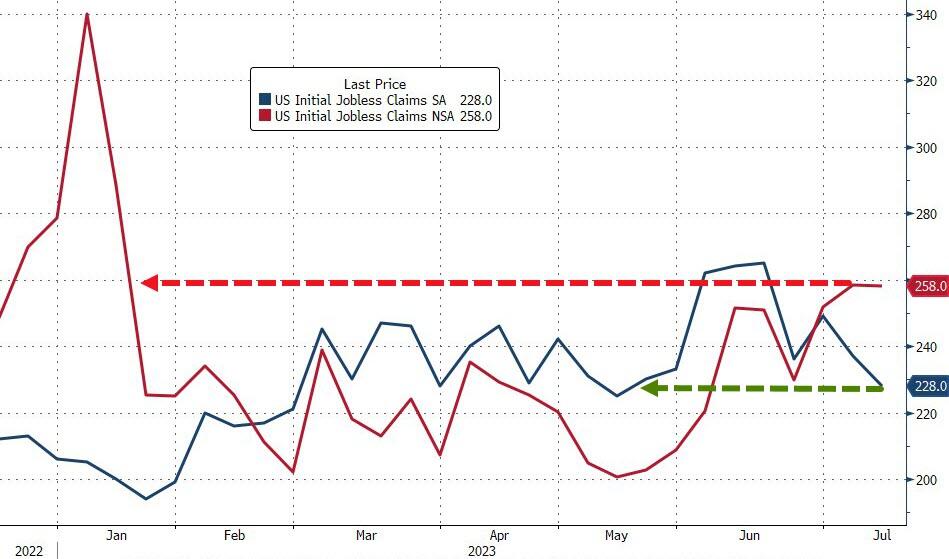
The economic news was not much better, as US home sales plunged in June, the Philly Fed index showed another month of shrinking manufacturing activity, and jobless claims rose to their highest level since January.
Commercial real estate continued to struggle, as another office tower in Baltimore was sold at a huge discount. This was not surprising, as many downtown buildings are losing tenants who prefer to work from home or elsewhere.
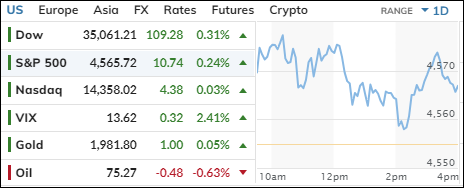
The Dow Jones Industrial Average had another good day on Wednesday, rising for the eighth day in a row with some help from the short squeeze crowd. That’s the longest streak of gains since September 2019, as investors celebrate the strong earnings season, ignoring the fact that the expectations were low to begin with.
The Dow didn’t care about Goldman Sachs’ disappointing earnings report, which showed losses in real estate. The bank had already warned that the quarter would suck, so no one was shocked.
Meanwhile, most of the companies in the S&P 500 that have reported results have beaten the low bar, according to FactSet data. This makes some people think that the economy is slowing down gently, rather than crashing hard.
The inflation data last week also calmed some nerves about rising prices, even though that might have been a fluke. Bank earnings have been less bad than expected and have helped us to forget the spring meltdown. The market is hoping that the banking sector is out of the woods, and that history won’t repeat itself. Yeah, right.
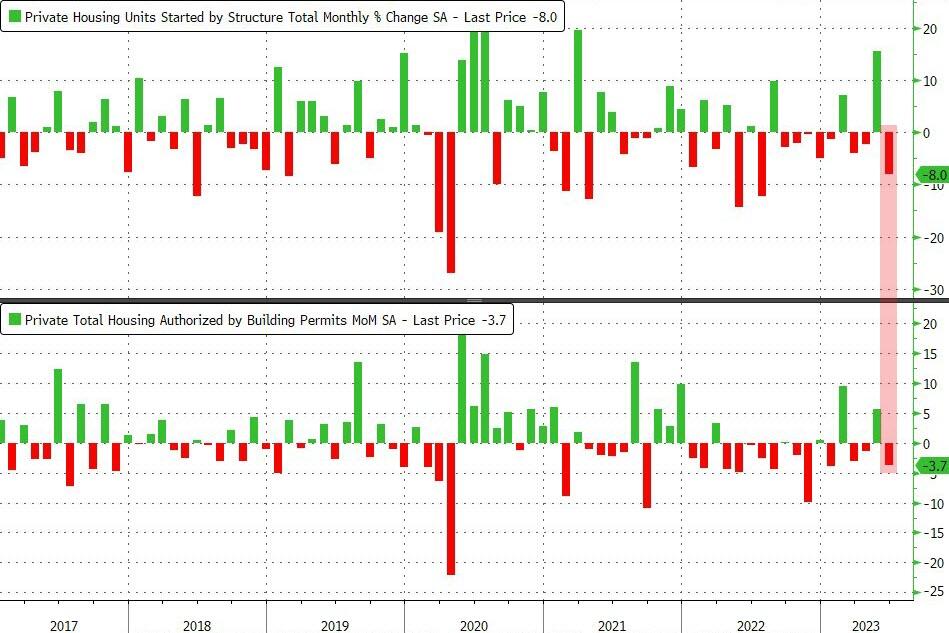
On the flip side, the housing market cooled off a bit in June, as both housing starts and building permits fell from May. Housing starts also got a downward revision for May. The only silver lining was single-family building permits, which rose for the sixth month in a row. Multi-family permits and starts, however, dropped in June.
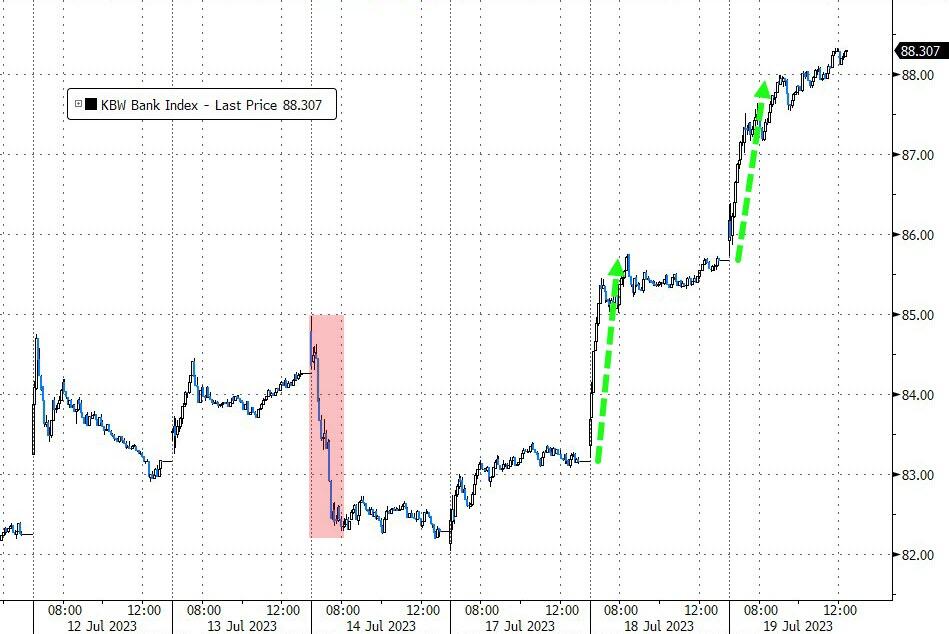
That dragged the US macro data index down another notch, which was the biggest 2-day drop since January 2022. But the KBW banking index kept climbing out of its hole and scored another win.
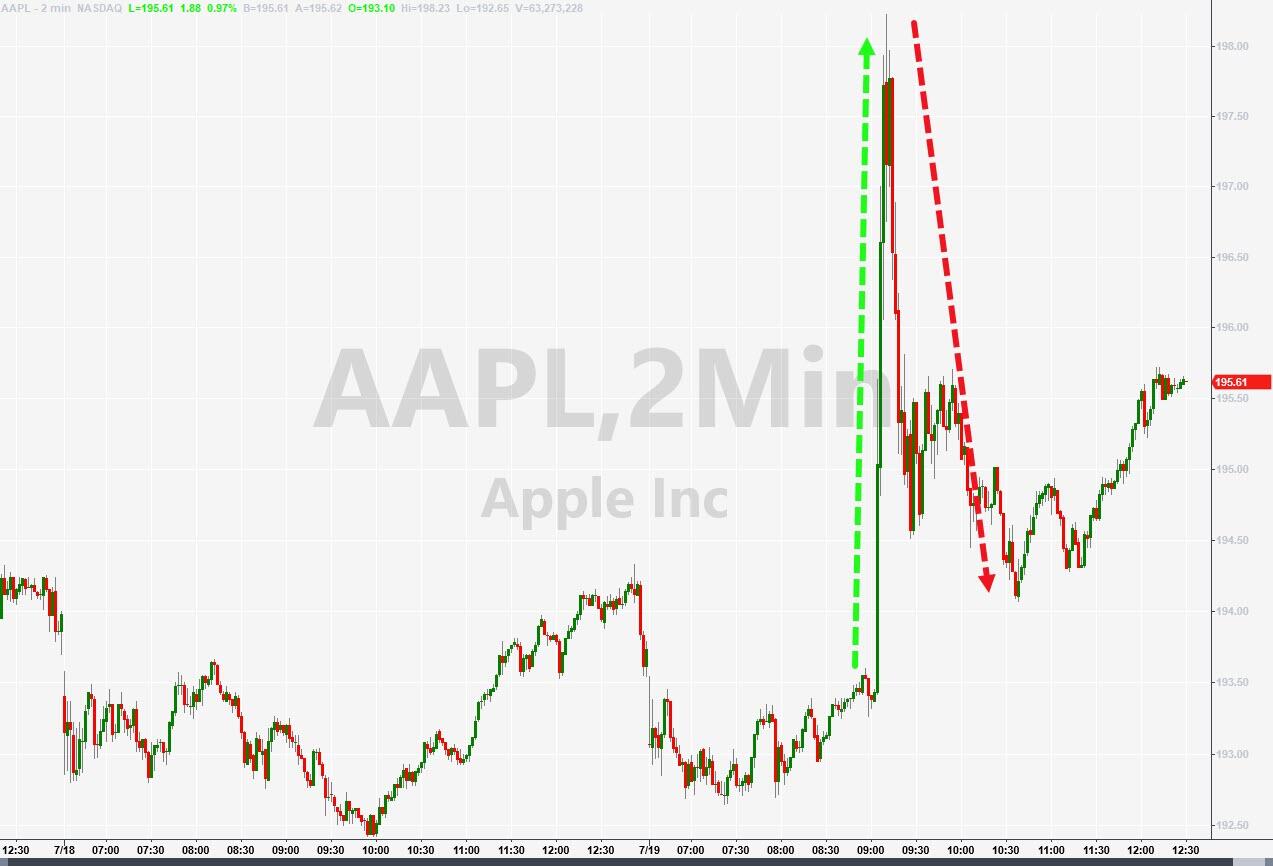
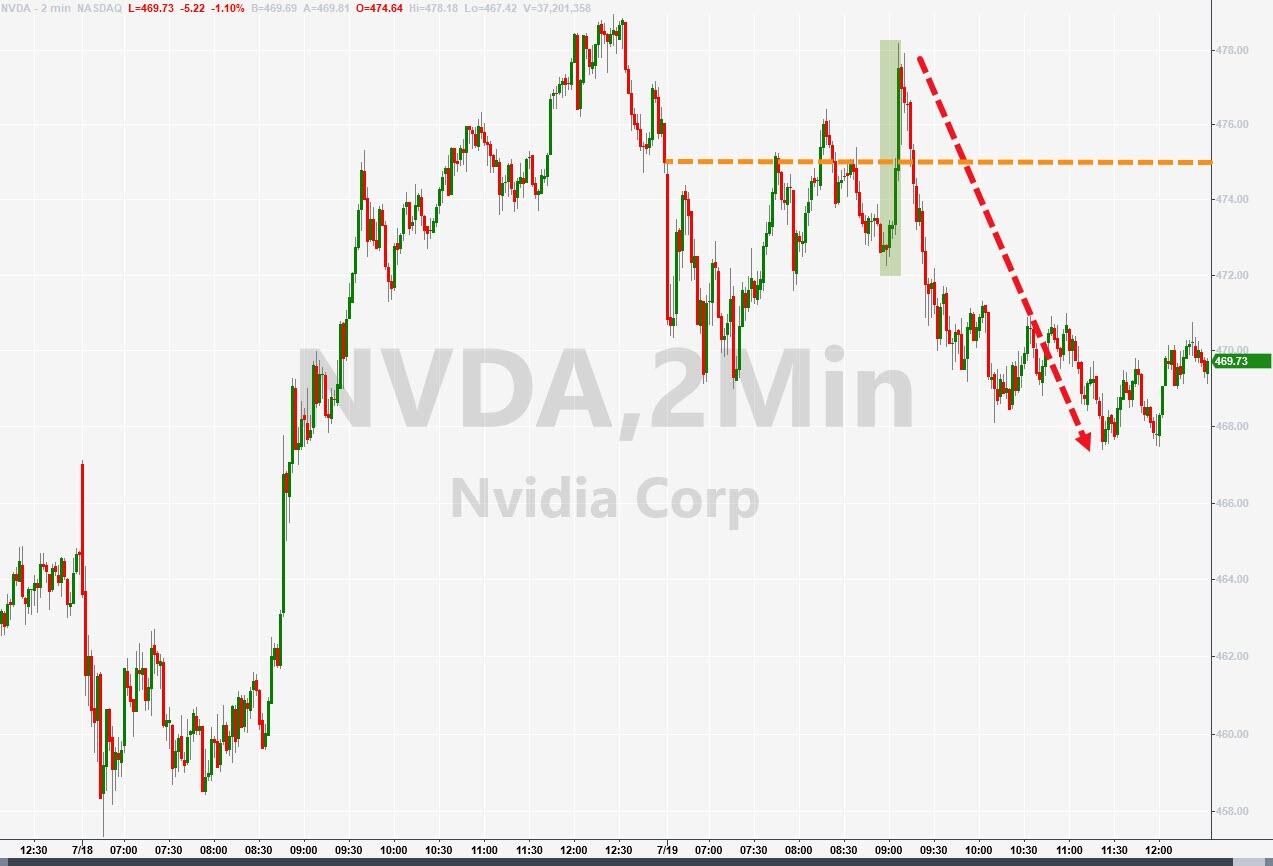
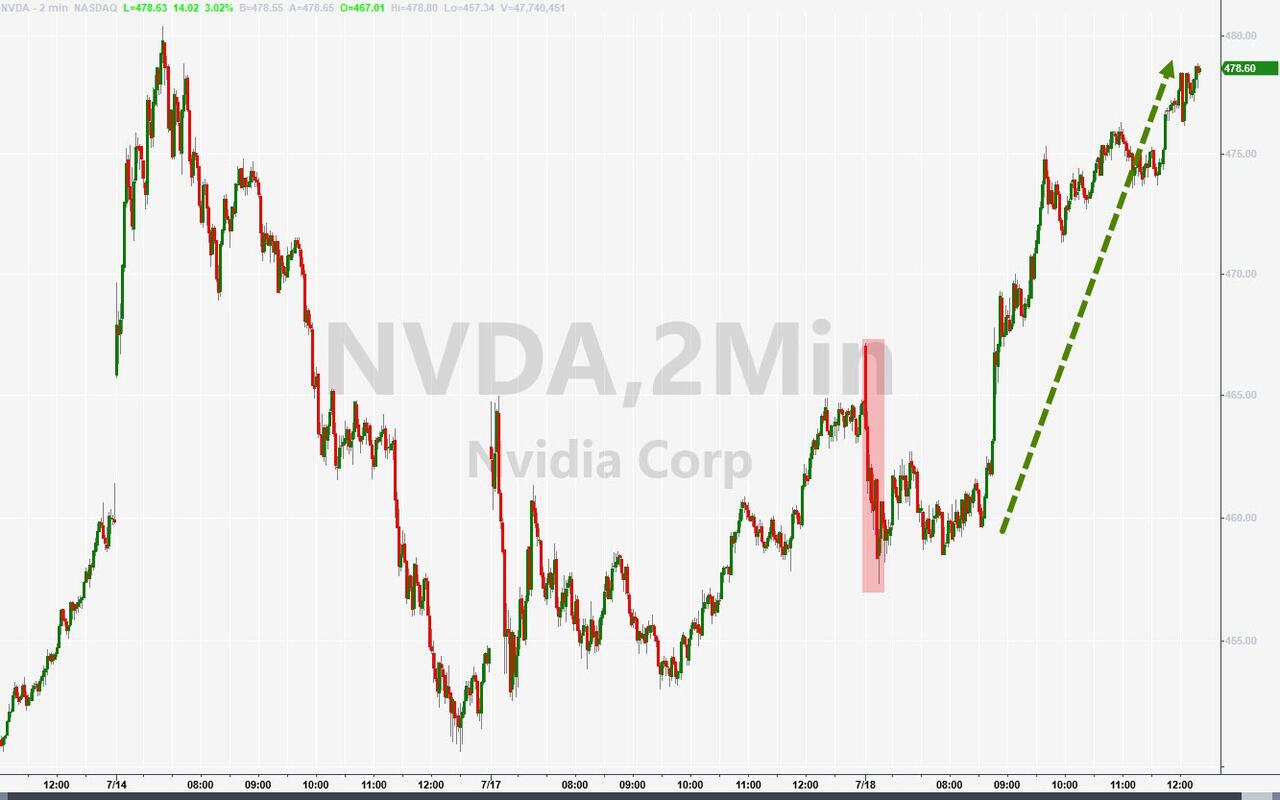
Both Apple and NVDA had a brief scare when news of Apple building an AI platform turned out to be a lame imitation. The stock ripped and dipped but recovered for the day. Sometimes you just have to laugh…
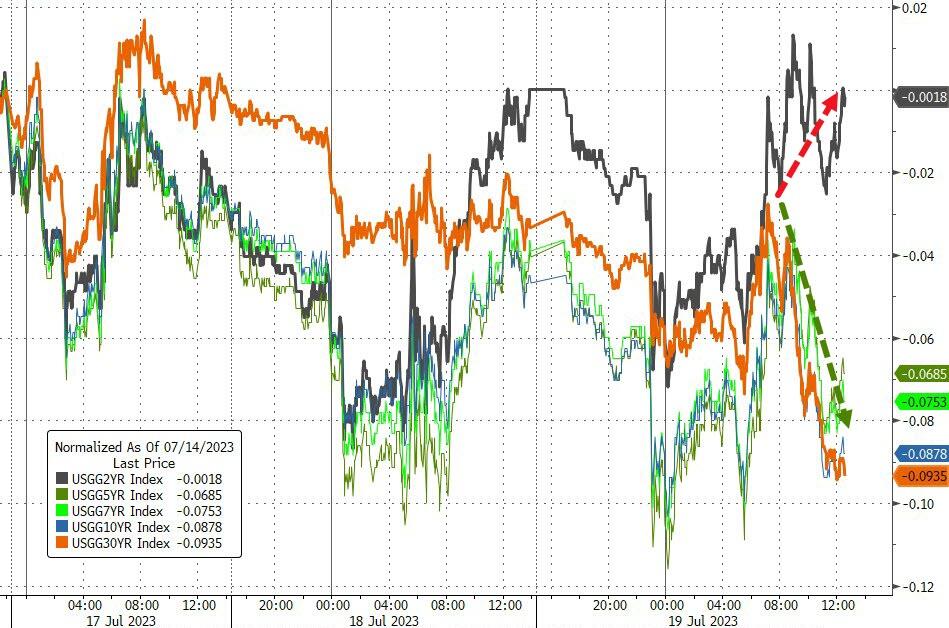
Bond yields were mostly lower, the dollar was stronger, and gold wandered around but ended up slightly higher.
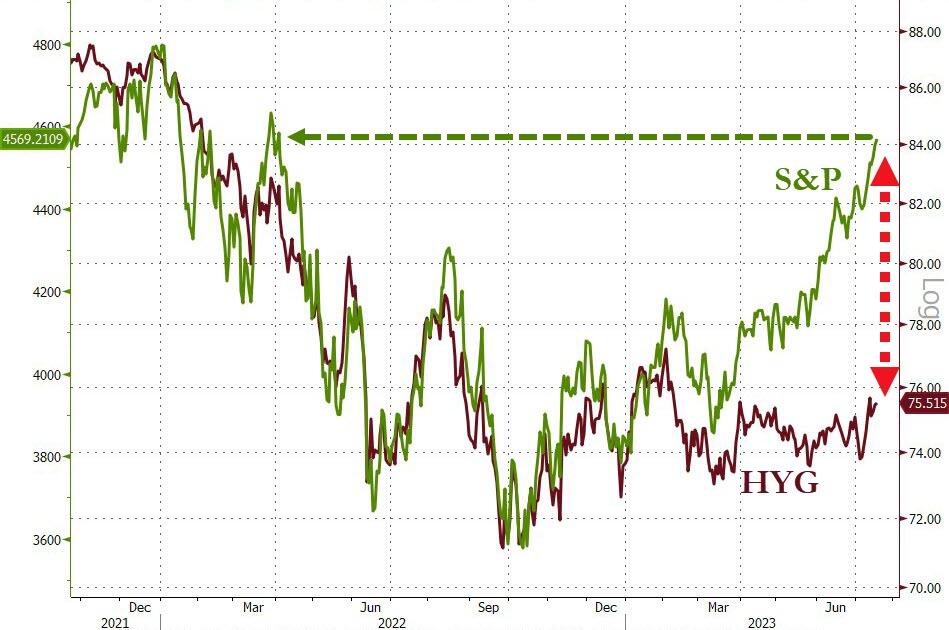
The gap between the S&P 500 and High Yield Credit (HYG) has widened even more, as this chart shows.
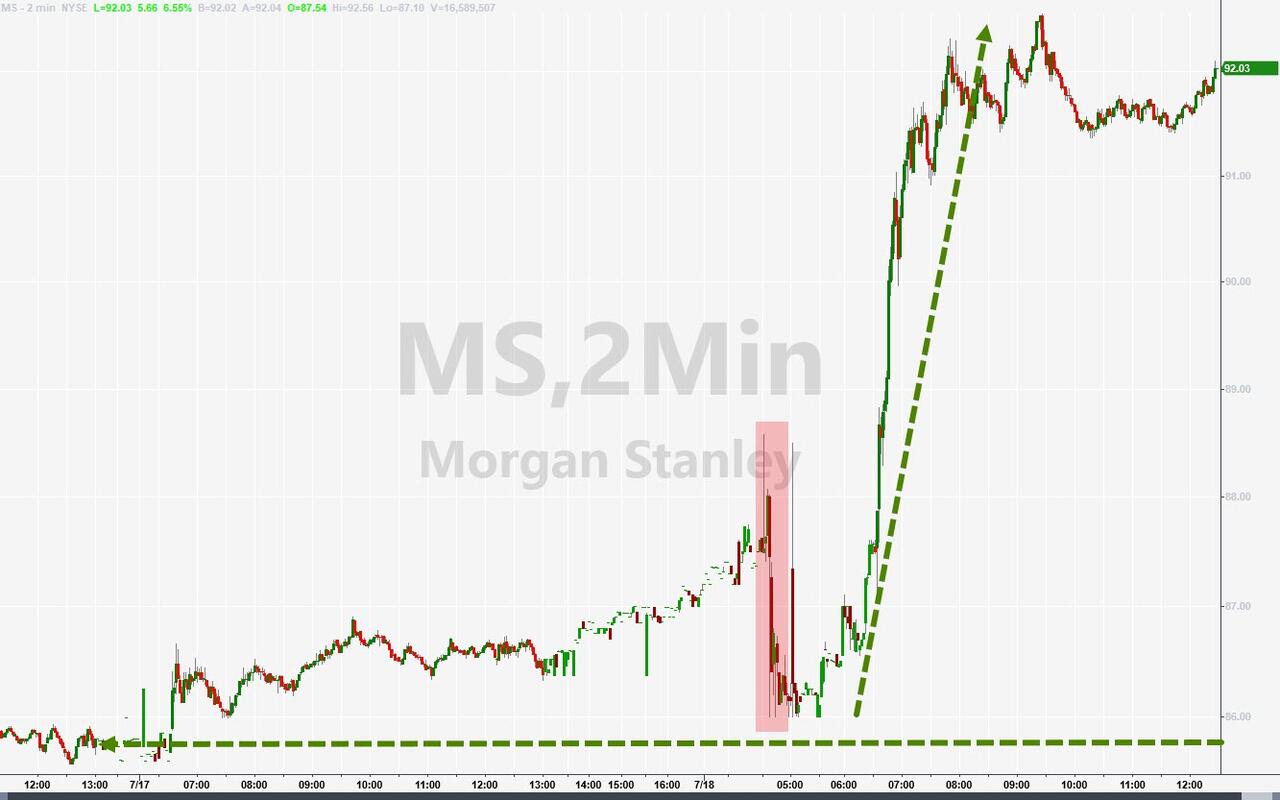
Bank stocks BoA and NY Mellon beat earnings expectations and lifted the market mood, while the short squeeze craze fizzled out. Morgan Stanley and PNC Financial also impressed investors with strong results, especially in wealth management for Morgan Stanley.
According to FactSet, the earnings season is off to a flying start with 84% of the S&P 500 companies that have reported so far surpassing profit estimates. Even a disappointing retail sales report for June, which showed a paltry 0.2% MoM increase vs a forecast of 0.5%, could not dampen the optimism.
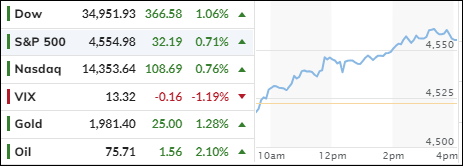
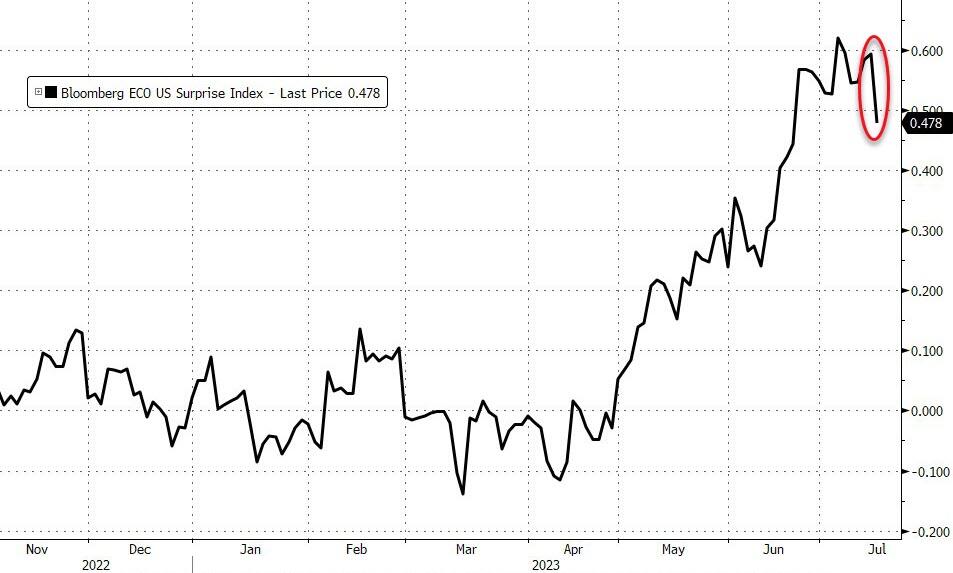
The Dow led the way, but all major indexes posted solid gains, as traders believe that the economy is in a “Goldilocks” zone—not too hot and not too cold. Weak industrial production data was also shrugged off, even though the US Economic Surprise Index took a hit.
As a result, traders are confident that the Fed will hike rates by 0.25% in July, as expected, but will not need to tighten further after that. Sure, whatever.
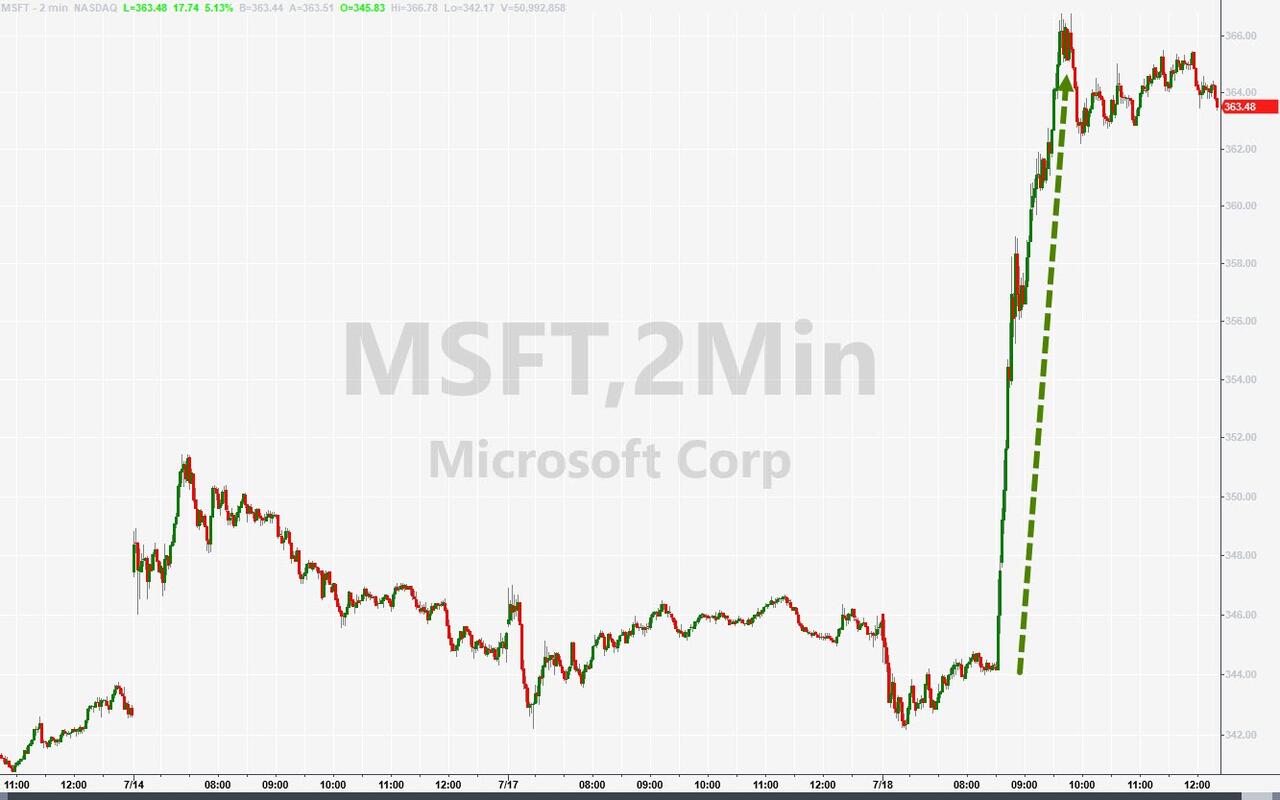
The most dramatic action of the day was between value and growth stocks. Value had the upper hand early on, but then growth staged a comeback, after Microsoft announced new pricing for its AI products. NVDA followed suit and soared higher as well.
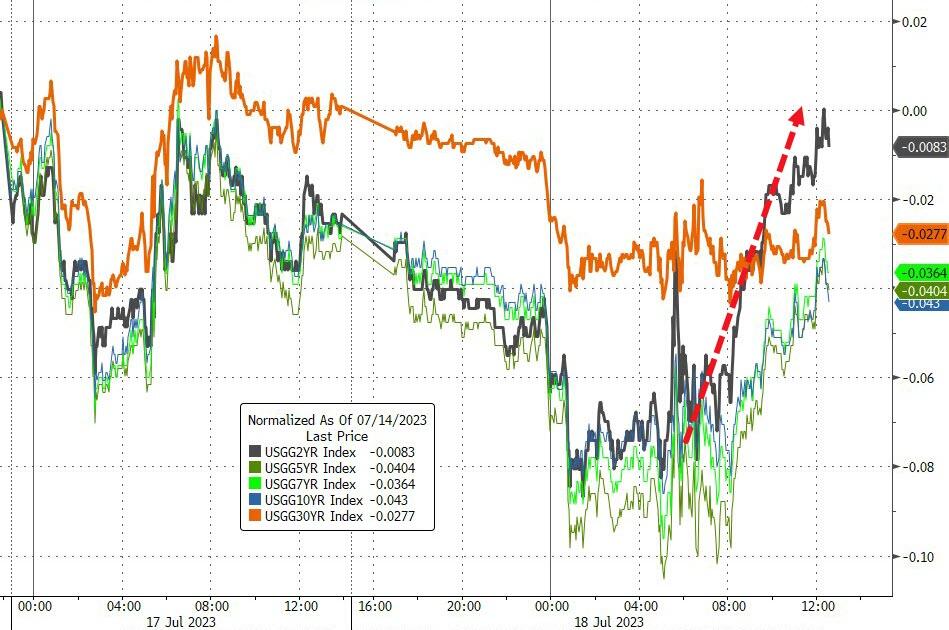
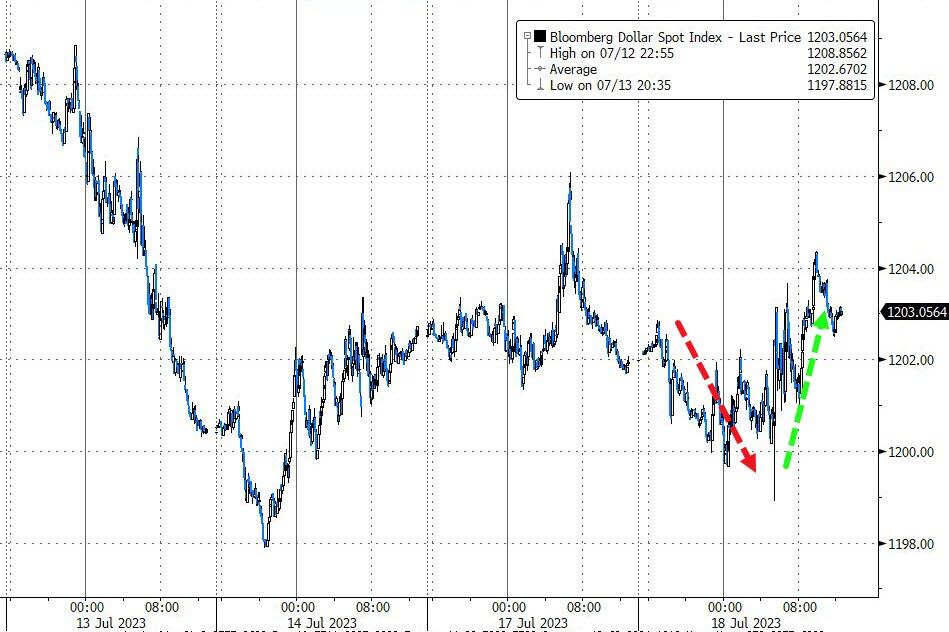
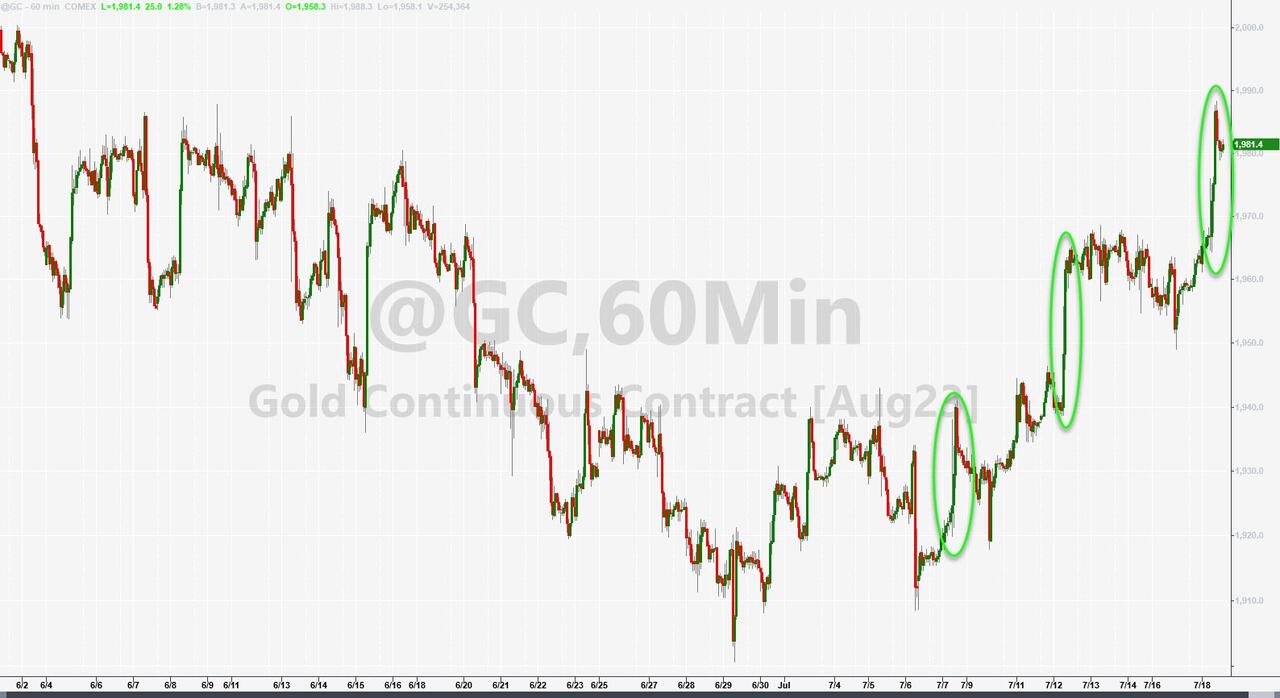
Bond yields were mixed with the 10-year Treasury yield slipping slightly. The dollar bounced back from an early dip and closed slightly higher, while gold was the star performer of the day with a 1.28% gain and a 6-week high.
Looking at the global picture, it’s no secret that liquidity is the main driver of all equity markets. Major stock indexes, like the S&P 500, tend to move in sync with liquidity, but that correlation has broken down for the first time in 10 years, as this chart shows.
Hmm, will this alligator jaw snap shut soon? Or is this time different?