
- Moving the markets
As far as the markets are concerned, uncertainty is the worst of any outcome, a theory which proved to be the correct today, as the results of the midterm elections provided no clear answers as to who would control Congress or the Senate.
Traders had assumed the Republicans being able to easily score most of the House seats, which had formed the basis for the 3-day rally. The idea was that any future spending and tax plans would consequently be blocked.
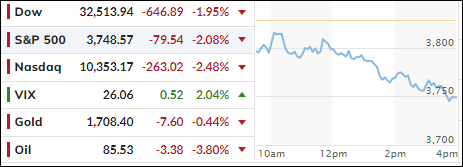
That did not happen, so the markets tanked across the board and, in the process, wiped out just about all recent gains, which pulled the S&P 500 back down to last Wednesday’s level.
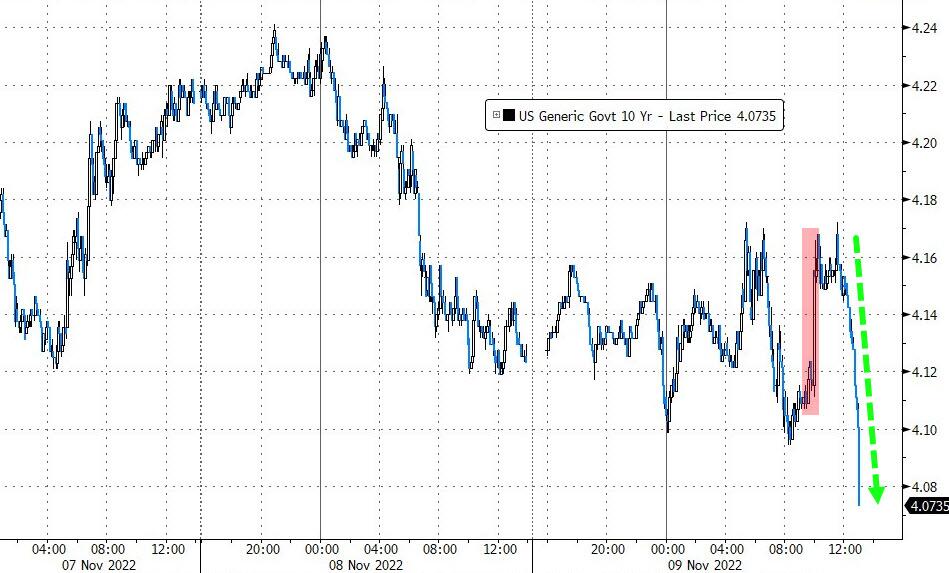
Another extremely negative market influence were liquidity troubles for the crypto exchange FTX (it faces a federal probe), and it appeared that a potential takeover by Binance would not go through, causing some bond yields to retreat sharply as the flight to safety was on. The 10-year yield dropped almost 13bps to close at 4.083%.
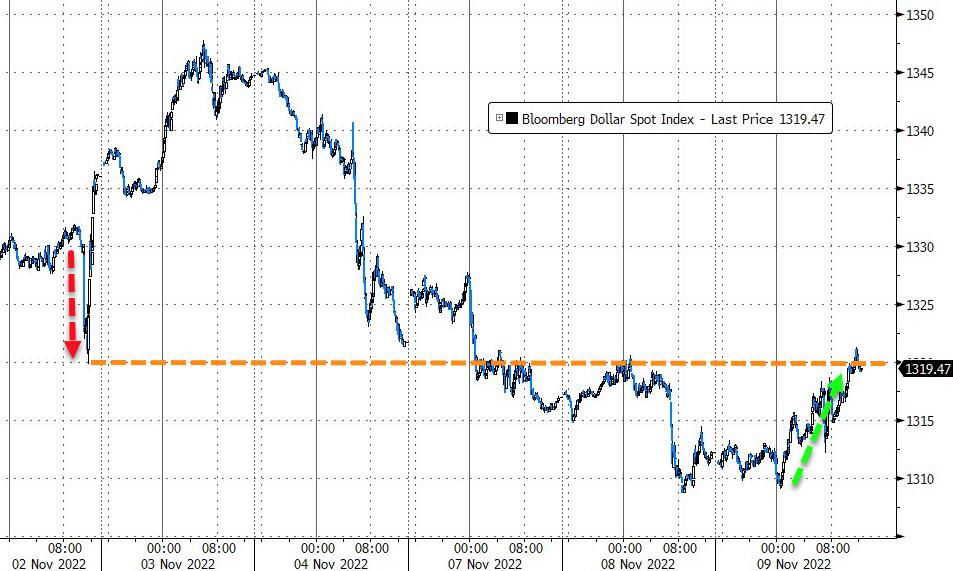
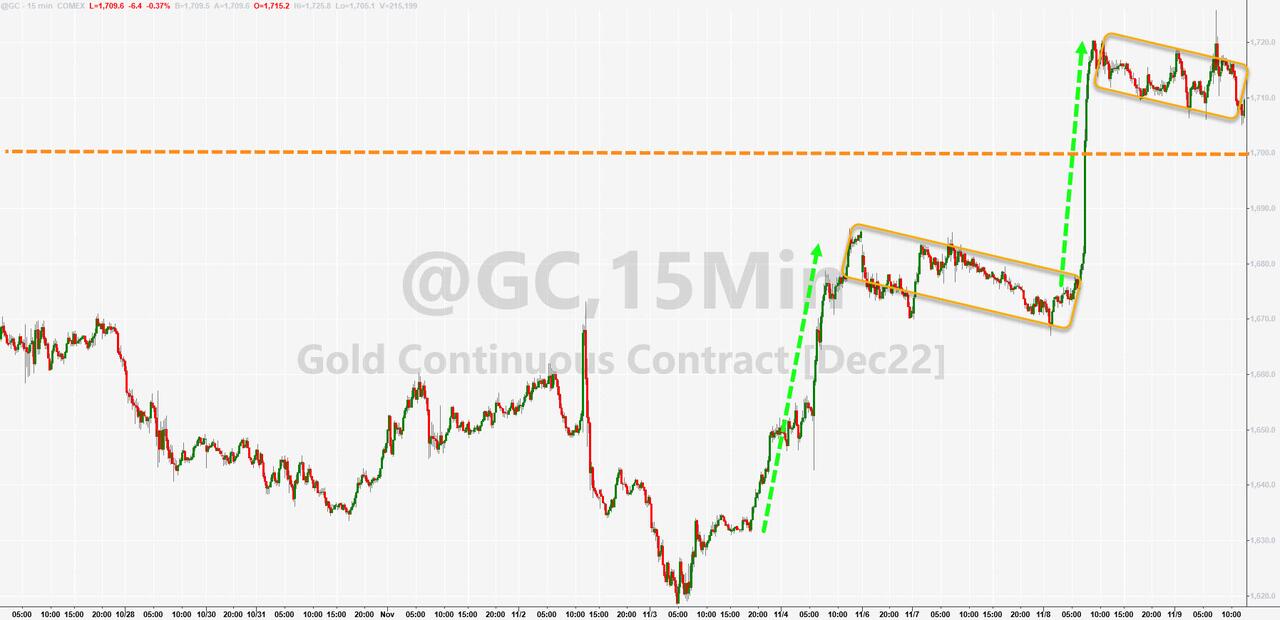
The US Dollar rebounded, while gold held on to most of yesterday’s gains.
The CPI is on deck tomorrow and may give the bulls some hope, if the number comes in below expectations.
2. ETFs in the Spotlight
In case you missed the announcement and description of this section, you can read it here again.
It features some of the 10 broadly diversified domestic and sector ETFs from my HighVolume list as posted every Saturday. Furthermore, they are screened for the lowest MaxDD% number meaning they have been showing better resistance to temporary sell offs than all others over the past year.
The below table simply demonstrates the magnitude with which these ETFs are fluctuating above or below their respective individual trend lines (%+/-M/A). A break below, represented by a negative number, shows weakness, while a break above, represented by a positive percentage, shows strength.
For hundreds of ETF choices, be sure to reference Thursday’s StatSheet.
For this closed-out domestic “Buy” cycle (2/24/2022), here’s how some of our candidates have fared. Keep in mind that our Domestic Trend Tracking Index (TTI) signaled a “Sell” on that date, which overrode the existing “Buys” shown for SPY and IYM:
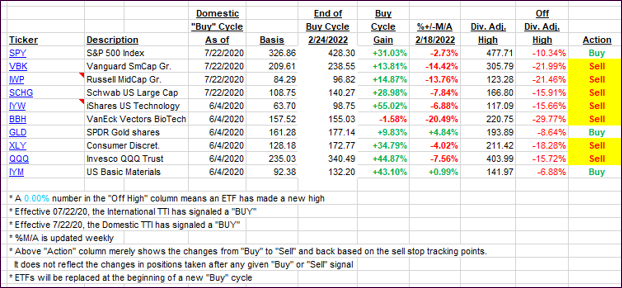
Click image to enlarge.
Again, the %+/-M/A column above shows the position of the various ETFs in relation to their respective long-term trend lines, while the trailing sell stops are being tracked in the “Off High” column. The “Action” column will signal a “Sell” once the -12% point has been taken out in the “Off High” column, which has replaced the prior -8% to -10% limits.
3. Trend Tracking Indexes (TTIs)
Our TTIs reversed as the broad market dumped.
This is how we closed 11/09/2022:
Domestic TTI: -4.21% below its M/A (prior close -2.46%)—Sell signal effective 02/24/2022.
International TTI: -5.29% below its M/A (prior close -3.96%)—Sell signal effective 03/08/2022.
Disclosure: I am obliged to inform you that I, as well as my advisory clients, own some of the ETFs listed in the above table. Furthermore, they do not represent a specific investment recommendation for you, they merely show which ETFs from the universe I track are falling within the specified guidelines.
All linked charts above are courtesy of Bloomberg via ZeroHedge.
Contact Ulli