
- Moving the markets
A bucking bronco type of market behavior seemed to be perfectly complementing this election day with its own ups and downs, irregularities, and accusations.
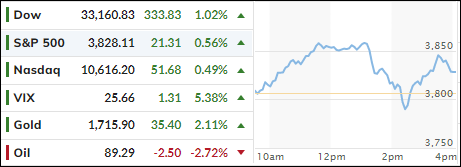
The major indexes stormed out of the gate and ripped higher with the Dow at one point sporting a 500-point gain, which collapsed, as the index almost broke below its unchanged line. However, bullish momentum reappeared, and all the majors managed to score a green close.
The initial ramp was based on traders’ hopes that in case the Republicans take back the House, a gridlock in Washington would be the result, a scenario which is viewed as a positive because, with a divided Congress and President, government spending, new taxes and regulations will be limited. At least, that’s the theory.
The US Dollar plunged to 7-week lows and, as ZeroHedge pointed out, is its biggest 3-day dive since March 2020. As one analyst noted, “it’s been the dollar’s demise that has been driving this bounce in stocks…”
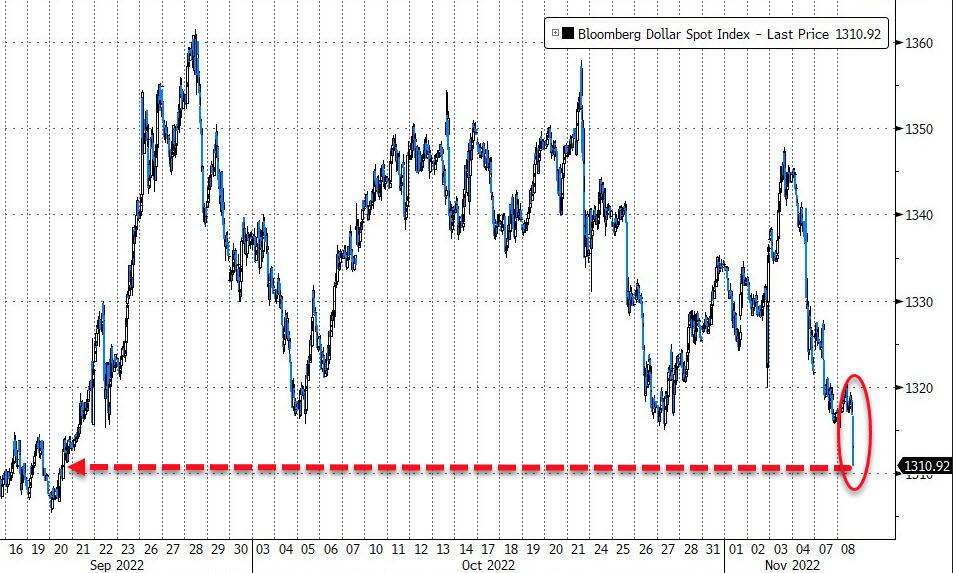
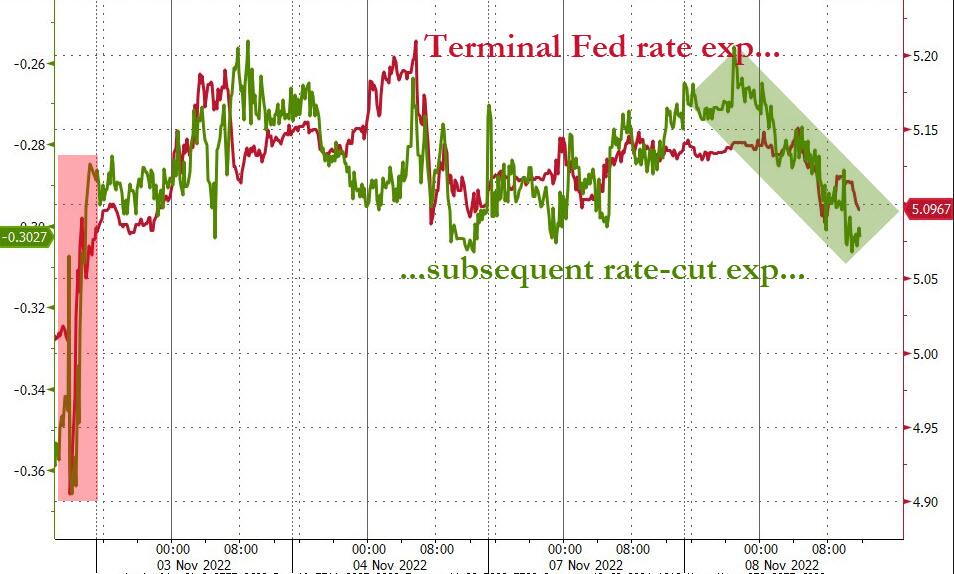
The beneficiary was gold, as the precious metal spiked +2.13% to over $1,700, which represents a 5-week high. Also giving an assist to stocks were declining bond yields, as market expectations for Fed rate trajectories changed from hawkish to dovish today.
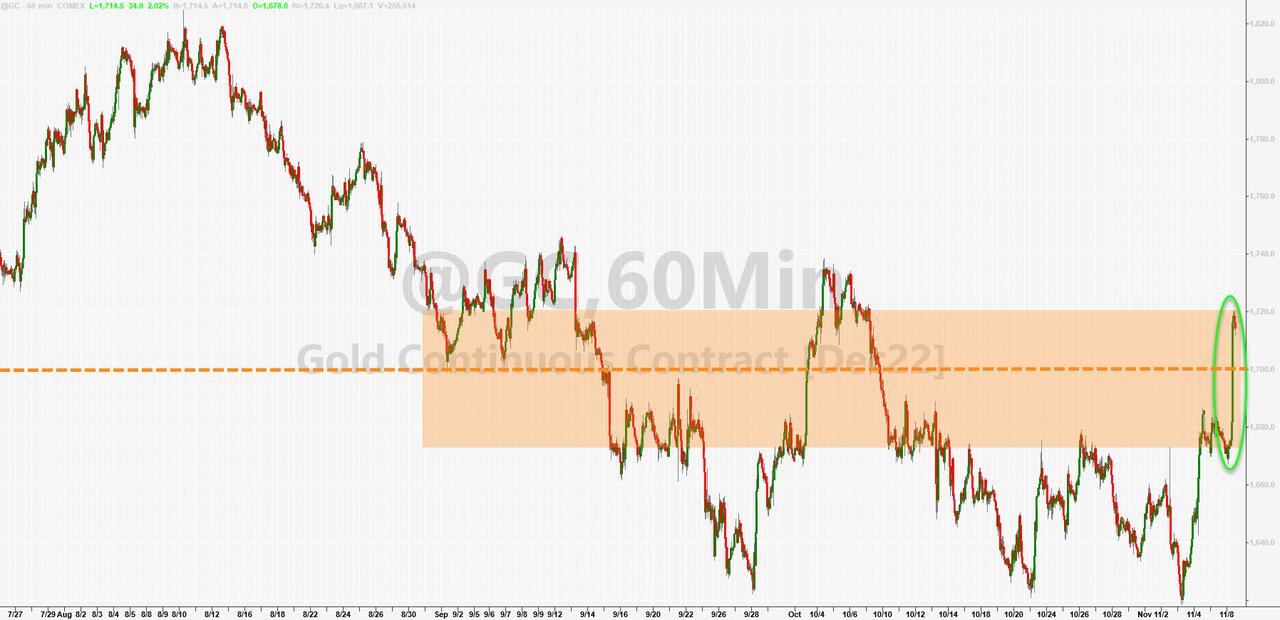
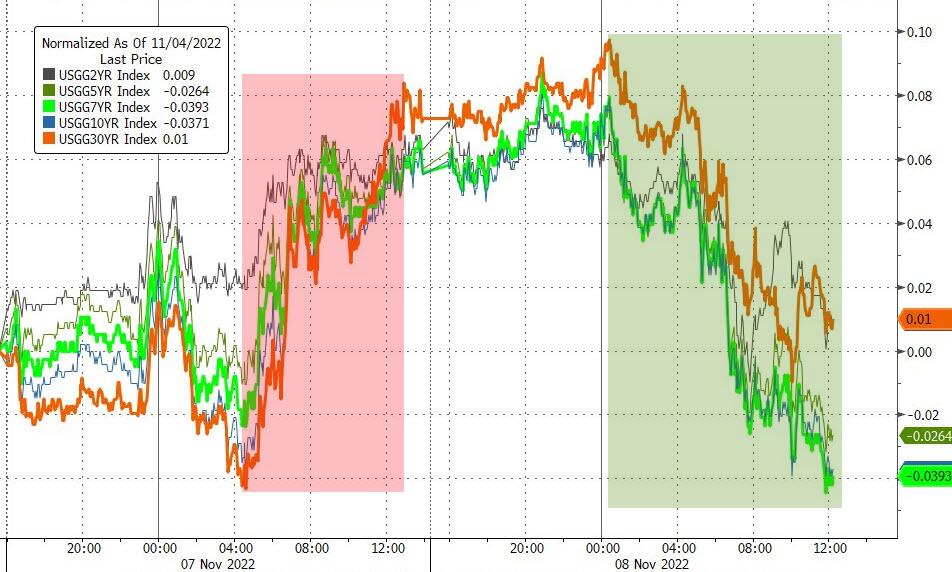
Should market election probabilities not be met, we will see this bear market rally hit the skids, which it may do anyway, should Thursday’s CPI report confirm that we have not yet hit peak inflation.
2. ETFs in the Spotlight
In case you missed the announcement and description of this section, you can read it here again.
It features some of the 10 broadly diversified domestic and sector ETFs from my HighVolume list as posted every Saturday. Furthermore, they are screened for the lowest MaxDD% number meaning they have been showing better resistance to temporary sell offs than all others over the past year.
The below table simply demonstrates the magnitude with which these ETFs are fluctuating above or below their respective individual trend lines (%+/-M/A). A break below, represented by a negative number, shows weakness, while a break above, represented by a positive percentage, shows strength.
For hundreds of ETF choices, be sure to reference Thursday’s StatSheet.
For this closed-out domestic “Buy” cycle (2/24/2022), here’s how some of our candidates have fared. Keep in mind that our Domestic Trend Tracking Index (TTI) signaled a “Sell” on that date, which overrode the existing “Buys” shown for SPY and IYM:
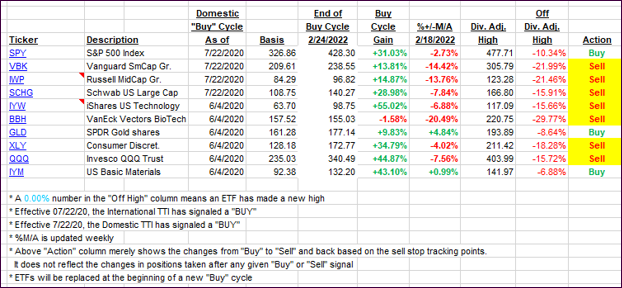
Click image to enlarge.
Again, the %+/-M/A column above shows the position of the various ETFs in relation to their respective long-term trend lines, while the trailing sell stops are being tracked in the “Off High” column. The “Action” column will signal a “Sell” once the -12% point has been taken out in the “Off High” column, which has replaced the prior -8% to -10% limits.
3. Trend Tracking Indexes (TTIs)
Our TTIs inched closer to their respective long-term trend lines.
This is how we closed 11/08/2022:
Domestic TTI: -2.46% below its M/A (prior close -3.03%)—Sell signal effective 02/24/2022.
International TTI: -3.96% below its M/A (prior close -4.90%)—Sell signal effective 03/08/2022.
Disclosure: I am obliged to inform you that I, as well as my advisory clients, own some of the ETFs listed in the above table. Furthermore, they do not represent a specific investment recommendation for you, they merely show which ETFs from the universe I track are falling within the specified guidelines.
All linked charts above are courtesy of Bloomberg via ZeroHedge.
Contact Ulli