
- Moving the markets
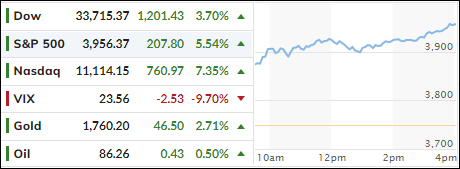
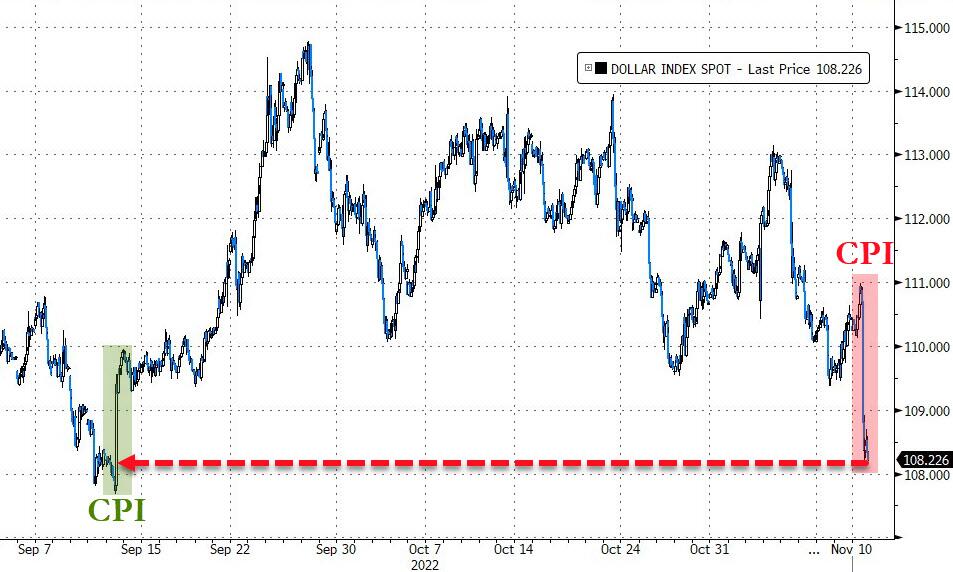
Only one thing mattered today, and that was the CPI reading, which came in much more “friendly” than expected. The index rose only 0.4% for the month and 7.7% YoY, its lowest annual increase since January. Expectations were 0.6% and 7.9% respectively. Even the core numbers were better than anticipated.
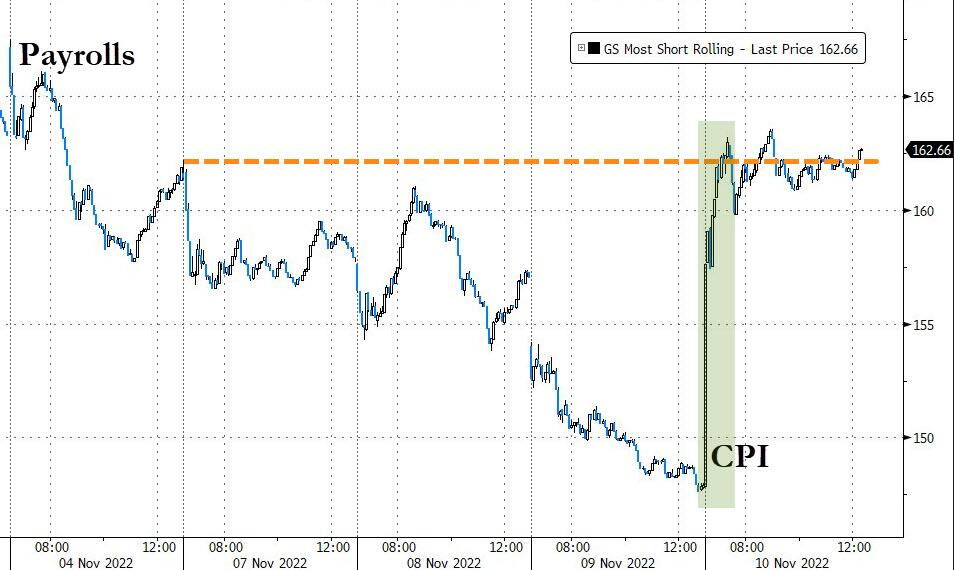
The market reaction was extremely bullish with the Dow jumping immediately some 800 points and headed higher from there with all major indexes following suit. All activity was supported by the 3rd biggest short squeeze ever.
ZeroHedge summed up today’s 5 Fed speakers like this:
So, all 5 Fed speakers confirmed higher rates from here, 3 signaled somewhat less hawkishly, 1 signaled a slight fear of overtightening, and 1 was full-hawktard.
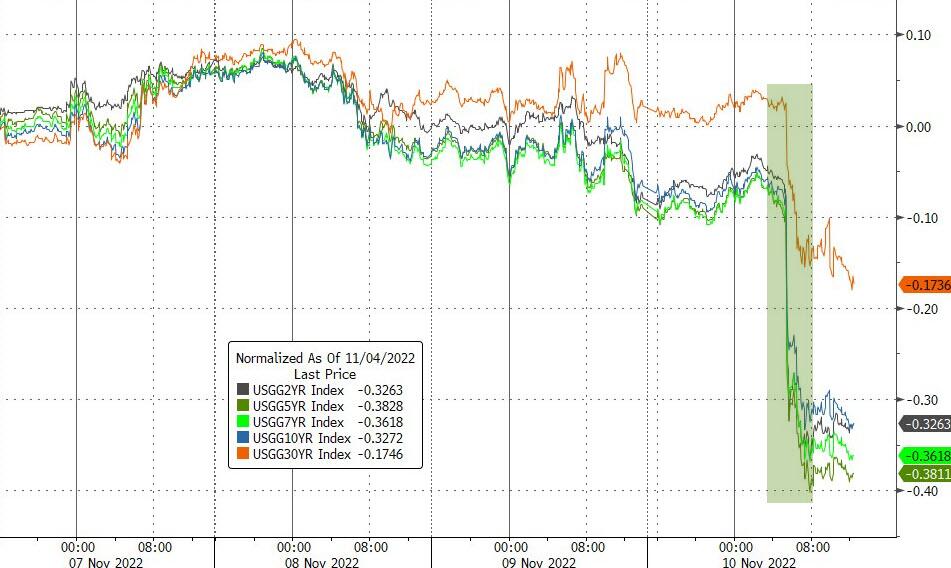
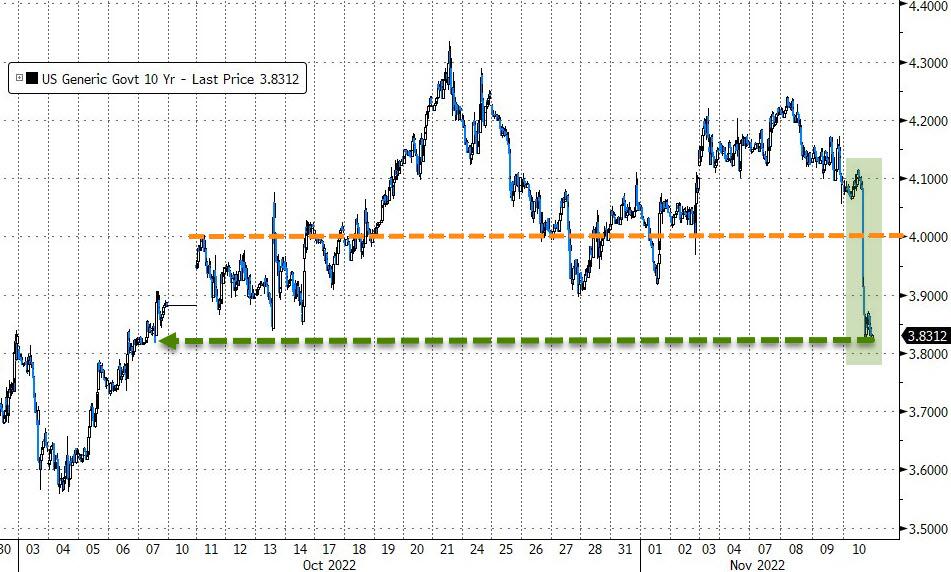
Bond yields dumped with the 10-year getting crushed, down an incredible 31 basis points to close the session at 3.823%.
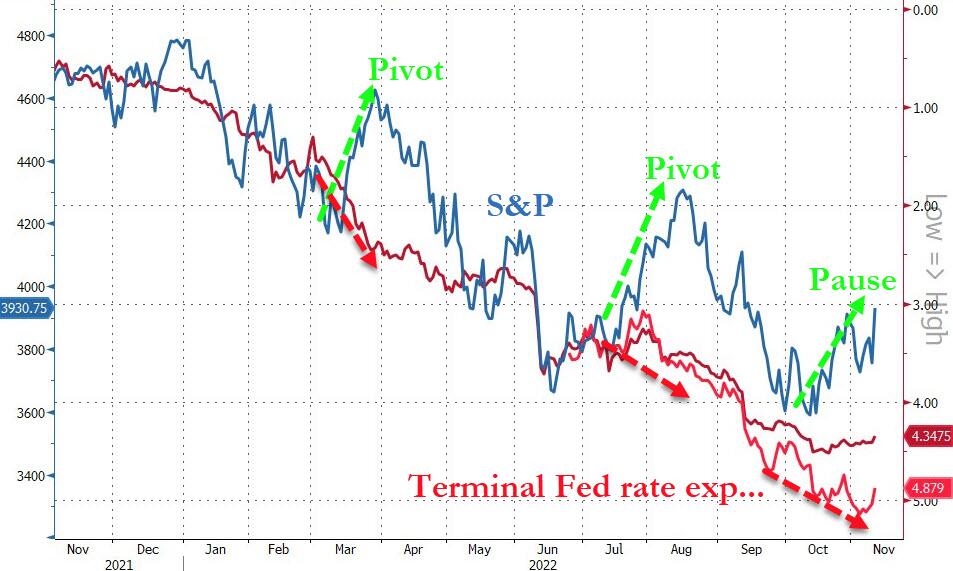
As a result, the US Dollar plunged causing gold to have a good day with a +2.67% gain. The S&P 500 jumped over 5%, which was its biggest rally in two years. Whether this “light” inflation report will remain the same in the future is questionable, but for right now those traders believing in the idea that we have seen peak inflation and peak Fed (rate hikes) are enjoying their day in the spotlight.
This broad Ramp-A-Thon has pushed our main directional indicator slightly above its long-term trend line by a tiny +0.93% (section 3), its first peek above it since July. That event lasted only one week, before the bears took over and pushed the index to new yearly lows.
As a result, I like to see a few days of staying power above the line before officially issuing a new “Buy” signal for domestic equity funds. Being a little more selective about the entry point has helped us avoid whipsaw signals in the past.
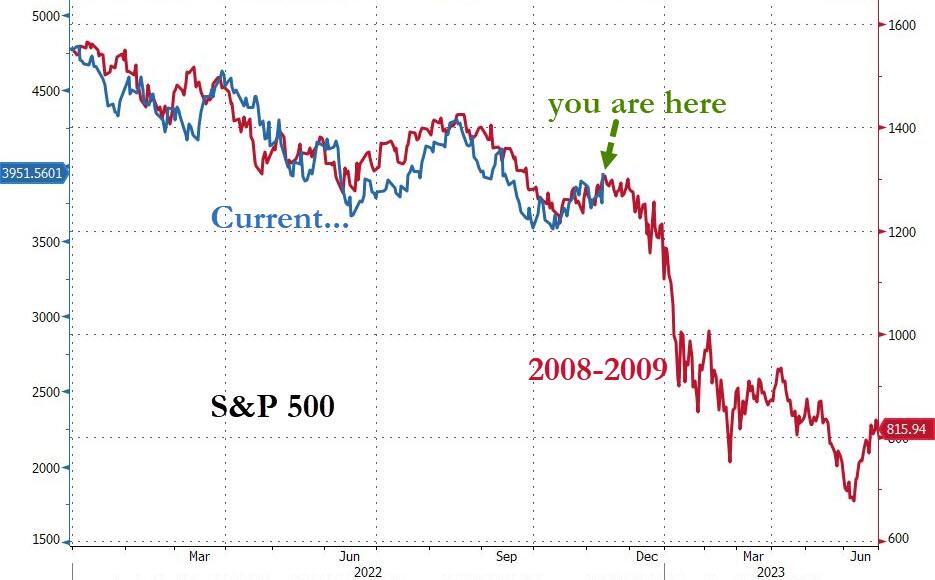
Updating the historical analog, we find ourselves in this eerily similar spot.
2. ETFs in the Spotlight
In case you missed the announcement and description of this section, you can read it here again.
It features some of the 10 broadly diversified domestic and sector ETFs from my HighVolume list as posted every Saturday. Furthermore, they are screened for the lowest MaxDD% number meaning they have been showing better resistance to temporary sell offs than all others over the past year.
The below table simply demonstrates the magnitude with which these ETFs are fluctuating above or below their respective individual trend lines (%+/-M/A). A break below, represented by a negative number, shows weakness, while a break above, represented by a positive percentage, shows strength.
For hundreds of ETF choices, be sure to reference Thursday’s StatSheet.
For this closed-out domestic “Buy” cycle (2/24/2022), here’s how some of our candidates have fared. Keep in mind that our Domestic Trend Tracking Index (TTI) signaled a “Sell” on that date, which overrode the existing “Buys” shown for SPY and IYM:
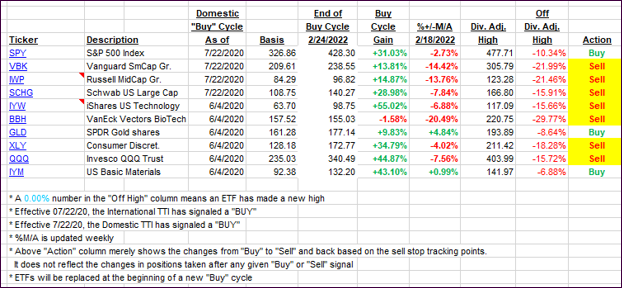
Click image to enlarge.
Again, the %+/-M/A column above shows the position of the various ETFs in relation to their respective long-term trend lines, while the trailing sell stops are being tracked in the “Off High” column. The “Action” column will signal a “Sell” once the -12% point has been taken out in the “Off High” column, which has replaced the prior -8% to -10% limits.
3. Trend Tracking Indexes (TTIs)
Our TTIs gained ground with the Domestic one now having pierced its trend line to the upside for the first time since July. I need to see some staying power before issuing a new “Buy,” to increase our odds of avoiding a potential whipsaw signal.
This is how we closed 11/10/2022:
Domestic TTI: +0.93% above its M/A (prior close -4.21%)—Sell signal effective 02/24/2022.
International TTI: -1.67% below its M/A (prior close -5.29%)—Sell signal effective 03/08/2022.
Disclosure: I am obliged to inform you that I, as well as my advisory clients, own some of the ETFs listed in the above table. Furthermore, they do not represent a specific investment recommendation for you, they merely show which ETFs from the universe I track are falling within the specified guidelines.
All linked charts above are courtesy of Bloomberg via ZeroHedge.
Contact Ulli