
- Moving the market
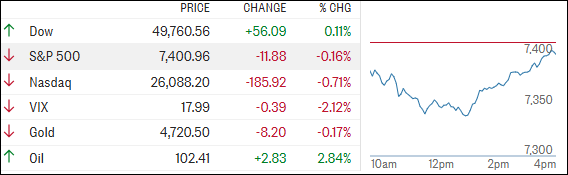
The major indexes slid right out of the gate, pressured by rising oil prices as traders digested a hotter‑than‑expected April CPI report. Inflation worries quickly took center stage.
West Texas Intermediate crude jumped 3%, pushing back above $101 a barrel, adding fuel to concerns that higher energy costs could keep inflation sticky.
The move built on Monday’s oil rally, which followed President Trump calling the month‑old U.S.–Iran ceasefire “unbelievably weak” and “on massive life support” after rejecting what he labeled an unacceptable counterproposal from Tehran.
Iran’s latest offer reportedly included demands for war reparations, full control of the Strait of Hormuz, the release of frozen assets, and the lifting of sanctions—terms that appear to have stalled any real progress toward peace.
Against that backdrop, inflation data drew extra scrutiny. The CPI rose 0.6% in April, pushing the year‑over‑year rate to 3.8%, slightly above expectations of 3.7% and the highest reading since May 2023.
It wasn’t a sudden spike, but rather another step higher—suggesting inflation pressures may continue to build if the Middle East conflict drags on.
Markets managed to recover some ground late in the session, but the damage was already done.
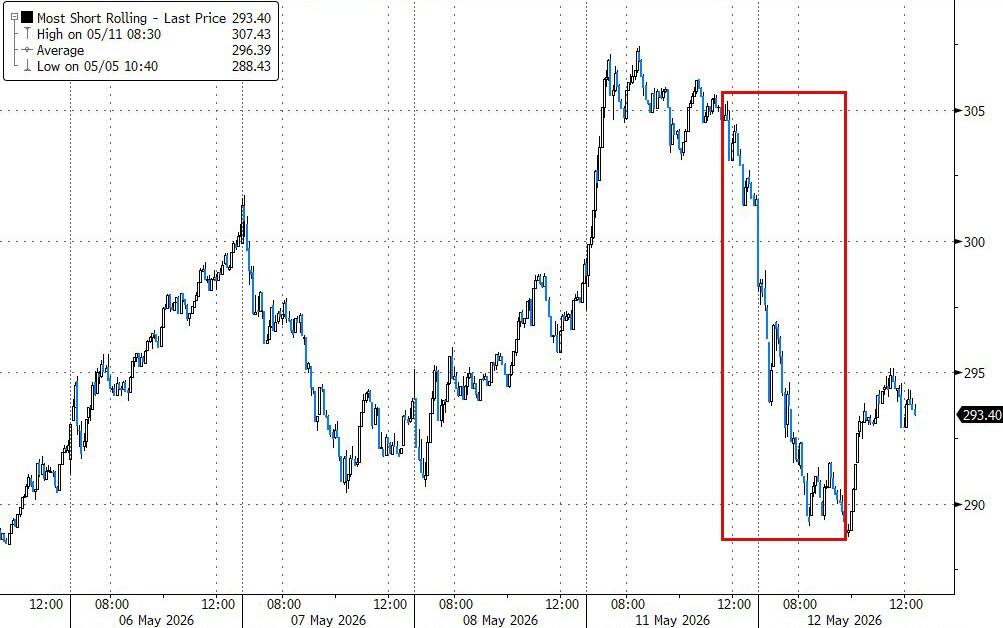
Only the Dow eked out a marginal gain, while the S&P 500 finished flat and the Nasdaq remained in the red. Small Caps were hit hard, though they did bounce off their worst levels.
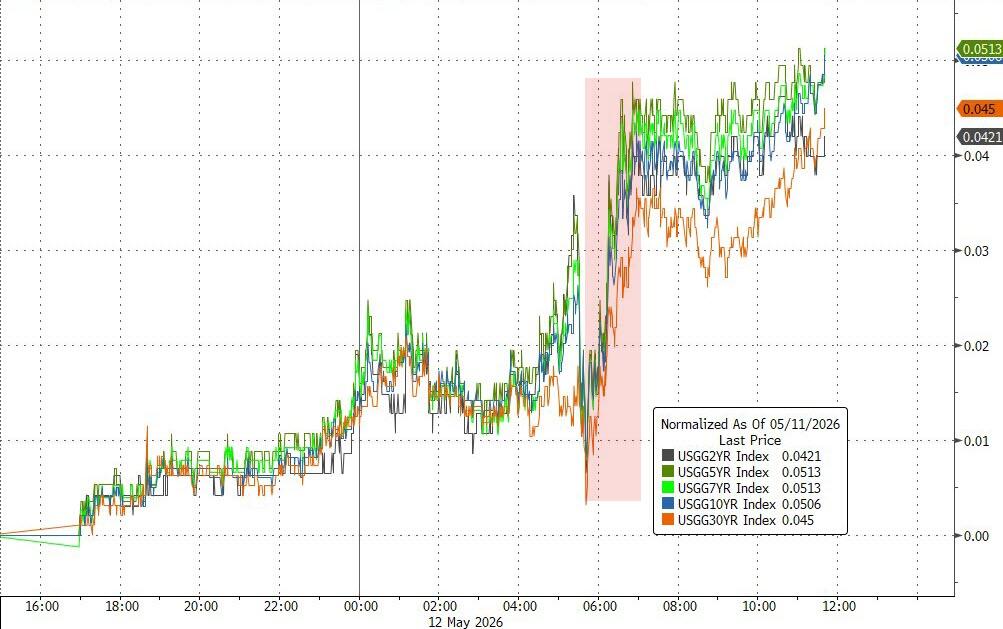
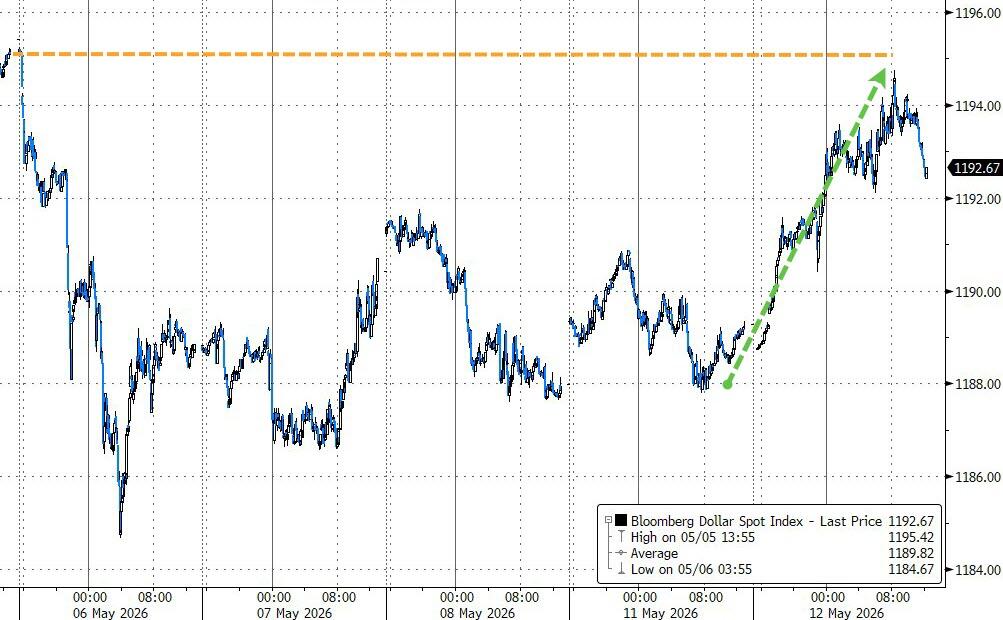
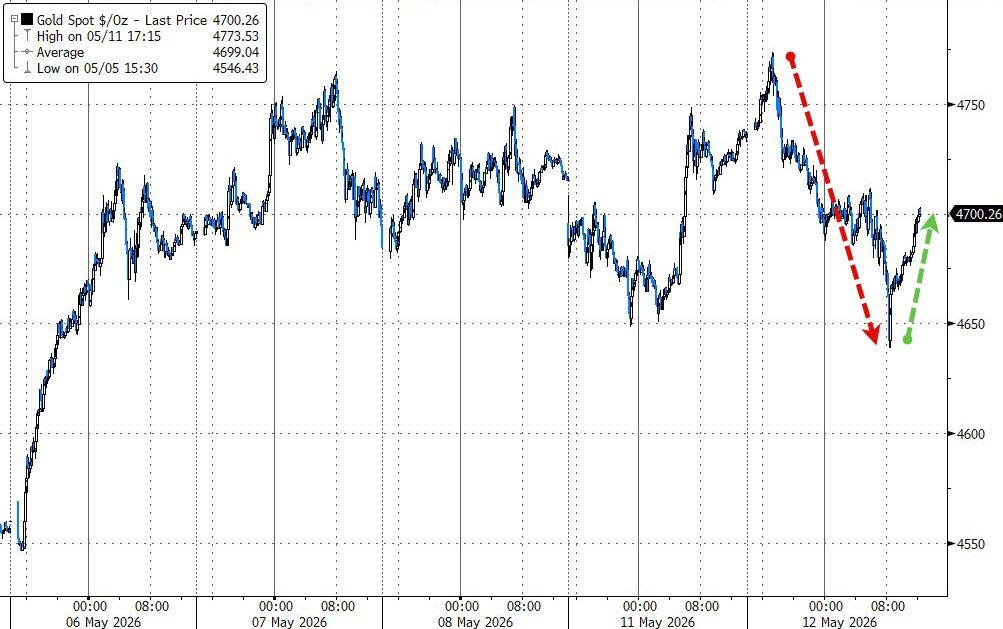
Elsewhere, bond yields climbed, the dollar rallied back toward last week’s highs, and gold chopped around to finish roughly unchanged.
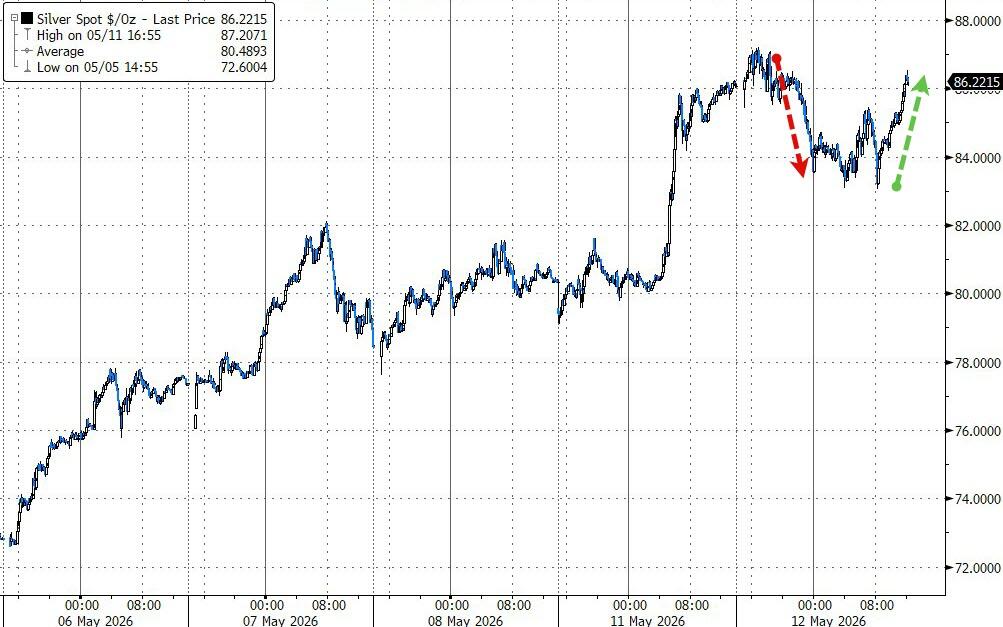
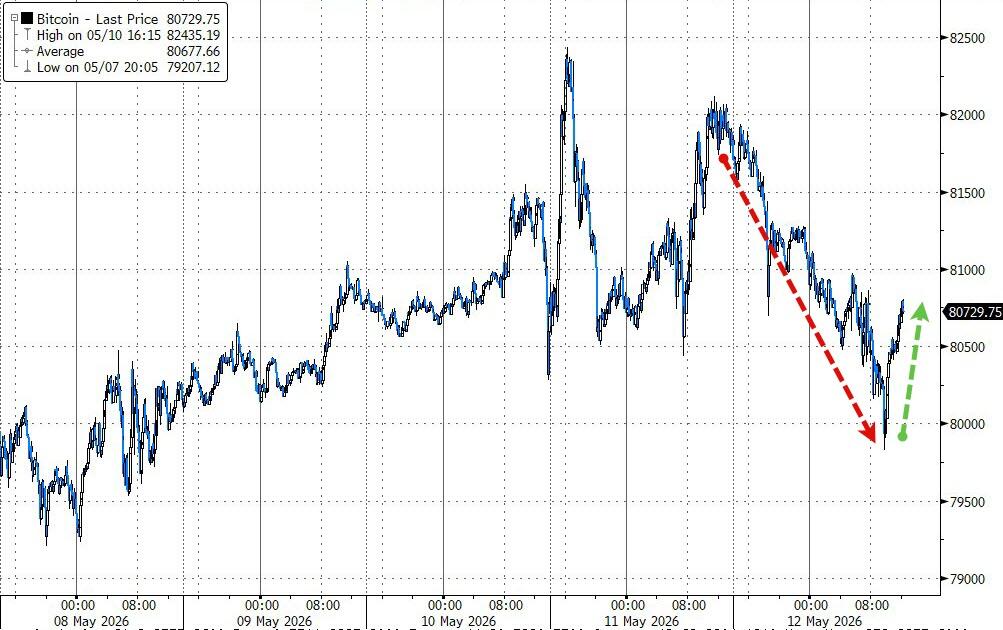
Silver shook off early weakness and closed higher, while Bitcoin slipped but found support near the $80,000 level.
All told, it had the feel of a risk‑off day, with hopes for easing tensions between the U.S. and Iran pushed firmly to the back burner.
The question now is: how much longer can markets shrug off rising inflation and geopolitical uncertainty before it really starts to matter?
2. Current domestic “Buy” Cycle (effective 5/20/2025); International “Buy” Cycle (effective 5/8/25)
Our domestic bullish cycle that began on November 21, 2023, concluded on April 3, 2025, following a market downturn triggered by President Trump’s tariff policy announcement.
This development caused significant declines across major indexes and broader market indices. However, markets subsequently rebounded, culminating in a new domestic “Buy” signal taking effect May 20, 2025.
Concurrently, our International Trend Tracking Index (TTI) experienced parallel volatility. On April 4, 2025, it breached critical thresholds, prompting a “Sell” recommendation. This position reversed as global markets recovered, with the International TTI regaining sufficient momentum to issue a new “Buy” signal effective May 8, 2025.
3. Trend Tracking Indexes (TTIs)
The major indexes opened the day in the red but managed to claw their way back from midday lows.
In the end, only the Dow finished in positive territory, while the broader market remained mixed.
Metals were uneven, though copper stood out, jumping nearly 2.7% on the session.
Our TTIs moved lower overall, with the international TTI taking the bigger hit while the domestic version held up a bit better.
This is how we closed 05/12/2026:
Domestic TTI: +5.77% above its M/A (prior close +5.86%)—Buy signal effective 5/20/25.
International TTI: +9.53% above its M/A (prior close +10.02%)—Buy signal effective 5/8/25.
All linked charts above are courtesy of Bloomberg via ZeroHedge.
———————————————————-
WOULD YOU LIKE TO HAVE YOUR INVESTMENTS PROFESSIONALLY MANAGED?
Do you have the time to follow our investment plans yourself? If you are a busy professional who would like to have his portfolio managed using our methodology, please contact me directly to get more details.
Contact Ulli