
- Moving the market
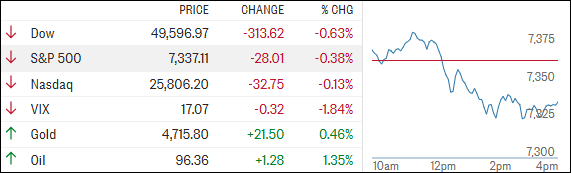
The S&P 500 pushed to a fresh all‑time intraday high early on as oil prices fell for a second straight day, fueled by hopes that the U.S. and Iran are closing in on an agreement to end the war.
The Nasdaq joined in with a new record of its own, while the Dow hovered around the flatline.
Lower oil wasn’t the only tailwind. Another batch of strong earnings helped keep sentiment upbeat. Fortinet surged 22% after raising its full‑year billings guidance, while DoorDash climbed more than 1% on optimistic second‑quarter order guidance.
That optimism built on yesterday’s rally, which followed an Axios report suggesting the White House believes it’s close to finalizing a one‑page, 14‑point memorandum of understanding with Iran. The proposed framework would not only end the war but also lay the groundwork for broader nuclear talks.
Unfortunately for bulls, the familiar headline roulette returned later in the day. News that the U.S. could restart “Project Freedom,” combined with Iran reaffirming its “uranium red lines,” knocked the major indexes off their highs and dragged them to a red close.
Even solid jobless claims data—showing no real cracks in the labor market—wasn’t enough to keep the early momentum alive.
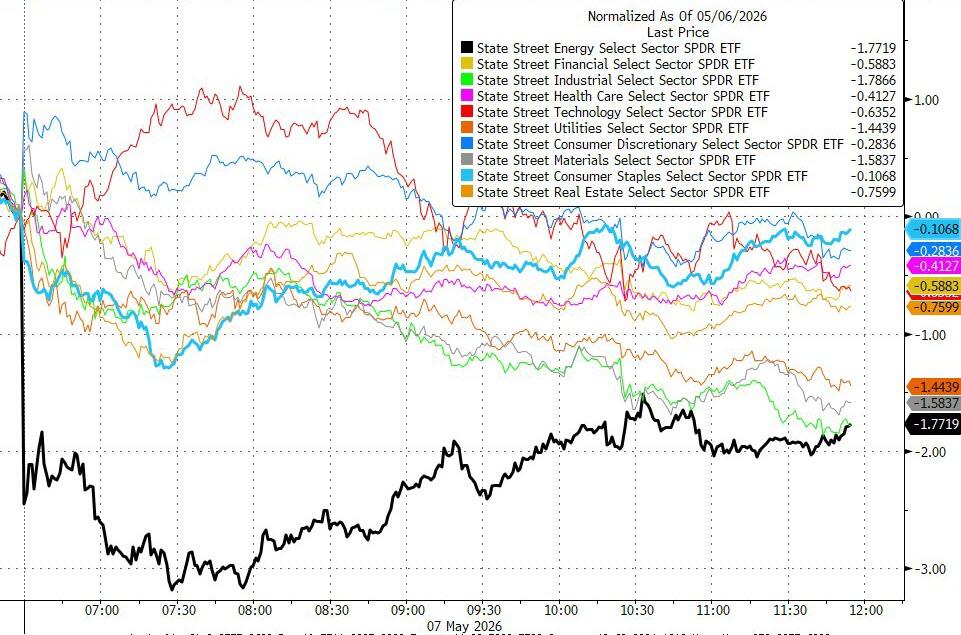
By the close, every sector finished in the red. Energy was hit the hardest, while consumer staples were the least ugly, as ZeroHedge aptly put it.
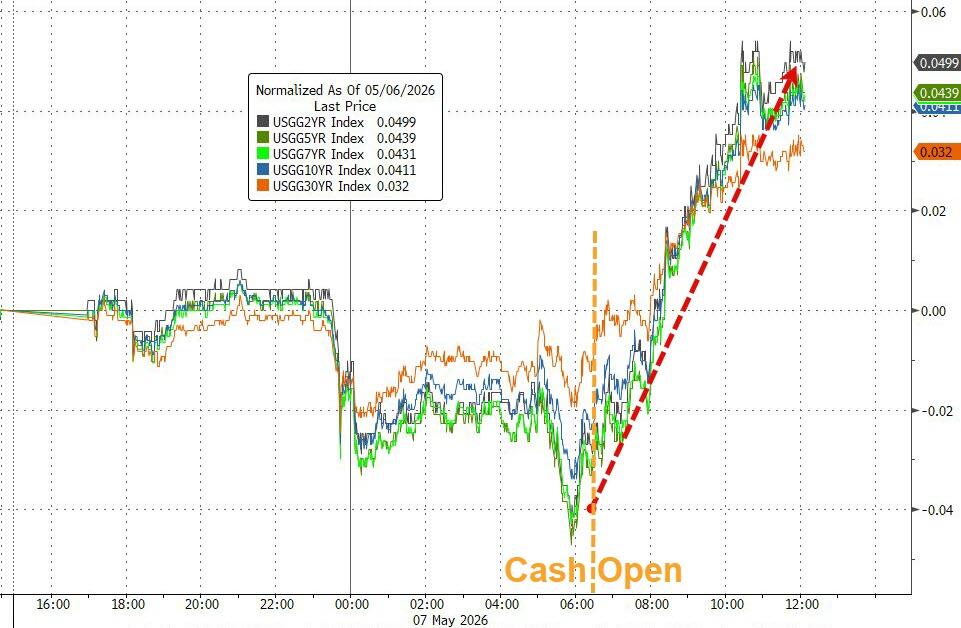
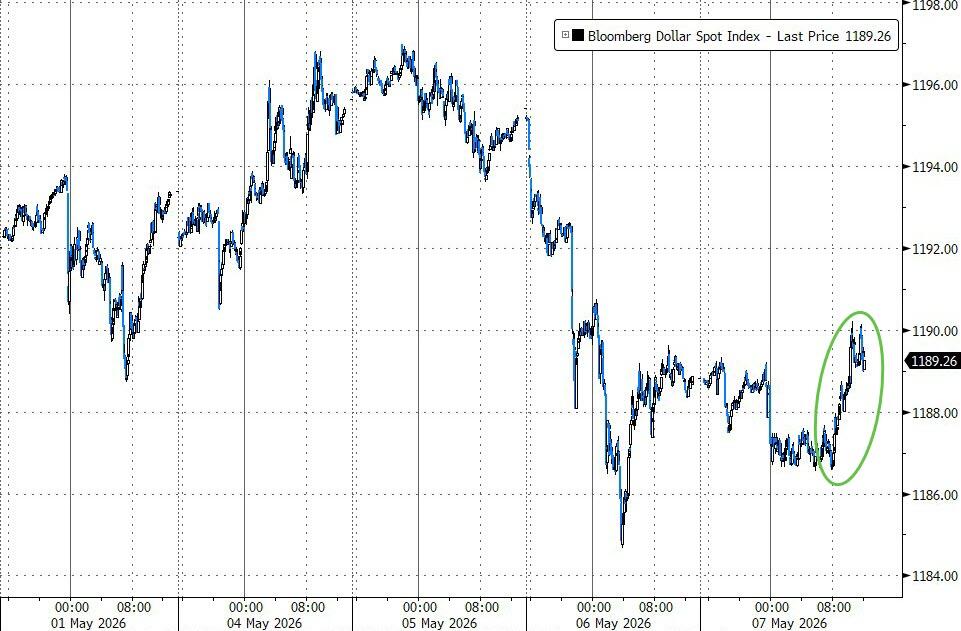
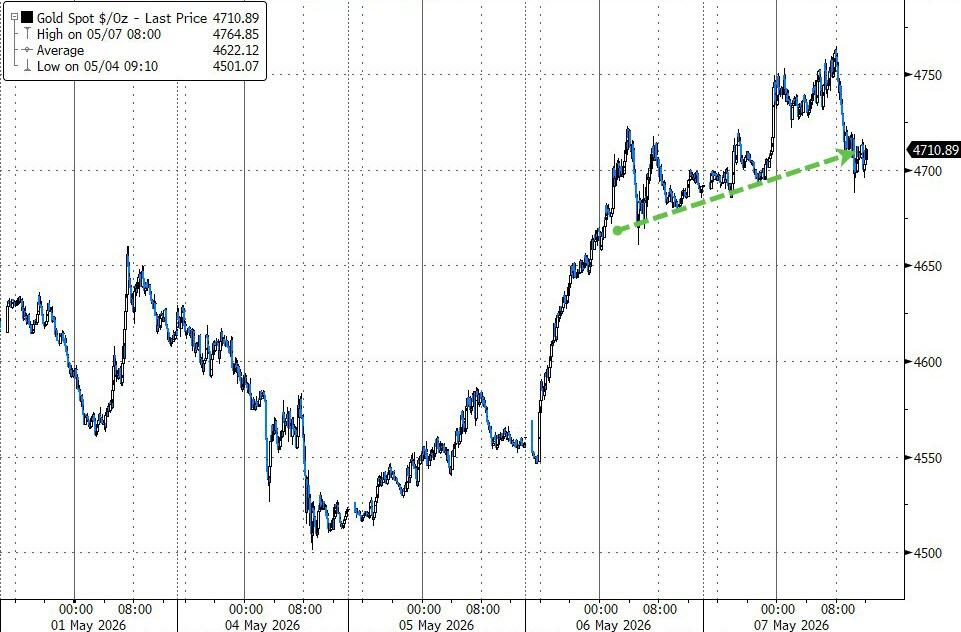
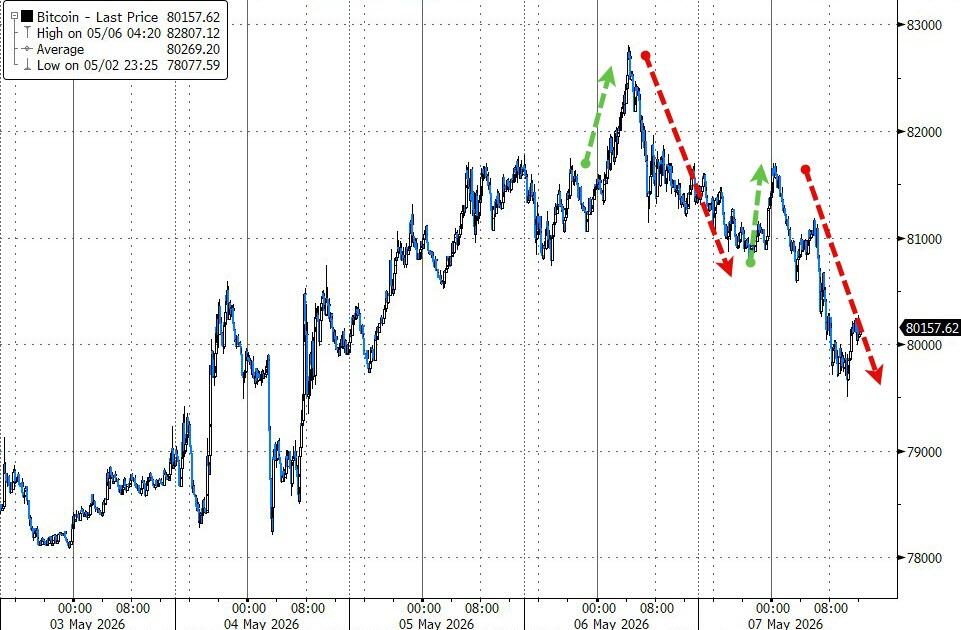
Rising bond yields added pressure, the dollar rallied, yet gold still managed to eke out a modest gain. Bitcoin pulled back from yesterday’s highs, drifting lower before finding support around the $80,000 level.
With traders now turning their attention to tomorrow’s jobs report—and the ever‑shifting Middle East narrative—the big question is: will economic data finally take the wheel, or will geopolitics continue to call the shots?
2. Current domestic “Buy” Cycle (effective 5/20/2025); International “Buy” Cycle (effective 5/8/25)
Our domestic bullish cycle that began on November 21, 2023, concluded on April 3, 2025, following a market downturn triggered by President Trump’s tariff policy announcement.
This development caused significant declines across major indexes and broader market indices. However, markets subsequently rebounded, culminating in a new domestic “Buy” signal taking effect May 20, 2025.
Concurrently, our International Trend Tracking Index (TTI) experienced parallel volatility. On April 4, 2025, it breached critical thresholds, prompting a “Sell” recommendation. This position reversed as global markets recovered, with the International TTI regaining sufficient momentum to issue a new “Buy” signal effective May 8, 2025.
3. Trend Tracking Indexes (TTIs)
Early positive momentum quickly faded, with markets losing steam and reversing course as the session progressed.
By the close, the major indexes had slipped into the red, giving back their early gains.
Metals were the exception and managed to hold their ground, but our TTIs weren’t as lucky.
Both pulled back moderately, reflecting the broader market weakness without signaling any major shift in trend.
This is how we closed 05/07/2026:
Domestic TTI: +5.96% above its M/A (prior close +6.64%)—Buy signal effective 5/20/25.
International TTI: +9.65% above its M/A (prior close +10.19%)—Buy signal effective 5/8/25.
All linked charts above are courtesy of Bloomberg via ZeroHedge.
———————————————————-
WOULD YOU LIKE TO HAVE YOUR INVESTMENTS PROFESSIONALLY MANAGED?
Do you have the time to follow our investment plans yourself? If you are a busy professional who would like to have his portfolio managed using our methodology, please contact me directly to get more details.
Contact Ulli